Also available as Adobe PDF (1.5 MB)
The Illinois Department of Transportation (IDOT), the Federal Highway Administration (FHWA), the Federal Aviation Administration, and the Illinois State Toll Highway Authority evaluated transportation improvements in the area on the west side of Chicago’s O’Hare International Airport. These agencies jointly served as lead agencies in the evaluation of the proposed Elgin O’Hare-West Bypass (EO-WB) project. The EO-WB project was advanced as a tiered Environmental Impact Statement (EIS) process. The study area of the EO-WB project is shown in figure 1.
The action proposed by these agencies was comprised of three elements that include roadway, transit, and bicycle/pedestrian improvements. These improvements respond to the needs of an area that is an important transportation node in the Chicago metropolitan area and is the center of many interstate highways, railroads, and an international airport. The area is further defined by extensive commercial and industrial development in the vicinity of O’Hare Airport. This development is dependent upon reliable travel efficiency and access to maintain and improve the competitive position of the region. Based on the needs of the area, as defined with consideration of existing travel conditions and stakeholder input, the purposes of the proposed project included:
The Build Alternative shown in figure 2 was selected as the preferred alternative for the EO-WB Project. The Build Alternative will be developed as a toll road that consists of 16 miles of new toll road, about nine miles of improvements to existing toll roads (I-294 and I-90) and freeway (I-290), and 16 miles of supporting arterial improvements. Complementing the mainline improvements are four system interchanges, 16 local access interchanges, and intersection improvements on nearby arterials. Provisions for transit are incorporated into the median for a portion of the project, and bicycle and pedestrian facilities also are included. The travel benefits of the proposed project include an increase in the overall travel efficiency of up to 17 percent; reduced congestion and delay savings on secondary roads up to 16 percent and 24 percent, respectively; and an increase in transit trips. (IDOT et al., 2012)
The Build Alternative of this project was approved via the Record of Decision, which was signed on December 12, 2012. (FHWA 2012)
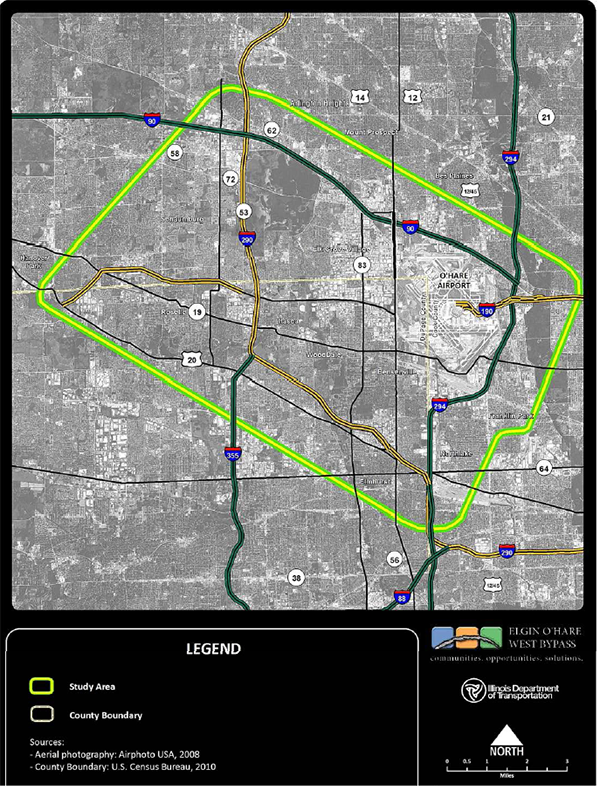
Source: IDOT et al., 2012.
Figure 1. EO-WB study area.
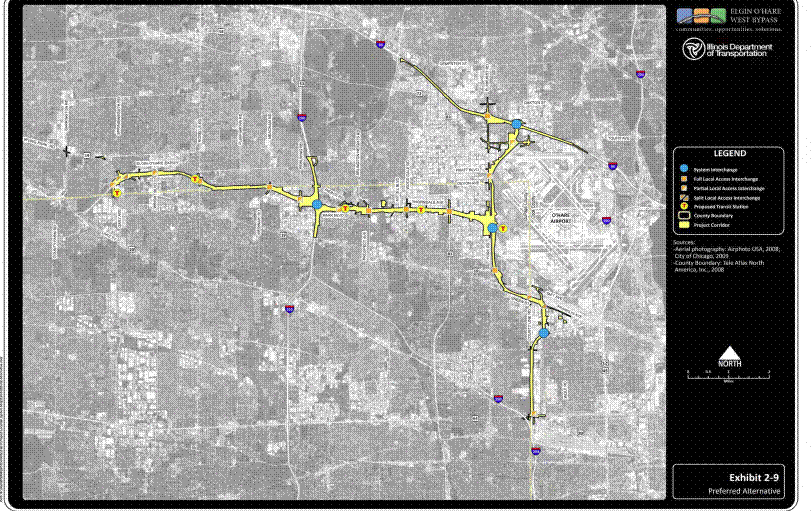
Source: IDOT et al., 2012.
Figure 2. EO-WB Project Preferred Alternative.
The EO-WB project is located in a nonattainment area for ozone and fine particulate matter (PM2.5) and is a maintenance area for PM10. The Interagency Consultation Group (ICG) , which included representatives from IDOT, FHWA, Illinois Environmental Protection Agency (IEPA), U.S. Environmental Protection Agency (EPA), Chicago DOT, and others, determined the need for a particulate matter (PM) quantitative hot-spot analysis for the project, and is a project with higher potential for MSAT effects because it meets the following criteria outlined in the FHWA’s 2009 Interim MSAT guidance:
“Create new or add significant capacity to urban highways such as interstates, urban arterials, or urban collector-distributor routes with traffic volumes where the AADT is projected to be in the range of 140,000 to 150,000 or greater by the design year; and also, Proposed to be located in proximity to populated areas.” (IDOT et al., 2012 and FHWA 2009)
Per FHWA guidance, projects falling within this category should be more rigorously assessed for impacts. (FHWA 2009)
Construction of the project was expected to take place in phases, with the initial construction phase occurring from 2013 to 2025. Construction for the entire project was expected to be completed by 2040. A quantitative analysis was performed to estimate project area-specific emissions of the priority MSATs for the 2010 existing conditions and to forecast emissions in 2040, the expected project completion year, for the No-Build and Build Alternatives.
The ICG was consulted frequently by the project team for inputs and guidance on all of the air quality analyses performed for the EO-WB project. The air quality analyses for the project were initiated in 2010, before the Motor Vehicle Emission Simulator (MOVES) was designated as EPA’s required onroad vehicle emissions model for State Implementation Plans, transportation conformity analyses, and project-level analyses. However, the ICG decided to use MOVES to estimate emissions in these analyses because the analysis would be completed around the time when MOVES would become the required model for quantitative carbon monoxide and PM hot-spot analyses for project-level conformity determinations (December 20, 2012 for MOVES2010a or MOVES2010b). In addition, the ICG wanted to evaluate the ease of use of MOVES and the data requirements. (Martin 2015) A quantitative PM2.5 hot-spot analysis also was performed for this project; many of the data inputs and assumptions developed for the PM2.5 analysis also were used in the MSAT analysis.
Table 1 presents the MSAT emission results for the 2010 existing condition along with the 2040 emissions for the No-Build and Build Alternatives. This table also shows the percentage change in emissions from 2010 to the 2040 Build Alternative and from the 2040 No-Build to the 2040 Build Alternative. Daily emissions were estimated for each priority MSAT using MOVES. (Note that FHWA’s 2015 guidance recommends estimating annual, not daily, emissions.) The estimates used average daily travel (ADT) volumes and average speeds for access-controlled facilities, primary arterials, and minor arterials in the project area.
Daily Project Area MSAT Emissions (lbs/day) |
Percent Changed |
||||
|---|---|---|---|---|---|
Pollutant |
2010 Existing Condition |
2040 No-Build Alternative |
2040 Build Alternative |
2010 Existing to 2040 Build |
2040 No-Build to 2040 Build |
Acrolein |
3.7 |
0.5 |
0.6 |
-84% |
20% |
Benzene |
50.9 |
11.8 |
13.4 |
-74% |
14% |
1, 3–Butadiene |
12.2 |
2.4 |
2.8 |
-77% |
17% |
Formaldehyde |
75.8 |
8.4 |
9.6 |
-87% |
14% |
Naphthalene |
23.2 |
16.8 |
19.4 |
-16% |
15% |
Polycyclic Organic Matter (POM)a |
NA |
NA |
NA |
NA |
NA |
Diesel PMb |
685.9 |
27.8 |
31.9 |
-95% |
15% |
VMTc (million miles) |
5.047 |
5.512 |
6.387 |
27% |
16% |
Source: IDOT et al., 2012. a POM emissions are not calculated by MOVES2010a, but the trend would be similar to that for naphthalene. b PM10 emissions from diesel running exhaust and crankcase exhaust. c Daily vehicle-miles of travel (VMT) estimated by SC&A from hourly link-level volumes and distance from the Air Quality Appendix of the FEIS. d Percent change was calculated by SC&A based on the data as shown in the FEIS. |
|||||
Table 1 shows an increase in daily travel of 16 percent from the 2040 No-Build Alternative to the 2040 Build Alternative. While this increase may seem to contradict the stated benefits of the project, including increased travel efficiency and reduced congestion, traffic on the new bypass in the 2040 Build Alternative accounts for nearly 60 percent of this increase, and this is a new road that is not included in the No-Build Alternative. Thus, this portion of the increased travel is not causing additional congestion on the existing roadways.
The MSAT emission calculations built on the PM hot-spot analysis traffic network. A detailed traffic analysis was performed to develop link-level activity data and combined with the MOVES inputs that were developed primarily by adapting MOBILE6 data files that had been used in previous regional analyses for this area.
A critical piece of the MSAT quantitative emissions analysis was the traffic model used in this analysis. Because a quantitative PM hot-spot analysis was needed for this project, the MSAT analysis used the same modeled network as that for the PM analysis. Appendix A shows the roads included in the MSAT network and the average daily traffic volume for each roadway link for each of the three modeled scenarios.
The project analysts started with the Chicago Metropolitan Agency for Planning (CMAP) travel model and built their own model with more detail for this project, including traffic data and employment data. The model was used for all forecasts and assignments to roadway in the air quality analyses for this project. The project was broken into links. Travel along the links was evaluated for a.m. and p.m. peak periods and off-peak periods, and then total ADT was calculated for each link by appropriately combining the data from these three daily periods. For the MSAT analysis, the average hourly ADT volumes by link were modeled (i.e., the ADT total divided by 24 hours). Although this project was modeled at the link level in MOVES, the speeds modeled at the link level were strictly dependent upon the roadway functional class, with all links in a given functional class assigned the same speed.
The MOVES2010a model was used to calculate hourly onroad emissions. (EPA 2010) This analysis used the “Project” scale of MOVES2010a along with the “Inventory” calculation type. Use of the project scale requires hourly link-level activity inputs. The project scale was chosen to use link-level traffic data, consistent with the PM hot-spot analyses performed for this project. However, unlike the PM hot-spot analyses, the traffic inputs for the MSAT analysis were based on average daily traffic, divided by 24 to get an hourly average value. Benzene, naphthalene, 1,3–butadiene, formaldehyde, and acrolein emission outputs for running exhaust and crankcase running exhaust emissions were modeled. Diesel PM10 was modeled to include running exhaust and crankcase running exhaust. POM emission estimates were not available from MOVES2010a, and so were not estimated in this analysis. All expected vehicle type/fuel type combinations were modeled, for the two urban road types in MOVES.
The Illinois EPA provided the project team with MOBILE6 input files that had been used for regional emissions analyses, including age distribution, vehicle mix, meteorological data, and fuel data specific to the project area. The MOVES input data files developed for this project were consistent with the IEPA MOBILE6 input data whenever possible to remain consistent with regional emissions estimates. The MOBILE6 age distribution and meteorological data files were converted to the required MOVES format using data converters available from the U.S. EPA. The default fuel specification and formulation data within MOVES for DuPage County was compared to the provided MOBILE6 fuel data from IEPA and the default MOVES fuel data was determined to be appropriate for this analysis. The MOVES vehicle mix was created manually using the data from the MOBILE6 inputs.
Project-level link files were developed for input to MOVES, modeling roadway type, link length, link volume, and link average speed for each of 119 individual links. Project-specific data was obtained from the traffic analysis described above. Table 2 summarizes the sources of the data used in developing the necessary MOVES input data files for this MSAT project-level analysis.
Hourly emissions of each pollutant were calculated for each link using MOVES. Emissions from each link were summed and then multiplied by 24 hours to estimate the total daily emissions of each pollutant. Note that this method would not account for fluctuations in emissions that might occur over the course of a day due to fluctuations that occur during the day in traffic volumes and meteorological conditions.
| Input | Data Source |
Notes |
|---|---|---|
Age Distribution |
IEPA |
Converted to MOVES format using EPA converter |
Fuel Supply |
MOVES defaults |
MOVES defaults for DuPage County |
Fuel Formulation |
MOVES defaults |
MOVES defaults for DuPage County |
Meteorological Data |
IEPA |
Converted to MOVES format using EPA converter |
I/M Programs |
IEPA |
Converted to MOVES format using EPA converter |
Link Source Types |
IEPA |
Developed manually from MOBILE6 data |
Links |
Traffic Analysis |
Prepared for 119 links based on traffic analysis for project |
Based on the analysis shown in table 1, the project team noted that there are localized areas where VMT would increase, and other areas where VMT would decrease when comparing the Build and No-Build Alternatives. Therefore, it is possible that localized increases and decreases in MSAT emissions may occur.
The FEIS for this project concludes: “Emissions increase as a result of the project as compared to the No-Build Alternative by about 14 percent for each pollutant. However, this is a reduction of approximately 80 percent as compared to the existing MSAT emissions. This is consistent with U.S. Environmental Protection Agency in that national control programs will reduce annual MSAT emissions by 72 percent between 1999 and 2050.” (IDOT et al., 2012)
These decreases occurred even though total travel volumes increase by about 27 percent when comparing the 2040 Build Alternative to the 2010 Existing Condition.
The ICG was very active with this project and was consulted frequently, providing input to the analysis at every step. The participating agencies were very helpful and were eager to learn about the process for using MOVES in preparing PM and CO hot-spot analyses and for MSAT project-level analyses. The group was initially concerned that the data needed for these quantitative MOVES analyses would be very labor intensive to obtain. At the end of the project, however, the team found that the analysis proved to be manageable in terms of the data requirements and the ease of use was found to be acceptable. (Martin 2015) The project team had not participated in an FHWA MSAT training and did not have any MSAT-specific resources.
The travel model facilitated the ability to perform the analysis and drove the methodology, which was to apply MOVES at a link level based on link-level speed and volume information from the model. The link-level travel network was finalized after several iterations of traffic modeling, with feedback and assistance from the ICG at each iteration. The project team would have used the same approach to developing the traffic inputs for the MSAT analysis even if a PM analysis had not been needed, as the travel model enabled the modelers to obtain the necessary data without being overly burdensome.
EPA 2010. “Motor Vehicle Emission Simulator (MOVES)—User Guide for MOVES2010a,” EPA-420-B-10-036, U.S. Environmental Protection Agency Office of Transportation and Air Quality, August 2010.
FHWA 2009: “Interim Guidance Update on Mobile Source Air Toxic Analysis in NEPA,” Federal Highway Administration, 2009.
FHWA and FAA 2012: “Tier Two Record of Decision, Elgin O’Hare-West Bypass, Cook and DuPage Counties, Illinois,” Federal Highway Administration and Federal Aviation Administration, December 2012, available at http://apps.dot.illinois.gov/fileexplorer/?search=environment/Elgin-Ohare%20Final%20EIS.
FHWA 2015: “Frequently Asked Questions (FAQ): Conducting Quantitative MSAT Analysis for FHWA NEPA Documents,” Federal Highway Administration, September 2, 2015, available at http://www.fhwa.dot.gov/environment/air_quality/air_toxics/policy_and_guidance/moves_msat_faq.cfm.
IDOT et al., 2012: “Elgin O’Hare-West Bypass Study, Tier Two Final Environmental Impact Statement,” Illinois Department of Transportation, U.S. Department of Transportation Federal Highway Administration, Federal Aviation Administration, and Illinois Tollway, October 2012, available at http://apps.dot.illinois.gov/fileexplorer/?search=environment/Elgin-Ohare%20Final%20EIS.
Martin 2015: Larry Martin (formerly of CH2M Hill), personal communication with M. Mullen, SC&A, Inc., November 30, 2015.