
Also available as Adobe PDF (611 KB)
The Georgia Department of Transportation (GDOT) identified that transportation improvements were needed to respond to concerns over growth in travel demand on Interstate 75 (I-75) and Interstate 575 (I-575), northwest of downtown Atlanta. The Northwest Corridor (NWC) project was designed to address these concerns related to transportation capacity deficiencies, as well as to provide additional transportation choices, improve mobility and connectivity between activity centers, and reduce single-occupancy vehicle travel while avoiding or minimizing adverse environmental impacts.
Figure 1 illustrates the project area. I-75 is the main freeway serving the Northwest Corridor of Atlanta. It is the primary route for commuters traveling to jobs within the region and to downtown Atlanta. As a major north-south route through Georgia, I-75 also serves the transportation needs for regional travel and freight trucking. I-75 merges with I-85 through downtown Atlanta. Between I-85 and I-285, I-75 is 10 lanes, with four general purpose lanes and a high-occupancy vehicle (HOV) lane in each direction. The existing HOV system ends at Akers Mill Road just south of I-285.
Under the Selected Alternative, two new reversible managed lanes will be constructed on I-75 between I-285 and the I-75/I-575 interchange. A single reversible managed lane will continue north on I-75 from the I-75/I-575 interchange to Hickory Grove Road. Similarly, a single reversible managed lane will continue north on I-575 from the I-75/I-575 interchange to a point south of the Sixes Road interchange. The length of the managed lane segment on I-75 is approximately 17 miles, and approximately 11 miles on I-575. Connecting the I-75 managed lanes to I-285 will require approximately 2 miles of construction on I-285 for a total project length of approximately 30 miles. The new managed lanes south of the I-75/I-575 interchange will be designed for highway speeds of 55 mph, while the new managed lanes north of the I-75/I-575 interchange will be designed for highway speeds of 65 mph.
GDOT prepared a Final Environmental Impact Statement (FEIS) for this project to fulfill requirements of the National Environmental Policy Act (NEPA) and State review process in October 2011, followed by an FEIS Reevaluation in March 2013. This project was approved by Federal Highway Administration (FHWA) with a Record of Decision signed on May 23, 2013. A further reevaluation of this project was conducted by GDOT in 2014, with FHWA approval on September 16, 2014. (GDOT 2014). A 2014 reevaluation of the project included. Additional environmental reevaluations of this project have occurred since the approval of the 2014 reevaluation. (GDOT 2016).
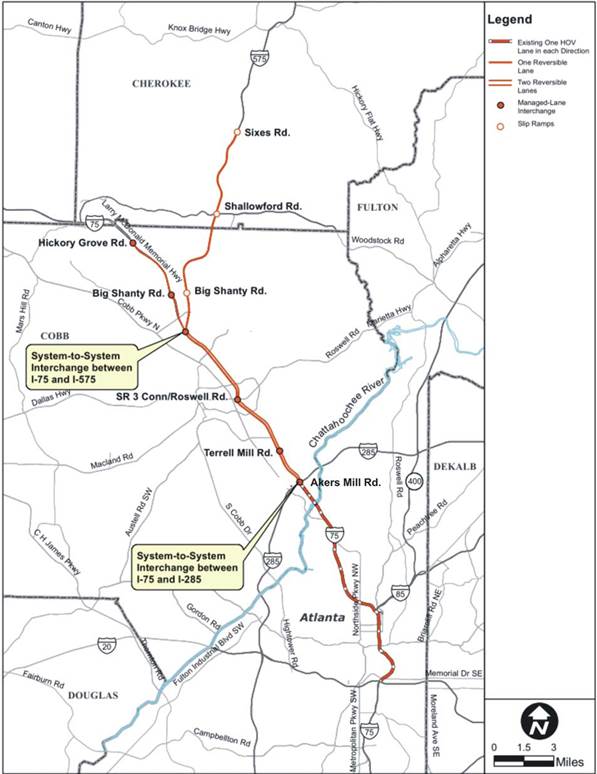
Source: GDOT 2014.
Figure 1. Northwest Corridor Project area.
GDOT made the determination that a quantitative MSAT analysis was needed for this project. Based on GDOT’s assessment, the Northwest Corridor project falls into the third category of project types from FHWA Interim Guidance (FHWA 2012) due to the expected traffic volumes and the proximity of the project to populated areas. The projected design year (2035) traffic volumes near the south end of the project of 301,800 vehicles per day (I-75 south of Delk Road) exceed the 140,000 to 150,000 annual average daily traffic (AADT) threshold in FHWA’s guidance. (GDOT 2014) As such, the project meets FHWA’s criteria for projects with higher potential for MSAT effects, triggering the need for a quantitative MSAT analysis. (FHWA 2012)
At the time the FEIS was prepared, the U.S. Environmental Protection Agency’s (EPA) Motor Vehicle Emission Simulator (MOVES) model was not yet required to be used in regional conformity modeling, so the Atlanta Regional Commission (ARC), the regional planning agency, had not yet developed the necessary MOVES inputs to estimate onroad emissions for the Atlanta area using MOVES. However, by the time of the 2014 reevaluation of the project, the necessary local MOVES data were available from ARC, so GDOT made the determination to reevaluate MSAT impacts from this project using MOVES. (Philips 2015) GDOT was the project lead for this MSAT analysis. Since the MSAT analysis for the NWC project was the first MSAT analysis done by GDOT, and due to the time-sensitive nature of the project, FHWA assisted GDOT by performing the MOVES portion of the MSAT analysis for the 2014 reevaluation.
MSAT emissions from this project were estimated for a base year (2010), the expected first year of operation (2018), and the project design year (2035). A base year of 2010 was selected to provide reviewers with an estimate of emissions currently being experienced by the population that would be affected by this project. For the two projection years, 2018 and 2035, emissions were calculated for a No-Build condition and a Selected Alternative condition in which the effects of the project are accounted for. Emission calculations for these years and scenarios enabled reviewers to observe the trend in emissions over time, as well as the emission impacts due to the selected project in key years. Table 1 summarizes the MSAT emissions by pollutant and total MSAT emissions in each modeled year and scenario. This table also shows the corresponding vehicle miles traveled (VMT) total associated with these emissions. Diesel VMT also is shown as the diesel PM emissions in table 1 represent emissions from diesel vehicles only.
| Pollutant | Annual Emissions (tons/year) |
Percent Change 2010 to 2035 Selected |
Percent Change 2035 No Build to 2035 Selected |
|||||
|---|---|---|---|---|---|---|---|---|
2010 Base Year |
2018
No Build |
2018 Selected Alternative |
2035 No Build |
2035 Selected Alternative |
||||
Acrolein |
1.4 |
0.55 |
0.55 |
0.27 |
0.27 |
-81% |
0.0% |
|
Benzene |
13.0 |
5.0 |
5.0 |
3.9 |
3.9 |
-70% |
0.0% |
|
1,3–Butadiene |
2.1 |
0.77 |
0.77 |
0.52 |
0.53 |
-75% |
1.9% |
|
Diesel PM |
180 |
55 |
55 |
14 |
14 |
-92% |
0.0% |
|
Formaldehyde |
19.0 |
8.6 |
8.6 |
5.8 |
5.9 |
-69% |
1.7% |
|
Naphthalene |
2.4 |
0.95 |
0.95 |
0.56 |
0.57 |
-76% |
1.8% |
|
Polycyclic Organic Matter |
1.2 |
0.41 |
0.41 |
0.13 |
0.13 |
-89% |
0.0% |
|
VMT Total (million miles) Diesel VMT (million miles) |
2,682 354 |
2,924 381 |
2,951 383 |
3,350 435 |
3,458 436 |
29% 23% |
3.2% 0.2% |
|
Source: GDOT 2014.
Based on the analysis shown in Table 1, MSAT emissions in the area of the Northwest Corridor project are expected to decline by about 70 to 90 percent from 2010 to 2035, regardless of whether the project is built. Diesel PM emissions show the greatest decrease of all MSAT pollutants at 92 percent. These emission reductions are projected to occur even with a projected 29 percent increase in VMT that is expected to occur over the same time period.
Figure 2 shows the resulting affected network included in the MSAT modeling of the NWC project. To develop the affected MSAT network, GDOT attempted to identify the segments of the roadway network that would be affected by the proposed the project in a meaningful way. This included evaluating links that met one or more of the following metrics for determining meaningful changes in travel activity when comparing the Selected Alternative and No-Build networks, using the ARC regional travel model:
GDOT initially identified all links that met one or more of these criteria. This initial set of affected links was then further refined by applying knowledge of the area and engineering judgment to better identify just the links for which the changes were likely to have been caused by the NWC project and not by artifacts of the modeling. GDOT worked with the traffic modelers and local planners in this process. GDOT also looked at the changes in volumes for links meeting the above criteria—very low volume roads were eliminated from the affected network. This was an involved and detailed process, including manual evaluation of the appropriateness of including certain links in the affected network. FHWA also collaborated with GDOT and their traffic consultant to finalize the affected network. (Philips 2015)
The U.S. Environmental Protection Agency’s (EPA) MOVES2010b model was used to calculate July daily onroad emissions (EPA 2012). Table 2 summarizes the selections that were made for each of the MOVES parameters in the MOVES graphical user interface (EPA 2012). These analyses used the MOVES model to calculate hourly emissions, using the MOVES “Inventory” mode for calculations, over an entire July day in the analysis year. All expected vehicle type/fuel type combinations were modeled, for the two urban road and two rural road types in MOVES. Separate runs were made for each of the four counties affected by this project—Bartow County, Cherokee County, Cobb County, and Fulton County—in each analysis year (2010, 2018, and 2035) and scenario. Off-network emissions (calculated by MOVES using the Off-network road type) were not included in this analysis. Only the VMT from the portions of the roadways included in the MSAT affected network, as illustrated in Figure 2, were included in the MOVES runs.
Table 3 summarizes the sources of data used for each of the MOVES inputs. Many of the MOVES data inputs needed for these MSAT analyses were provided by either ARC or developed from traffic data provided by GDOT. For fuel inputs, the MOVES defaults for the county and analysis year being modeled were used. Inputs that were developed specifically for this MSAT analysis included the average speed distribution, road type VMT fractions, and Highway Performance Monitoring System (HPMS) VMT for all scenarios modeled. While July was the only month modeled in MOVES, the meteorological data inputs for July represented the annual average temperatures and humidity by hour.
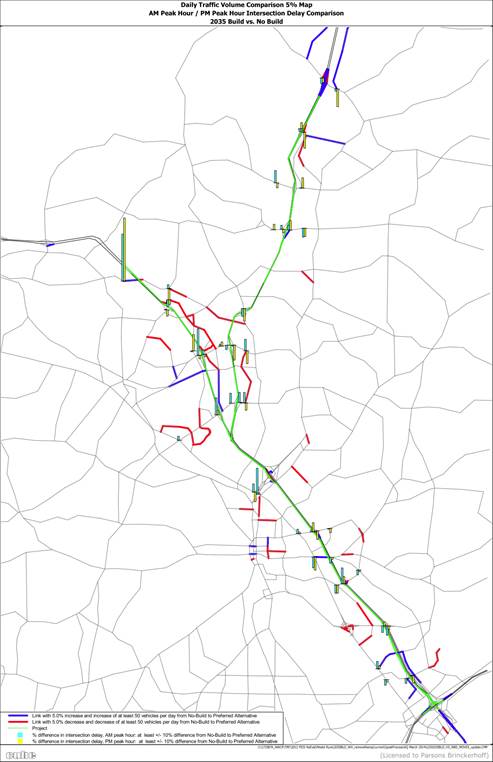
Source: GDOT 2014.
Figure 2. NWC project affected transportation network.
| Inputs | Selections |
|---|---|
Scale |
Domain/Scale: County Calculation type: Inventory |
Time Spans |
Time aggregation level: Hour Years: 2010, 2018, 2035 Months: July Days: Weekdays and weekends Hours: all 24 |
Geographic Bounds |
Separate runs for: Bartow County, Cherokee County, Cobb County, and Fulton County |
Vehicles/Equipment |
All allowable vehicle and fuel type combinations |
Road Type |
Rural restricted access Rural unrestricted access Urban restricted access Urban unrestricted access |
Pollutants |
Total Gaseous Hydrocarbons Non-Methane Hydrocarbons Volatile Organic Compounds Primary Exhaust PM10-Total Primary PM10-Organic Carbon Primary PM10-Elemental Carbon Primary PM10-Sulfate Particulate Primary PM2.5-Organic Carbon Total Energy Consumption Methane Nitrous Oxide Atmospheric CO2 CO2 Equivalent Benzene 1,3–Butadiene Formaldehyde Acrolein Polycyclic Aromatic Hydrocarbons |
Processes |
Running Exhaust Crankcase Running Exhaust |
General Output |
Mass units: Grams Energy units: Million Btu Distance units: Miles Activity: Distance traveled |
Output Emissions Detail |
Hour County Fuel Type |
| Input | Data Source |
Notes |
|---|---|---|
Age Distribution |
ARC |
|
Average Speed Distribution |
GDOT |
Data table developed from traffic provided by GDOT |
Fueltype and Technologies |
MOVES Default |
|
Fuel Supply |
ARC |
|
Fuel Formulation |
ARC |
|
Meteorology Data |
ARC |
|
Ramp Fraction |
GDOT |
Ramp Fraction = 0%; ramp activity is accounted for in the traffic data provided by GDOT |
Road Type Distribution |
GDOT |
Data table developed from traffic provided by GDOT |
Source Type Population |
ARC |
|
HPMS Vehicle Type Year |
GDOT |
Data table developed from traffic provided by GDOT |
Month VMT Fraction |
ARC |
|
Day VMT Fraction |
ARC |
|
Hour VMT Fraction |
ARC |
|
I/M Programs |
ARC |
Annual emissions were calculated by multiplying the MOVES-calculated July daily emissions by 31 days divided by the July monthly VMT fraction (0.09) and converting the results from grams to tons for each pollutant. The polycyclic organic matter (POM) emissions were calculated as the sum of the pollutants included in polycyclic aromatic hydrocarbons (PAH), as provided by MOVES, with the exception of naphthalene particle and gas.
This analysis shows a general emissions reduction for all seven MSAT compounds from 2010 to 2035 along the project corridor, which is consistent with the national trend. These reductions are primarily due to Federal motor vehicle and fuel control programs, even as vehicle activity increases during this time period.
The MSAT analysis for this project states: “The analysis concluded that reductions in MSAT emissions will occur for the transportation network affected by the project regardless of whether the project is constructed. Differences in emissions between the Selected and No-Build alternatives are indistinguishable. Compared to 2010 levels, emissions are reduced by almost 90 percent for either the Selected or No Build alternatives. Uncertainties in available information and tools preclude FHWA from being able to estimate the potential health impacts attributable to the MSAT compounds at current and projected emission levels.” (GDOT 2014)
GDOT, with its contractor, had previously prepared quantitative MSAT analyses for the Northwest Corridor project. However, this 2014 reevaluation was the first prepared using MOVES. FHWA was involved with GDOT throughout the project, serving as an important project resource, and sponsored an MSAT class for GDOT consultants.
GDOT has developed a process that has been used in other recent MSAT analyses prepared by GDOT since the Northwest Corridor analysis, all resulting in either a FONSI or ROD. This process includes having the consultant prepare a document of their approach for determining affected network links. GDOT has learned that planning ahead, gathering the correct data, performing early quality assurance, and setting up the analysis framework up front saves time and rework in the long run.
This analysis also served as a learning process for FHWA. Through their direct involvement with this project, FHWA was able to be more specific in the Frequently Asked Questions that they were developing related to preparing quantitative MSAT analyses. FHWA also developed workshop materials that have been presented in a number of areas based on the analysis completed for the Northwest Corridor. FHWA also noted that the affected transportation network should be based on available project-specific information (such as the environmental document traffic analysis) considering changes in several traffic metrics such as annual average daily traffic volumes, travel time, and intersection delay that could result in meaningful changes in MSAT emissions as a result of the project (e.g., ±10% or more). The affected transportation network should be developed in a manner consistent with the purposes of NEPA, which is to study the affected environment. (Claggett 2015)
EPA 2012. “Motor Vehicle Emission Simulator (MOVES)—User Guide for MOVES2010b,” EPA-420-B-12-001b, U.S. Environmental Protection Agency Office of Transportation and Air Quality, June 2012.
FHWA 2012: “Interim Guidance Update on Mobile Source Air Toxic Analysis in NEPA,” Federal Highway Administration, December 6, 2012.
GDOT 2014: “Project CSNHS-0008-00(256), Cobb and Cherokee Counties, PI No. 008256, Reevaluation,” State of Georgia Department of Transportation, August 12, 2014, available http://www.nwcproject.com/media/pdfs/REEVAL_PI/Reeval.pdf.
Claggett 2015: Michael Claggett, Federal Highway Administration, Air Quality Modeling Specialist, personal communication with M. Mullen, SC&A, Inc., October 22, 2015.
Dixon 2015: Chetna Dixon, Federal Highway Administration Georgia Division, Environmental Coordinator, personal communication with M. Mullen, SC&A, Inc., October 7, 2015.
Phillips 2015: Amber Phillips, Georgia Department of Transportation, Office of Environmental Services, personal communication with M. Mullen, SC&A, Inc., October 13, 2015.

