U.S. Department of Transportation
Federal Highway Administration
1200 New Jersey Avenue, SE
Washington, DC 20590
202-366-4000
California Division

OBJECTIVE: Metrics are used to help monitor, recognize, and correct problems as early as possible. Metrics need to be measured against a references so that deviations will trigger actions. Good metrics are meaningful [i.e., they represent the progress of the project or expected performance of the system], easy to collect, and help make a decision. |
DESCRIPTION: There are both technical and project management metrics. Technical metrics track how well the finished project will meet its performance objectives. Project management metrics are whatever should be tracked during each process step to reduce project risks and get what is expected. Cost and schedule are key project management metrics for any project. Other metrics may come out of the risk management process or performance requirements. Each activity described in Chapter 3 includes a list of suggested metrics to be tracked during or in support of that activity. |
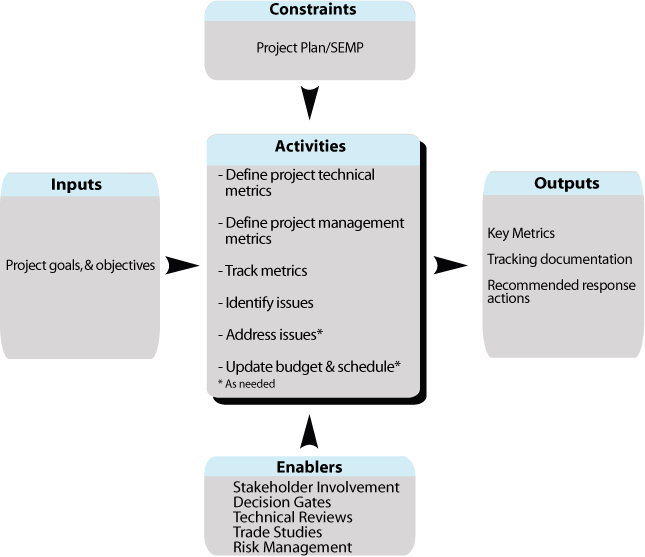
CONTEXT OF PROCESS:
METRICS PROCESS |
|
Inputs: Goals and objectives define direction, priorities, and change of course, if necessary. Metrics for project phase are defined by each project step to check its progress. |
Control: SEMP provides guidance for the systems engineering process. Schedule and Budget constrain the project. |
Enablers: Stakeholder involvement enables the stakeholders to suggest metrics and provide guidance. Control gates provide an opportunity for tracking progress. Risk management suggests and uses metrics. |
Outputs: Metricsare the selected measures of project progress and performance. Tracking documentation is a history of project progress relative to the metrics. Recommended response actions to noted project problems document the recourse and rationale. Technical reviews suggest metrics and review their tracking. Trade studies compare alternatives relative to the metrics.
|
Process Activities: Define technical metrics Technical metrics track the expected performance and effectiveness of the system being developed. These are related to the system mission. They often address critical performance parameters such as response time or accuracy. An example is the time to compose an Amber Alert message and get it displayed on CMS system-wide, since this must be done within 15 minutes. A Technical metrics topic [What should I track in this process step to reduce project risks and get what is expected?] is included in each chapter that related to the task. Define project management metrics Project management metrics track progress. Define metrics that indicate a potential problem. These, then, act as triggers for risk management. Each step of the systems engineering process has metrics associated with it. Each task in Chapter 3 includes a list of project-related metrics specific to that task. These give an indication of how far along the task is. For example, Concept Exploration has metrics for the percentage of candidate concepts evaluated and the percentage of stakeholders who have approved the study. In some cases the metrics will simply be whether or not something has been completed. There are other metrics related to milestones or to how much has been developed or delivered, such as the number of subroutines written or the lane-miles instrumented. Appropriate milestones should be meaningful and easy to track. Spending to date is always an essential metric. Track metrics Progress on the milestones and status of metrics relative to cost and schedule is compared regularly with the expected progress. A simple way to do this is to plot the metric relative to dollars spent. The best estimate of where the project will end up comes from extrapolating the line out to the end. This is because, despite all efforts to "catch up," projects that are behind tend to continue to fall behind by the same percentage. Identify problems If any of the metrics indicate a potential problem, use them to trace back to the source of concern. A fast and decisive response is necessary to get a project back on track. Asking the right questions will suggest what action to take. Are there any problems that are hindering development? Do we have the right resources? Is the budget realistic? Is the schedule realistic? Is the scope overly ambitious? Fix problems Make sure personnel are properly assigned and well used. Eliminate any efforts which do not trace back to the requirements, and are therefore unnecessary. Modify budget, schedule, or scope Sometimes project plans are overly optimistic. If everything possible to streamline the project and solve problems has been done, it may be that the scope of work cannot be completed within the time and budget allocated. Sometimes hard decisions need to be made, and will only get worse if delayed. Consider eliminating requirements of marginal value, extending the schedule, or asking for more budget. This is extremely disruptive, and should be avoided if at all possible. Ideally, the project plan is carefully and realistically developed up front, so that these types of changes are avoided. |
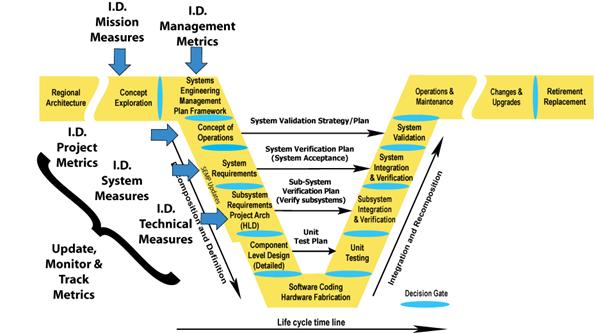
Where do metrics take place in the project timeline? |
Is there a policy or standard that includes Metrics?
FHWA Final Rule does not specifically mention practices to be followed for metrics. CMMI has material related to metrics
Which activities are critical for the system's owner to do?
How do I fit these activities to my project? [Tailoring]
The level of each activity should be appropriately scaled to the size of the project. For example, a small project will have fewer and less complex metrics. A larger project will more likely use earned value [see Closer Look, below] or similar techniques. Always track spending.
What should I track in this process step to reduce project risks and get what is expected? [Metrics]
On the technical side:
General technical metrics are based on the mission of the system being developed, and will be defined as part of this task. Examples are
On the project management side:
In addition, each project activity will have its own metrics. The specific metrics used will be selected as part of this activity.
Furthermore, this activity has metrics of its own:
Checklist: Are all the bases covered?
| Are the metrics good indications of the progress of the project? | |
| Are the metrics meaningful and clear? | |
| Are the metrics easy to collect? | |
| Do the metrics support making a good decision? | |
| Are the number and complexity of the metrics reasonable for the size and complexity of the project? | |
| Are the metrics tracked regularly? | |
| Is there a plan for identifying and responding to a lagging project? |
Are there any other recommendations that can help?
If the project is behind schedule early on, the temptation is to catch up by "working harder." In fact, studies show that projects tend to lag by the same percentage throughout their lifetime. The following paragraph provides a method called "earned value" is used to help clearly identify project progress.
A closer look at Earned value analysis is a technique for comparing actual and expected progress to date, and for estimating future progress. The earned value is simply the project budget multiplied by the percentage completed. For example, if a traffic signal system is being planned, a good metric could be the number of intersections completed. Further more, if 10 out of 50 intersections are completed, 20% of the work is done, and would have expected to have spent 20% of the budget. That is the earned value. Then, divide this by what was actually spent to date, to get the performance ratio. If it's equal to or greater than one the project is on or under the target spending rate but if it is less than one the project is overspending.
One can also estimate what it will cost to finish the project [cost to completion]. Divide the spending to date by the percentage complete. Compare this with the budget.
In the example above, the project has a $100,000 budget and has spent $20,000 to do $15,000 of work [15% of the job]. The earned value is $15,000, and the performance ratio is 15,000/20,000 = .75. This is less than one, and in fact it indicates that the project is 25% [1 - .75] behind. The estimated cost to complete is $20,000/.15 = $133,333, well above budget. This project needs to make changes.
It is generally difficult to estimate percentage completed. We have all known developers who were "90% done" during most of the project duration. A simple and more objective approach is to earn value only where there are clear milestones: specifically, at the beginning and end of each task. Rather than try to track progress on a small task, call it 100% only when it is complete, but 0% before that. A longer task would have a 50% earned value for getting started, and 100% only at the end. Combining these over many tasks gives a good indication of the overall project progress.
Combining metrics Alternative systems are often evaluated to more than a single metric. These metrics may have very different sizes and units [ [number of vehicles per hour, average speed, number of incidents, time to respond, mean time between failures, cost, rating on a scale of 1 to 5, and so on]. These must be normalized to a common scale before they can be combined in any meaningful way. There are many ways this can be done. The following ratio seems to give the most reasonable results. It compares expected performance of the candidate system to current performance.
For example, if the current system is 96% reliable, and the candidate is 98% reliable, here is how it will come out. The ideal is 100% reliable, so we get [1.00 -.96]/[1.00 - .98] = .04/.02 = 2. This agrees with our intuition that a 2% failure rate is twice as good as a 4% failure rate. This ratio works even if the metric is negative in other words, less is better. For example, if there are currently 300 major accidents a year and simulation shows that a candidate system will average only 200 accidents a year. Then, since 0 accidents is the ideal, we get [0 – 300]/ [0 – 200] = 1.5.
Once all of the metrics are normalized in this way they can be combined. Assign a weight to each of the metrics. Be sure the weights add up to 1. 'The weight is an indication of the relative importance of each of the metrics. For example, for a high-level freeway concept with the following weighted metrics:
Multiply each of the normalized metrics by its respective weight and add them together. The result is a unit-less measure of the goodness of each of the alternatives relative to the current system.
Life cycle costs can be included in this calculation. It is often more meaningful to separate it and plot overall effectiveness against cost. This allows one to take into account budget constraints, and to identify good low cost and high cost solutions, possibly with an evolutionary path between them.