This guide was updated in February 2017.
Transportation conformity is a process required by the CAA Section 176(c) which establishes the framework for improving air quality to protect public health and the environment. The goal of transportation conformity is to ensure that Federal Highway Administration (FHWA) and Federal Transit Administration (FTA) funding and approvals are given to highway and public transportation activities that are consistent with air quality goals.
The CAA requires that metropolitan transportation plans, TIPs and Federal projects conform to the purpose of the State Implementation Plan (SIP). Conformity to a SIP means that such activities will not cause or contribute to any new violations of the national ambient air quality standards (NAAQS); increase the frequency or severity of NAAQS violations; or delay timely attainment of the NAAQS or any required interim milestone. Conformity requirements apply in areas that either do not meet or previously have not met air quality standards for ozone, carbon monoxide, particulate matter or nitrogen dioxide. These areas are known as "nonattainment areas" or "maintenance areas," respectively. For a complete list of nonattainment and maintenance areas for these and other pollutants see 40 CFR Part 81 or http://www.epa.gov/oar/oaqps/greenbk/.
Pollutants that Come from On-Road VehIcles (e.g., cars, trucks, buses)
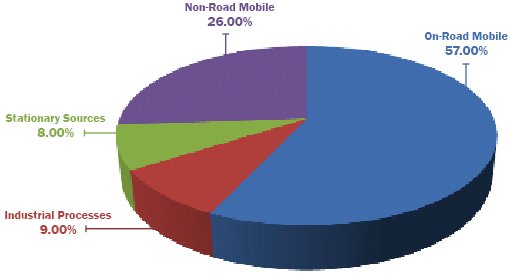
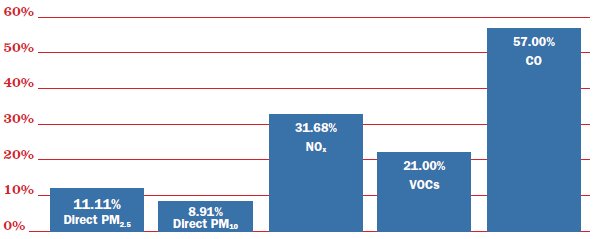
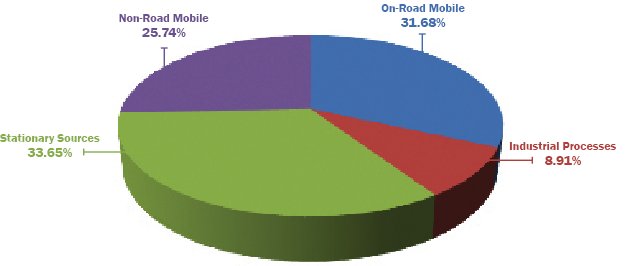
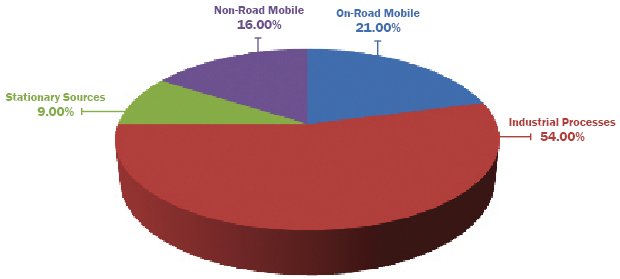
Transportation sources contribute to four of the six criteria pollutants for which EPA has established standards to protect public health and/or safety. The pollutants are: ozone (O3), carbon monoxide (CO), particulate matter (PM10 and PM2.5), and nitrogen dioxide (NO2). Appendix A provides basic facts about health impacts of these pollutants. Exhibit 2 shows the on-road percentage of total emissions by pollutant in 2008. Exhibit 3 shows the proportion of PM10, PM2.5, nitrogen oxides (NOx), volatile organic compounds (VOCs), and CO emissions from the various sources of pollution.
Exhibit 2
Emissions from On-Road Mobile Sources as a Percentage of All 2008 Emissions
Source: U.S. Environmental Protection Agency
Our Nation's Air: Status and Trends through 2008
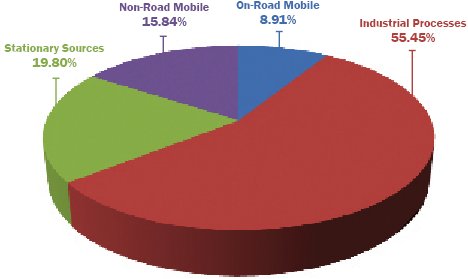
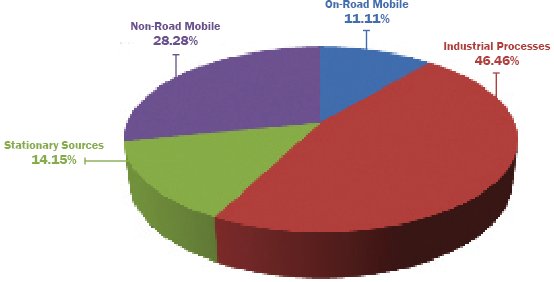
Exhibit 3
PM10 Emissions 2008
Source: U.S. Environmental Protection Agency
Our Nation's Air: Status and Trends through 2008
PM2.5 Emissions 2008
Source: U.S. Environmental Protection Agency
Our Nation's Air: Status and Trends through 2008
NOx Emissions 2008
Source: U.S. Environmental Protection Agency
Our Nation's Air: Status and Trends through 2008
VOC Emissions 2008
Source: U.S. Environmental Protection Agency
Our Nation's Air: Status and Trends through 2008
CO Emissions 2008
Source: U.S. Environmental Protection Agency
Our Nation's Air: Status and Trends through 2008