
MAY 2021
| 1. Report No. FHWA-HEP-21-021 |
2. Government Accession No. | 3. Recipient's Catalog No. | |||
| 4. Title and Subtitle TNMAide – Technical Description and User's Guide |
5. Report Date May 2021 |
||||
| 6. Performing Organization Code | |||||
| 7. Author(s) Roger L. Wayson, Ph.D., P.E., AECOM |
8. Performing Organization Report No. | ||||
| 9. Performing Organization Name and Address Cambridge Systematics, Inc. 101 Station Landing, Suite 410 Medford, MA 02155 |
10. Work Unit No. (TRAIS) | ||||
| 11. Contract or Grant No. DTFH6117D00008L, order no. 693JJ319F000305 |
|||||
| 12. Sponsoring Agency Name and Address Federal Highway Administration, Office of Natural Environment 1200 New Jersey Avenue, SE Washington, D.C. 20590 |
13. Type of Report and Period Covered Final Report |
||||
| 14. Sponsoring Agency Code HEP |
|||||
| 15. Supplementary Notes FHWA Review Team: Aileen Varela-Margolles, David Kall (COTR), Cecilia Ho |
|||||
| 16. Abstract TNMAide is a spreadsheet-based tool to determine the Worst Noise Hour in a given year, and calculate LDN and LDEN outside of TNM 3.0. TNMAide relies on the same acoustics in TNM 3.0; and on the outputs of the associated DANA Tool. The DANA tool is described in the other volume in this series. This volume is the second in a series. The other volume in the series is:
|
|||||
| 17. Key Words Traffic Noise Model, TNM 3.0, TNMAide Tool, Worst Noise Hour, LDN, LDEN, LEQ, Adjustment Factors |
18. Distribution Statement No restrictions. |
||||
| 19. Security Classif. (of this report) Unclassified |
20. Security Classif. (of this page) Unclassified |
21. No. of Pages 26 |
22. Price N/A |
||
| Form DOT F 1700.7 (8-72) Reproduction of completed page authorized | |||||
This document describes TNMAide, a spreadsheet to aid in the determination of the worst hour of the day, for use in the FHWAs Traffic Noise Model (TNM), as required by 23 CFR 772; and a method to estimate LDN and/or LDEN by using hour by hour data.
This is a sister program to the Database for Air Quality and Noise Analysis (DANA) Tool, which provides an output to use as the input for this spreadsheet tool. The DANA Tool uses speed data from the National Performance Management Research Data Set (NPMRDS), volume data from the Highway Performance Monitoring System (HPMS), and vehicle classification data from the Travel Monitoring Analysis System (TMAS).
Not all of the available data fields (columns) from the DANA Tool are used in TNMAide. However, no editing is needed as the file from the DANA tool has been standardized for the user to copy the output into the TNMAide spreadsheet. The data fields are listed below, most of which come from the NPMRDS dataset. Those shown in bold are directly used by TNMAide.
This document includes a User's Manual for the spreadsheet as well as a technical manual as an appendix that explains the processes used in these noise calculations. Instructions are also included directly in the spreadsheet. Information on obtaining the required input dataset, developed from data in the National Performance Management Research Data Set (NPMRDS), is included in the DANA User Guide.
TNMAide is a Microsoft Excel©-based tool. This tool is an aid to the use of the FHWA's main Traffic Noise Model (TNM) program.
The input data required to use this tool is a special output of the associated DANA Tool. TNMAide uses this data to identify the worst noise hour of the day; and can also calculate LDN and LDEN values. Results in TNMAide are given at the REMEL location assuming a straight roadway segment at least 300 feet on either side of the location.
There are multiple Excel worksheets that will be referred to as tabs in this document.
Download and save TNMAide onto your chosen computer directory. No other installation steps are required.
Good operational practice: Save a copy of the spreadsheet in its original condition before the first use and subsequent uses in case the spreadsheet becomes corrupted during use. This maintains a valid program version.Open the program using Microsoft Excel©. Upon opening the tool, enable macros if prompted to do so by Excel©.
The first tab on the left-hand side of the bottom ribbon is the INTRO tab. If the program does not begin on this tab, click the INTRO tab to show it and review the information.
Once you have reviewed the information on the INTRO tab, click the CONTINUE button to proceed. This will automatically take you to the Required INPUT tab.
Note: Upon entering the Required INPUT tab, there may already be data present in the input cells. This is because the data are not erased automatically from one session to the next, so that the user may return at any time to work with the existing dataset.

The OUTPUT tab provides a summary of the initial results. No input is required for this tab. Results may be copied and used elsewhere. Figure 2 shows the information and options available on this tab.
The time and date of the worst noise hour, and results for LDN and LDEN are all shown for the given year of data. Note that while the time and date are valid for L10, the value provided is only for LEQ. The sound levels that are predicted and shown are for the Reference Energy Mean Emission Level (REMEL) position.2 The current AADT and current vehicle mix by percent are also shown.
The option is also provided to predict values of LDN or LDEN for other years or circumstances by using the YES or NO buttons. Selecting YES will take the user to the Ldn INPUT tab.
The worst hour determination should always be verified by the user. To facilitate user verification of TNMAide output data, the OUTPUT tab includes a graph of the LAeq(1hr) levels from the day in which TNMAide selected the worst hour. Figure 2 demonstrates the typical plot in which all 24 hours are populated, and clear, gradual trends are evident among the LAeq(1hr) variation throughout the day. However, depending on the input data, all 24 LAeq(1hr) levels may not always appear in the output plot. In such cases, user discretion is advised to determine whether the TNMAide output data are valid. Figure 3 illustrates an example in which a few LAeq(1hr) levels are missing from the output plot, but the output data overall can still be considered valid because the missing data do not interfere with the worst hour determination. The missing data points in Figure 3 occur during off-peak hours of 3 am and 11 pm that are not expected to represent the worst hour, as evidenced by the relative valleys illustrated by the LAeq(1hr) trends around the missing data points. Figure 4 illustrates an example in which only a few LAeq(1hr) values are shown in the plot, and therefore the worst hour determination cannot be considered valid. There are not enough output data in Figure 4 to observe reliable trends in the LAeq(1hr) variation throughout the day in order to determine a reliable worst hour.


Updating the Worst Noise Hour and Computing New 24-hour (LDN or LDEN) and 1-hour LEQ Values for the Future Year
When entering the LDN Input tab, after entering data in the Required INPUT tab, the current LDN and LDEN are displayed in the top left corner. Do not change the values in these cells. They are provided for informational purposes. An example of this tab is shown in Figure 5.

At the bottom of the Ldn INPUT tab, the user has an option button to also review information about predicting LDN or LDEN at locations other than the REMEL position. Clicking the Learn About Predicting at Other Positions button will take the user to the Other POSITIONS tab to obtain adjustment factors for converting LEQ in TNM to LDN or LDEN.
If you have chosen to change the vehicle percentages and clicked on the CONTINUE FOR DIFFERENT TRUCK % button you are automatically taken to the new input tab (Ldn Lden Future Input). If you did this in error, you will note that all input lines are shown as "Not Selected" (see Figure 6). Return to the Ldn INPUT tab if this is an error.

If a new percentage of vehicles was selected, the tab will reflect whether LDN or LDEN was selected and have input cells (shaded blue) as shown in Figure 7 and Figure 8. The tab will ask for the following inputs:
If a new percentage of vehicles was selected, the tab will reflect whether LDN or LDEN was selected and have input cells (shaded blue) as shown in Figure 7 and Figure 8. The tab will ask for the following inputs:
If LDN was selected in the Ldn INPUT tab, then the distributions should be entered for two time periods (daytime and nighttime) and nothing should be entered in cells K5, K11, and K17 as shown in Figure 7. If LDEN was selected in the Ldn INPUT tab, then the distribution should be entered for three time periods (daytime, evening and nighttime) as shown in Figure 8.
Note that previous data are not cleared in this tab either so the user may return to an on-going process. Simply erase or type over these values. Note also that in Figure 7 the older percentages do not add up to 100%. Check your percentages before clicking the Continue button.
Also shown are the definitions of vehicles, LDN, and LDEN. Finally, new traffic percentages may change the time of day that the worst hour occurs as well as the value of the sound level. This is reported in the bottom right of the screen. Click the Continue button after input of vehicle percentages to see all results.


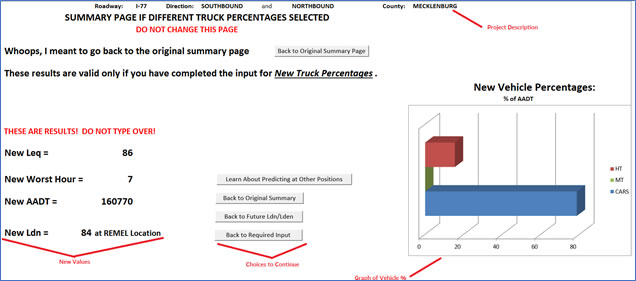
If you have included new vehicle percentages, this summary tab provides that information including the new values of worst hour LEQ, new worst hour, new AADT, new LDN or LDEN as selected, and a graph of the new vehicle percentages. These are also shown in Figure 9 below.
After reviewing the information, you may click one of the available buttons (Learn About Predicting at Other Positions, Back to Original Summary, Back to New Ldn/Lden Input", and Back to Required Input) or the tabs at the bottom to return to other tabs and process more information.
All but Learn About Predicting at Other Positions allow reevaluating or changing inputs for different cases. The Learn About Predicting at Other Positions button leads to the Other POSITIONS tab.
Multiple tabs include the Learn About Predicting at Other Positions button. When selected, the user is taken to the Other POSITIONS tab. No input is required or should be included on this tab. The adjustments for use in TNM are described and have been calculated for your use in predicting LDN or LDEN at positions other than the REMEL position.
This program (TNMAide) is based on the levels at the REMEL location which is located 15 meters from the centerline of the near lane and 1.5 meters above the roadway. TNM allows for multiple variables such as distance, shielding, and ground effects, which is not practical in a spreadsheet. This tab has information on the REMEL and how the value relates to all other positions. The discussion in the Appendix — Technical Manual describes the technical basis of this method.
he method to calculate at other positions allows the user to correct the output of TNM for LDN or LDEN at all positions modeled in the TNM run via the use of an adjustment factor. The procedure is:
Noise standards promulgated by the Federal Highway Administration (23 CFR 772) are based on a one-hour equivalent noise level [LEQ(1h)] or a statistical level [L10(1h)] during the worst noise hour of the day. Traffic noise is a function of many variables with speed, volume, vehicle type, median width, number of lanes, and grade considered in this application.
Past efforts to determine the appropriate conditions to model the worst hour of the day have generally fallen into three categories: use of 24 hour measured sound levels if available; use of peak hour traffic at posted speed limits; or use of a time when a specific level-of-service (LOS) occurred. Measurement data for 24 hours is not often available. The second scenario may not exist and represents a theoretical worst-case approximation. The use of the LOS method is more realistic, but there is no assurance the correct hour of the day will be selected as described in a recent research project on best practices3.
FHWA formally published the LOS method as far back as 1977 when Appendix E for the document describing the FHWA Highway Traffic Noise Prediction Model4 showed that LOS C (as defined at that time) represented the worst hour of the day in terms of noise generated by the highway. The definition of LOS has changed over time and in some cases LOS D or even E may be the worst hour depending on the facility type, vehicle mix and other traffic trends.
Note that the worst average hour computed in TNM 3.0 using AADT may be different than that identified by TNMAide using the worst single hour of the year. Both methods of identifying the worst hour have their respective merits. However, the analyst must be cautious not to combine the two methods. For example, if the worst hour is identified using TNMAide, but the AADT traffic are used in TNM to compute the level, then the result will be an under-prediction of the worst hour. Although TNM and TNMAide produce different results, both are internally consistent with their respective input assumptions.5
Speed is a very important variable in determining the worst noise hour. Depending on the traffic conditions and facility parameters, speeds could vary from very low to Interstate highway speeds. Such variability may represent a 30 dB(A) swing as computed by the equations for noise levels for automobiles per Reference Energy Mean Emission Levels (REMEL). Noise from other vehicles varies less with speed; for example, heavy trucks typically change by 15 dB(A). As such, speed is an input for the calculations in this tool and described later in this section.
Traffic volume is also important. The highest speed with the most volume is usually the time of day needed for worst-hour but this generality assumes a constant ratio of car and truck volumes. Not only vehicle volume, but vehicle mix also has a significant effect on wayside levels. As such, both volume and mix are included in this tool.
Other important variables that can influence the worst noise hours' time-of-occurrence and noise level, are the number of lanes, the median width, and roadway grade. Grade may increase noise emissions from heavy trucks and could change the worst hour of the day. 6
This report describes an accurate way to determine the loudest hour of the day. TNMAide uses speed, volume, and vehicle mix data from the NPMRDS, HPMS, and TMAS databases; and roadway grade, numbers of lanes, and median width from user input. It provides sound levels at the REMEL location assuming a straight roadway segment at least 300 feet on either side of that location.
The NPMRDS/HPMS/TMAS databases have the real-world information needed to determine the REMELs by hour. The research team used standard statistical analysis techniques to build test databases and a methodology to retrieve the information. Based on this data, TNMAide computes hourly time-energy levels at the REMEL position7 based on the vehicle mix and speed, adjusts for the distance to the far lanes, and accounts for grades.
The number of lanes and median width are used to adjust the sound levels from the far lanes for geometric spreading in a simplified fashion by using 12-foot lanes and the center of the lane groupings as the propagation point-of-origin. TNMAide accounts for roadway grade by adjusting heavy truck REMELs based on the user-inputted grade.
It is important to note that the traffic Noise Model (TNM) can predict at many positions at any given location and allow for changes in the levels due to distance, shielding, and ground effects. The overall adjustment process as included in the TNM Technical manual8 is shown in the following Equation:
LAeq1h = ELi +Atraff(i) +Ad +As [1]
Where: ELi = the vehicle noise emission level for the ith vehicle type
Atraff(i) = the adjustment for vehicle volume and speed for the ith vehicle typei
Ad = the adjustment for distance between the roadway and receiver and for the length of the roadway, and
As = the adjustment for all shielding and ground effects between the roadway and the receiver.
As can be seen from Equation 1, computing the 1-hour LEQ level at a given location in TNM requires computation of all four parameters in the Equation, including two that are dependent on the receiver location geometry and characteristics. To simplify the complex propagation routines in TNM, TNMAide focuses on the first two terms in Equation 1 since noise levels at the REMEL position are dominated by these terms in cases where there is no shielding between the receptor and the roadway.
As noted, both speed and volume are included in TNMAide as part of the adjustment for traffic flow. The distance to the far lanes is included by simple geometric spreading of a line source. Grade emission adjustments are incorporated in the tool in the same fashion as in TNM.
The process begins by the user copying the specially formatted DANA Tool output data into a tab (worksheet) labeled Required INPUT. The required input includes all 24 hours for each day of the year (17,520 rows of data to be copied in for a normal year and 17,568 rows in a leap year). The tool automatically adjusts for Leap years. Seasonal considerations are not included (e.g., open window conditions). The user must then input three other key pieces of data - the number of lanes in both directions, median width, and grade measured in the direction of travel for the near lanes.
From the moment of the copy, computations begin and the worst hour of the day, LDN and LDEN are determined and reported to the user.
This is done by computing for the first two terms in the Equation above for all five vehicle types (cars, medium trucks, heavy trucks, buses, and motorcycles). Since only cars and truck speeds are available in the collected data base, the speeds for cars are applied to medium trucks and the speeds for trucks are applied to buses. Motorcycles use the average speed.
The computation for the first term of Equation 1 is shown in Equation 2.
 [2]
[2]
Where: EA = the maximum noise emission energy for a vehicle pass-by A-weighted sound level by vehicle type
si = speed in kilometers per hour by vehicle type (constant speed assumed)
A, B, C = Constants by vehicle type for A-weighted sound-level emissions (TNMAide does not account for pavement type or throttle, unlike TNM)
Next the LAeq(1hr) is computed by computing the traffic flow adjustment (second term in Equation 1) for each vehicle type as shown in Equation 3, adjusting the REMELS for traffic flow, and computing the final overall level based on energy addition.
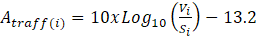 [3]
[3]
Where: Atraff(i) = Adjustment for traffic flowi
Vi = vehicles per hour, and
Si = vehicle speed in kilometers/hour.
The vehicle volumes and speed have been incorporated into the calculation process allowing for the changes by hour in the database. As previously noted, a correction for distance to the far lanes is determined by a simple geometric spreading approximation as shown in Equation 4:
 [4]
[4]
Where: DL = change in level due to distance correction, dB(A) and
r1, r2 = distance to far lane centerline and near lane centerline, respectively (ft).
In this case, distances are determined by the user input of the number of lanes and median width.
All vehicle values are then logarithmically summed to determine an overall value for the entire traffic flow.
Grade must also be considered since in TNM modeling, heavy truck REMELs are increased. TNMAide checks the user input for grade and if it exceeds +1.5% in either direction, an adjustment is made for that direction. The adjustment is to use full-throttle acceleration rather than the normal REMEL. For grades of greater than +1.5%, the value of the C constant shown in Equation 2 is increased from 74.298136 to 80.
Once each hour of the day for the entire year has been calculated for the REMEL and adjusted for traffic flow, the maximum value for the worst hour of the year is determined through comparison of all values and the worst noise hour and day returned to the user in the OUTPUT tab. All vehicle volumes and speeds are also retrieved through Lookup and Index functions for this hour to be used in later calculations.
As mentioned in the User Guide, TNMAide also computes LDN and LDEN.
Using the NPMRDS speed data, HPMS volume data, and TMAS classification count data, the sound energy for the time period distributions over a 24-hour period are calculated for the Day-Night Level (LDN) or the Day-Evening-Night Level which is also referred to as the Community Noise Equivalent Level (LDEN).
The calculation of LDN and LDEN are based on the equations shown in Equations 5 and 6.
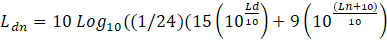 [5]
[5]
Where: Ldn = day-night sound level (dB(A))i
Ld = daytime equivalent sound level (dB(A)): 7 A.M. to 10 P.M., and
Ln = nighttime equivalent sound level (dB(A)): 10 P.M. to 7 A.M.
 [6]
[6]
Where: Lden = day-evening-night sound level (dB(A))
Ld = daytime equivalent sound level (dB(A)): 7 A.M. to 7 P.M.,
Le = evening equivalent sound level (dB(A)): 7 P.M. to 10 P.M., and
Ln = nighttime equivalent sound level (dB(A)): 10 P.M. to 7 A.M.
Using the results from the methodology as described for the worst hour of the day calculations, sound energy levels were grouped into daily categories, appropriate penalties added, and averaged over the 24-hour period to compute the energy LDN and LDEN at the REMEL position. After a conversion back to dB, future values are reported in the OUTPUT tab.
Two additional concerns had to be addressed. First the user may wish to know the predicted levels for future cases. Second, the values will change for different positions other than the REMEL position. Additionally, since the user could select either LDN or LDEN, a series of IF statements, index statements, as well as look up statements had to be included to not only calculate the correct parameter but to change the output reporting tab for the appropriate result reporting.
In order to calculate future cases, additional information is required from the user. The first choice presented to the user on a second input tab is whether LDN or LDEN is the desired output. The user selects the appropriate metric by clicking on a box in the LDN INPUT tab.
When the user selects LDN or LDEN, the input tab page changes based on imbedded IF statements and cell comparisons.
Next, the new Average Annual Daily Traffic (AADT) for the future year must be input by the user. Calculations will be based on this new daily traffic volume.
There may be situations where the future traffic data or traffic for another option may be lacking. As such, the user is given the option to either keep the same vehicle percentages or change to new values. The initial question only deals with truck percentages. If the user specifies by inserting a "1" in the box that truck percentages will remain the same as the existing case, then the LDN or LDEN is immediately calculated and displayed based on the new traffic volume. Since vehicle percentages did not change, the program uses the same energy percentages as in the existing year but scales the LDN/LDEN to the new value by using the method shown in Equation 7.
 [7]
[7]
Where: ΔL = change in level (dB),
AADTnew = Expected future AADT, and
AADTexisitng = Existing AADT
If traffic volumes are expected to change in the future, the user would enter a "2" in the input box and the user is prompted for additional input in the form of overall percentages of Cars, Medium Trucks and Heavy Trucks. Buses and Motorcycles represent only a small fraction of the total traffic energy, are more difficult to obtain, and for simplicity not used. These percentages should add up to 100 percent. Depending on the metric selected (LDN or LDEN) the percentages for the various time periods of the day are requested: Day and Night for LDN; or Day, Evening, and Night for LDEN.
Once this information is input the user selects the Continue button. The Continue button automatically takes the user to a summary tab, named Other LOCATIONS.
On this summary tab, the new worst hour is displayed along with the LEQ(1h), the future AADT and either LDN or LDEN depending on the selection by the user. In addition, as more of a check for the user, a graph showing the new selected car and truck percentages. The worst hour of the day is recomputed using the same methodology as before except that volumes of cars, medium and heavy trucks are adjusted to the new percentages and used in the calculations. This may, or may not, result in a new worst noise hour. The worst hour along with the corresponding LEQ(1h) is reported.
The user may wish to compute LDN or LDEN for specific receiver positions and not just the REMEL location. Since computation is complex and not easily incorporated into a spreadsheet, a methodology is outlined for the user:
This methodology is based on use of an adjustment factor in TNM. The adjustment factor is computed based on specific vehicle input into TNM that has been computed is displayed (volume and speed of cars, medium trucks, and heavy trucks). Figure 10 Example Other POSITIONS Tab repeats this tab page for clarity. Once values for specific locations have been determined, the user applies the specific adjustment factor to the LEQ value from TNM. The resultant value is LDN or LDEN as selected. The simple adjustment factor was determined by comparing LEQ to LDN/LDEN and the presenting the difference.

The user has now computed the worst hour of the day and the corresponding LDN/LDEN requested for the existing and future years at the REMEL location and has the information to evaluate LDN or LDEN at other positions. The user may automatically return to the Required INPUT to begin new calculations or simply quit the spreadsheet.
1 At least one hour of coincident traffic data must be input for both roadway directions in order to compute a result. Even a full year of traffic data for a single lane with no data for the opposite direction will not result in a loudest hour computation.
2 This is 50 feet from the center of the near lane and used in TNM as the reference position to begin modeling.
3 Recommended Best Practices for the Use of the FHWA Traffic Noise Model (TNM), 2015
4 FHWA Highway Traffic Noise Prediction Model, 1978
5 For validation of TNM and TNMAide results, contact TNMHelp@dot.gov.
6 Roadway grade changes from 0-2% will likely impact the worst hour noise level computation, but roadway grade changes greater than 2% may not (particularly with a low proportion of heavy trucks within the vehicle fleet mix) due to the implementation of the full throttle REMEL curves for heavy trucks at 2% grade.
7 The REMEL position is 15 meters from the centerline of the near traffic lane and 1.5 meters above the pavement surface.
8 FHWA Traffic Noise Model, Version 1: Technical Manual, 1998

