U.S. Department of Transportation
Federal Highway Administration
1200 New Jersey Avenue, SE
Washington, DC 20590
202-366-4000
Freight Economy
Date: March 23, 2016
Our Host: Alameda County Transportation Commission (ACTC)
| HIGHWAYS | I-5, I-80, I-238, I-580, I-680, I-880, US-101, SR-4, SR-12, SR-29, SR-37 and SR-152 | |
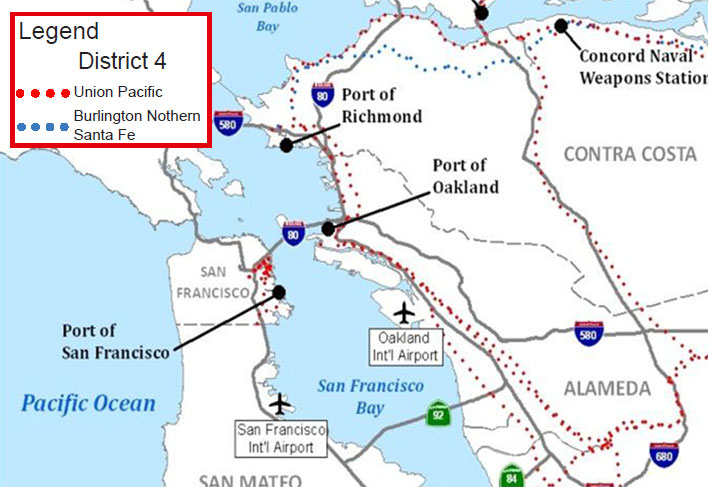
| RAILROADS | Union Pacific. BNSF, Oakland Terminal Railway, California Northern, Northwestern Pacific Railroad Company, Richmond Pacific, and San Francisco Bay Railroad | |
| AIRPORTS | Oakland International, San Francisco International, and San Jose International | |
| WATERBORNE | Ports – Oakland, San Francisco, Richmond, Redwood City and Benicia. Marine Corridors – I-5 and I-580 |
Source: Caltrans, MTC
| Commodity | Value (millions $) | % of total |
|---|---|---|
| Electronics | 421,066 | 31% |
| Precision instruments | 129,961 | 10% |
| Mixed freight | 91,748 | 7% |
| Motorized vehicles | 68,695 | 5% |
| Machinery | 65,256 | 5% |
| All commodities | 1,354,927 | 100% |
| Commodity | Tons (thousands) | % of total |
|---|---|---|
| Other foodstuffs | 55,745 | 11% |
| Gravel | 43,506 | 9% |
| Crude petroleum | 43,416 | 9% |
| Nonmetal min. prods. | 36,745 | 8% |
| Gasoline | 25,330 | 5% |
| All commodities | 485,996 | 100% |
| Trade partner | Tonnage | % of total |
|---|---|---|
| California | 55,100 | 39% |
| Rest of Americas | 11,607 | 8% |
| Eastern Asia | 11,434 | 8% |
| Mexico | 9,951 | 7% |
| Canada | 7,493 | 5% |
| Total outbound | 140,611 | 100% |
| Trade partner | Tonnage | % of total |
|---|---|---|
| California | 42,836 | 25% |
| Alaska | 26,017 | 15% |
| SW & Central Asia | 16,349 | 9% |
| Eastern Asia | 16,083 | 9% |
| Mexico | 11,580 | 7% |
| Total inbound | 174,296 | 100% |
Based on FAF4.1 data with base year 2012 and forecasts up to 2045

The Bay Area region’s freight activity is mostly domestic (75% by value and 85% by tonnage) but international freight is projected to quadruple in value by 2045.
The Bay Area accounted for the 8th highest amount of freight activity among U.S. metropolitan markets, as measured by value (2012).
The Bay Area’s major trade partner is now the rest of California. By 2045, international trade, especially with East Asia, is expected to increase.
The Bay Area will see multimodal freight activity grow by over 50 percent between 2012 and 2045.
A significant share of the regional economy is goods movement-dependent industries, which represent nearly one-third of all jobs in the region. (Goods movement industries include those that produce goods for sale or for which transportation access to markets is a critical aspect of their business operations.)
An ongoing Oakland Army Base Redevelopment/Port of Oakland redevelopment project aims to improve port access and encourage rail expansion. The project will increase warehouse and logistics space, some of which will support transloading, which has been a growing component of modern logistics strategies.
The most significant freight bottlenecks in the Bay Area are along I-680 in the South Bay and Highway 101 in the North Bay. Key segments of I-880 and I-580 that connect the Port of Oakland to the San Joaquin Valley carry between 15,000 and 37,000 trucks per day on average.
Class I rail carriers UP and BNSF operate in the Bay Area. Port growth strategies will impact Capitol Corridor and the ACE (Altamont Corridor Express) lines.
Maritime ports are key in the Bay Area’s freight activity. Port of Oakland is largest but Richmond, Benicia, San Francisco, and Redwood City ports are also critical.
Bay area industries are quite diverse, including expanding sectors such as clean energy, biotechnology, and manufacturing. Each sector has unique freight needs.
Sources for Freight Facts: FAF, BLS, ATRI, Caltrans and MTC
To view PDF files, you can use the Adobe® Reader®.

