

Aggregate Imaging System (AIMS) Phase I Progress Report
Background
Federal Highway Grant DTFH61-08-G-00003 was issued to design, develop and fabricate an instrument to analyze aggregate properties using digital imaging technology. The instrument being developed is based on a prototype instrument that was built for use in research applications.
Original Equipment
The Aggregate Image Measurement System commonly referred to as AIMS, uses a variable magnification microscope-camera system and two different lighting modes to capture aggregate images for analysis. The first lighting scheme creates a backlit image which provides a particle silhouette. This image is converted to a binary tiff file analyzed for the shape characteristics of angularity and cross-sectional form. The second lighting scheme utilized is top lighting which illuminates each particle with spot lights at oblique angles above the particle to provide a gray scale image of the particle surface for a micro-texture characterization. The three dimensional form of each particle is also quantified while the texture image is captured.
The research system was designed for investigating the possibility of using image analysis to characterize aggregate shape properties and to investigate the relationship of those characterizations to pavement and aggregate performance. It was not designed with manufacturability as a primary objective. The equipment proved to be costly and, in some cases, hardware failures were common.
The research system utilized a large panel backlight and a microscope ring light for these different illuminations. The illumination hardware on the research system was costly and had a number of failures associated with the components. The various interconnections between the components often resulted in communication errors between system components. These errors were often difficult to identify. This system also provided no enclosure which enabled errors from ambient laboratory lighting to be prevalent.
It was desired to update the system components to less expensive and more robust hardware, to provide an enclosure to eliminate the ambient light concerns, and to improve the operator interface so that operation of the equipment was simplified.
While the instrument is commonly referred to as the AIMS, the heart of the instrument is the copyrighted AIMS software. This software consists of a series of analysis algorithms that objectively quantify aggregate shape properties on both the macro scale (Shape, Angularity, 3-D Form, Flat and Elongated Ratio) as well as properties on a micro scale such as surface texture and fine aggregate angularity. Both coarse and fine aggregates are characterized with the AIMS software algorithms.
Aggregate consensus properties are well known to be important in influencing the structural performance of Hot Mix Asphalt ( HMA ), hydraulic cement concrete and unbound aggregate pavement layers. Also, aggregate characteristics are important properties that influence the microstructure and skid resistance of pavement surfaces.
As such, accurate characterization of these properties will contribute to the enhancement of pavement performance and driver safety.
The current methods for measuring these characteristics have proven to be difficult, time consuming, and subjective. The Aggregate Image Measurement System, measures aggregate properties using objective standards.
Measuring the shape properties of aggregates using an objective system will yield significant and immediate benefits to the transportation industry. These benefits will be realized by incorporating improved aggregate shape property characterization into the design of pavement structures. In asphalt pavements, aggregate properties control their interaction with the asphalt binder, and consequently influence the HMA design. The system will also offer an automated method of qualifying aggregate shape properties to meet specifications and ensure consistent performance.
In addition to improving structural performance, the system has the potential for increasing public safety by providing a means for qualifying aggregate surface texture which is related to pavement friction properties such as skid resistance. Consequently, the device will contribute to the creation of safer, higher-quality, and longer-lasting pavements. Large savings due to reduced requirements for maintenance and rehabilitation can be realized.
As the development of warm mix technology continues in pavement applications due to its reduced environmental impact, aggregate properties will continue to be an important pavement design parameter. Aggregate texture is an important property to ensure strong and durable asphalt-aggregate adhesive bond in warm mixtures.
The Aggregate Image Measurement System has been integrated in an experimental procedure to measure aggregate resistance to abrasion (loss of angularity) and resistance to breakage. These are important contributions to ensure that aggregates can resist degradation that may occur during construction resulting in a pavement structure not meeting design criteria.
It is believed that the lack of accurate characterization of aggregates has led to the development of specifications that either overemphasize the need for superior aggregate characteristics, or, on the contrast, allow for the use of marginal shape properties. The delivery of as an industry tool will contribute to the development of reasonable specifications based on objective measurements of aggregates. These specifications will allow highway engineers to accurately select locally available materials that can be used in pavement construction. The use of local materials is highly favorable given the rapid increase in cost associated with transporting aggregates.
Commercial Viability
The construction industry has undergone a dramatic change over the past decade. The industry is no longer viewed as an industry that is set in its ways and reluctant to adopt change. The success of technology oriented programs like Superpave has caused the industry to be more receptive to innovative technology. The industry has been quick to move into newer technologies such as Stone Matrix Asphalt (SMA) and Warm Mix Asphalt (WMA)
Stone Matrix Asphalt and Warm Mix Asphalt are technologies that were developed in Europe . SMA is a stable rut resistant mixture that relies on stone on stone contact to provide strength and durability. Proper aggregate selection is necessary to produce a quality SMA mixture. Warm Mix Asphalt allows the producers of the asphalt pavement to lower the material temperatures 50 to 100 degrees Fahrenheit. A decrease in both greenhouse gases and in that distinctive aroma can be attributed to the lower temperature, a factor that will help nonattainment cities meet air quality standards. The lower temperature and reduced odor also create a more comfortable environment for the workers. Proper aggregate classification is essential when using warm mix asphalt.
The construction industry has changed and has brought on board more and more technically trained personnel. In short objective science has replaced subjective opinions. As more and more projects become warranty projects, the contractor is looking for a technological edge. In order to succeed in the new world of construction, contractors need to rely on science and technology.
As a result, there has been a lot of interest in the instrument. We have received interest from State Departments of Transportation in the United States and Canada . We have also quoted the units to Brazil , China and Italy . Domestically we have also quoted the units to aggregate producers. The number of participants (32) in the Inter Laboratory study is an indication of the interest in the device unit.
Pine has identified several target markets for this new and innovative technology. In the earliest phase of the product life cycle the target markets will be government agencies and academic institutions. As the product moves up the life cycle curve, early adopters from the aggregate and construction industries will be the next target market. As the product becomes more accepted, aggregate suppliers will look to acquire the device for their quarries. In addition, contractors will purchase the instrument to verify the properties of the aggregates they are using.
Pine plans on positioning the product on the premise that the device allows the consumer to measure multiple properties with the same tool. The flexibility of the device is its main selling point.
Availability
Pine Instrument Company has already received pricing and availability requests on the new system from the participants in the Inter Laboratory Study. The Inter Laboratory Units will be available for sale once the Inter Laboratory Study is complete. Production of additional units has already begun and will be adjusted to meet demands.
The Work Plan
The work plan for Phase I included Project Management, Mechanical Design, Electrical Design, Software Design, Equipment Fabrication and Ruggedness Testing.
Project Management
This consists of managing all facets of the project including mechanical design, electrical design, software design, procurement and the ruggedness testing.
Mechanical Design
The Mechanical Design phase of the work plan began by developing an overview of the mechanical hardware concept. Once the concept was finalized the next step was to select the mechanical components to be utilized in the project.
The component selection process included identifying the items necessary to provide movement to the microscope mount. In addition the camera, the optical system, and support system were also identified. Once the components were identified, testing determined that the camera, the microscope and image acquisition hardware were suitable for the application.
New Equipment Design
The system hardware developed under Phase I represents an improvement over the research equipment. The redesign addressed the issues with illumination; tackled manufacturability issues associated with the research system, streamlined the operator interaction with the system as well as represents an expected improvement in reliability as proven technology is utilized in an integrated system.
Camera technology has progressed significantly since the research system was developed and an updated camera was selected to take advantage of these improvements. Camera image sensor technology has increased available resolutions while decreasing costs. This provided opportunity to eliminate one of the two magnification lenses used on the research unit while maintaining, and actually improving in some cases, the raw image resolution. The second objective lens of the original equipment also had created a need for multiple microscope positions, which had to be manually changed between different characterizations. Elimination of this lens simplified the design and operation of the equipment.
Robust LED technology was selected for the lighting requirements and a stepper-motor-gear-head combination, powering a rotating turntable provides a sturdy platform for material sample presentation and eliminates the multiple cross slides of the research x-y-z gantry system. The new turntable design utilizes a specific tray for each aggregate size which assists the operator placing the material sample for analysis. The research system required the operator to place each coarse particle onto table position accurately at specific grid points. The new system requires the operator to simply provide separation of particles placed in a channel on each tray. The system checks for particles that are touching and omits those in the analysis. Fine particle are simply dispersed thinly and the analysis is automated from there. The removable trays also permit easy clean up.
The removable tray design helps address another issue with the research equipment associated with fine materials. Fine particles of light colored materials occasionally proved to be too translucent to provide adequate contrast and were often not captured with the original system backlighting. The new system allows for trays of different colors to help provide adequate contrast between the material particles and the background. The new system is supplied with a black opaque tray and a selectable feature which permits the material sample to be top lighted for contrast in lieu of backlighting. This configuration, in addition to the higher resolution camera permits particles down to #200 retained sieve size to be characterized while the research system was capable to #100 retained with many light colored aggregate presenting problems at that size.
The dispersal of the fine material samples over the field of view in a manner that produced no touching particles was difficult. Analyzing touching particles as though they were one can influence the Form2D and Angularity output values generating erroneous data. The research system had an experimental Touching Particle Factor (TPF) algorithm to detect fine particles that touched. The TPF worked reasonably well but was based on particle area and was thus sensitive to actual particle size; even within a single Superpave sieve size.
An algorithm was developed during the development of the new system that is not sensitive to particle size. This new method of detecting and removing touching particle from the analysis uses a geometry evaluation based on a shape called the convex hull perimeter. The convex hull perimeter is a track circumscribing the perimeter of the particle outline without any concave features. Areas around the perimeter which have a concave shape, like the valleys typically created when particles touch, are bridged. This convex hull perimeter is compared to the length of the actual image perimeter including valleys as a ratio called the Convex Hull Perimeter Ratio (CHPR). The CHPR value of 1.07 was determined to be effective at removing touching particles while still including angular particles in the data. This method is independent of particle size.
Equipment Fabrication
Two prototypes of the newly designed hardware were fabricated. These first builds were evaluated to confirm the system performance requirements were met with this new hardware. It was confirmed that the new hardware either met or exceeded the design parameters established with the research system. Since the original Research System was difficult to manufacture because it had so many moving parts. Ease of assembly was not a consideration when the Research System was designed. During Phase I, system manufacturability was a consideration throughout the development stages of the project. The new design is easy to assemble and is designed with our manufacturing processes. The fabrication of the two prototypes served as a means to confirm the manufacturability of the system. One of these prototypes was kept at Pine to continue design development while the second unit was to be used for performance testing. Additional units were fabricated after the design was validated with the prototypes.
New Equipment Testing
Two stages of testing were conducted on the new system hardware. The first stage of testing was designed to ensure the new hardware provided the same results as the research system hardware. This testing compared the results of the new system to the research system on materials that had been well characterized during research with the original equipment. The materials were scanned with the new hardware and the results compared to the research system results (see Appendix A: Figures 3-5). The data demonstrate that the new system hardware provides the similar characterization as the research equipment. By confirming the characterizations are comparable, the research relating material shape characterizations to performance performed with the original equipment can be considered applicable to the shape characterizations provided by the new equipment.
The second stage of the testing was designed to confirm that the testing methodology was rugged. The term rugged in this usage means that small, anticipated, variations in the operational parameters that occur within the equipment, laboratory environment, and system operation do not significantly impact the results. This testing utilized ASTM 1067 "Standard Practice for Conducting a Ruggedness or Screening Program for Test Methods for Construction Materials". Appendix A describes the Ruggedness Experiment and its findings.
Texas A&M was selected as the research laboratory to perform these tests on the new equipment because of their extensive expertise with the research system. Texas A&M also had an extensive database with a variety of well characterized materials to use as comparison samples. Samples of these well characterized materials were selected and scanned with the new system to compare the new results to the research equipment results.
Material sampling and preparation procedures are well established in the aggregate industry and these guidelines had been used for sample preparation for the research system. There was no need to evaluate material sampling procedures and the appropriate existing procedures were followed for this testing.
Appendix A provides a detailed report of the testing completed during Phase I at Texas A&M University . The following discussion summarizes the activities. The first series of testing represented a calibration run of the new system. New outputs were compared directly to the research system outputs. The second series of tests evaluated the ruggedness of the system.
Attachment I shows 2 photos of the Aggregate Image Measurement System. The first photo shows the complete system. The second photo shows the interior of the system.
Calibration Testing
The calibration runs comparing the research system to the new system demonstrated that most of the outputs of the new system match the research edition quite well. Angularity and form information from the new system aligned very closely with the old system output. This was expected as the image analysis algorithms were not changed, only the image acquisition hardware was updated.
However, the texture output was found to be of a different magnitude on the new system than on the old system. This difference in texture was not unexpected as the updated equipment provided increased capabilities. The new system continued to rank the various materials in a similar manner as the old with respect to each other. The output was simply of a different scale. Because of research completed with the original equipment in studying texture and its relationship to in-place performance, it was desirable to maintain the texture scale of the research system. It was decided that the best solution to address this shift in scale was to apply a shift factor (e.g.: multiplier) to the new system data.
This shift of the new system with respect to the old system is likely the result of three converging design changes, enhanced illumination, improved camera performance, and the enclosed chamber for image acquisition. The new top light design provides oblique angle spot lighting which provide excellent contrast to the particle surface. The camera provides improved texture image acquisition control by providing a more precise control of the image intensity, and the enclosure provides a controlled lighting environment for image acquisition. It is believed that the new system represents an improvement in the performance, while maintaining excellent correlation to previous results that have been linked to pavement materials performance.
Ruggedness Testing
Once it was established that the new system provided comparable results, the testing moved onto the second phase which was to evaluate the ruggedness of the testing procedures.
Ruggedness, in this meaning, is not the ability of the equipment to stand up to abuse, but the ability of the testing methodology to handle small variations in the parameters used for capturing the data. Factors and limits were selected for the initial ruggedness study which followed the guidelines of ASTM C1067 "Standard Practice for Conducting a Ruggedness or Screening Program for Test Methods for Construction Materials". The new system is computer controlled with little operator input required to characterize material samples. As such, the ruggedness factors selected focused on gaining an understanding of the level of control required during system operation and system calibration to provide a rugged testing process. Special accommodation was made in the test software to permit imputing variability into the system to simulate the acquisition parameter variation. This special code to vary these acquisition parameters is not available for normal operation and was strictly in-place for the ruggedness testing.
Fine aggregate characterization requires slightly different operation parameters than coarse aggregate characterization requires, therefore separate tests and factors were selected for each. Factors for parameters common to both characterization types were kept the same.
| Fine Aggregate Factors | Coarse Aggregate Factors |
|---|---|
| A: Tray color | A: Tray size |
| B: Illumination intensity | B: Illumination intensity |
| C: Doors (open vs. closed) | C: Door (open vs. closed) |
| D: Touching Particle Filter | D: Focus limit |
| E: Magnification | E: Magnification |
| F: Number of Particles | F: Tray Height |
| G: Ambient light | G: Ambient Light |
Ruggedness testing was performed using several different material sources. Separate tests were run using dark colored coarse aggregates, light-colored coarse aggregates, dark colored fine aggregates, and light colored fine aggregates. Two sizes of fine samples were selected (#30 and #16). Each test of 16 separate characterizations was statistically analyzed for significance according to the ASTM C1067 procedure. For the fine aggregates, 2 outputs Angularity and Form2D were evaluated. For coarse aggregates, Angularity, Texture, Sphericity, and F&E were included in the analysis for factor significance.
Ruggedness Findings
The initial tests identified several significant factors. The factors include ambient lighting, light levels and magnification. A design change for the enclosure doors was indicated. The original doors were tinted but translucent. The testing indicated a requirement for non-translucent doors. The other factors were identified in this first round pointing to the need for tight control on some of the parameter settings. It was determined that many settings require fixed values rather than user adjustable values. This effectively reduced the options provided to a user, simplifying the operation of the system. The control of these parameters was already in place; this test simply demonstrated a need to limit the level of variability.
It was hypothesized that some of the factors may have had some cross-influence on the outputs in this first series, so it was repeated with tightened limits on some parameters while retaining the original high-low limits of others. This second round further defined the requirements and confirmed the design change required for the doors. Ambient lighting continued to be a significant factor.
A third series of replicates with the ruggedness factors closely controlled in the manner indicated by the initial series was completed. The limits of the parameters were set in the machine controls and non-translucent doors were simulated by covering the enclosure. This third round of replicates confirmed the design change to non-translucent doors and the system controls put in place for the other parameters (light levels, magnification levels, etc.) were all adequate to address the significance of the factors (i.e.: no significant factors were found). This test was also repeated in Grove City to confirm the results.
The results of this final round of ruggedness testing confirm that the controls put into place for system variables and the physical change to the door material address the significant factors found and thus the system provides a rugged test platform.
Precision Testing
The next step in the development process is to establish the precision of the methodology. No equivalent method is currently used for the AIMS software characterizations provided by this system, therefore no bias information can be determined.
An Inter-Laboratory Study (ILS) utilizing 32 laboratories and 8 systems has been designed. In brief, each ILS system will be sent to 4 labs. The ILS system will include the Aggregate Image Measurement System which consists of an enclosure, a microscope, a computer with monitor and keyboard and 6 sample trays. Also included are 3 material samples of Superpave sieve sizes (#100 to 25mm).A Granite, Gravel, and Limestone materials were selected. Each lab will characterize each material sample twice, on different days, with the same operator, This experimental following ASTM C802 "Standard Practice for Conducting an Inter-laboratory Test Program to Determine the Precision of Test Methods for Construction Materials" will provide both intra-laboratory and inter-laboratory precision information.
Test Methods
A proposed test method procedure has been drafted for characterizing material shape properties with digital imagery. The method outlines material sampling procedures as well as the characterization algorithms. A practice for combining these material shape properties into characterization that may be associated with source and source blends is also provided in draft format. However, the calculations shown in this practice require validation and correlation with actual pavement performance before they are utilized in any design environment. These test method drafts are included as appendix to this report.
Summary
During Phase I of this project it was determined that a newer more robust version of the Aggregate Image Measurement System could be developed. Furthermore the unit could be manufactured at a cost that would meet the price expectations of the target markets.
When the new design was being developed ambient lighting was known to be a factor that could potentially affect testing results. The new design took this into effect by enclosing the testing area to reduce the effects of ambient light. The Ruggedness Study identified that ambient lighting continued to be a factor that affected the performance of the instrument. As a result of this discovery, it was determined that the door design needed to be modified. The modification reduced the effects of ambient lighting and improved the performance of the device.
There is a great deal of interest in the device as evidenced by the number of participants in the upcoming Inter Laboratory Study. Discussions with potential customers of the system have indicated that the target markets are ready for the new and improved device.
Once the ILS is complete, AASHTO standards will need to be developed. The establishment of AASHTO standard will be necessary to take this product to the next level.
Two proposed test methods for the procedures for testing materials with digital imagery were drafted. These proposed methods have been submitted to the AASHTO Materials group chairmen for review by AASHTO materials committee members. The ILS experiment is designed to provide the needed information to complete these proposed specifications, allowing them to move forward should the AASHTO Materials group believe them to be appropriate. Actual acceptance of the proposed methodology as an AASHTO Specification is entirely in the control of AASHTO, industry has no direct role in this process. The first step AASHTO typically employs is the adoption of what is called a Temporary Provisional specification. This TP specification does not have the same stringent requirements a formal AASHTO Test Method or Practice. A TP is also able to be adjusted and modified more readily as the testing becomes more utilized and minor clarifications are required. Once the TP specification has demonstrated adequacy over a period of time the method may be balloted to become a full standard. A TP specification can be utilized for up to 10 years. To move from a TP specification to a formal AASHTO Standard, a formal precision statement is required. This ILS work will provide the precision information and potentially accelerate the adoption of the procedures, should AASHTO deem adoption appropriate. Moving a proposed standard to a provisional standard, to a full standard, is entirely in the control of AASHTO.
Attachment I

The Aggregate Image Measurement System
Interior of Aggregate Image Measurement System
Appendix AFA2A Calibration and Ruggedness
A Report Submitted to Pine Instrument as Part of FHWA Contract #DTFH61-G-00003
Leslie Gates, Eyad Masad, and Enad Mahmoud
Texas A&M University
College Station , TX 77843-3136
Email: emasad@civil.tamu.edu
December 23, 2008
Introduction
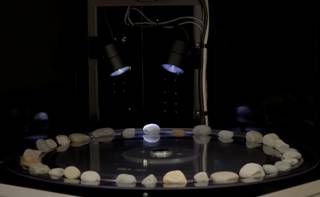
The Aggregate Image Measurement System (AIMS) was developed to measure aggregate shape characteristics using a computer controlled motion; and image processing and analysis techniques (Masad et al. 2007). Aggregates are arranged on a lit tray and a digital camera captures images which are analyzed using AIMS SOFTWARE©. The aggregate angularity is depicted by measuring the irregularity of a particle surface from a black and white image using a bottom lit tray. The texture index is obtained from grayscale images that are analyzed using the wavelet analysis method (Masad et al. 2007). Figure 1 shows an illustration of the AIMS system.
This study introduces a new prototype of AIMS (see Fig. 2) - which will be, in this report, referred to as AIMS2, while AIMS1 (see Fig. 1) will refer to the old system that was available before the initiation of this study. Although the physical design and process of capturing images were changed between AIMS1 and AIMS2, the algorithms used for the images analysis are the same. This report includes the results of calibrating the new system to confirm that the two systems are producing similar results for the same set of aggregates. Also preliminary results from the ruggedness study to assess system operational performance, identify significant inputs, and determine appropriate limits for those inputs, are presented herein as well.
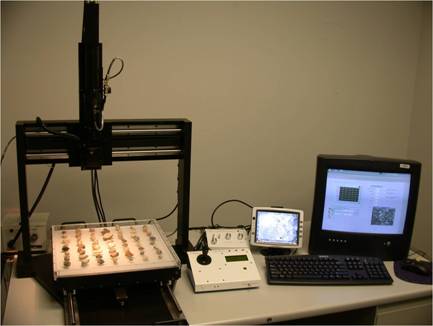
Figure 1. A Picture of AIMS1
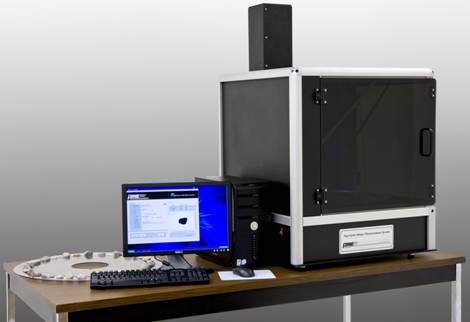
Figure 2. A Picture of AIMS2
AIMS2 Calibration
This section includes the information in regard to the calibration of AIMS2 system. The calibration was done in order to insure the two systems, AIMS1 and AIMS2, were producing similar results for the same set of aggregates. In the development of the new prototype of AIMS2, all of the resulting parameters from the two systems were compared to each other for a set of 32 coarse aggregate samples and 21 fine aggregate samples. Fifty six particles were scanned for each aggregate source. The comparison of the angularity of the fine and coarse aggregates are shown in Figure 3. The angularity values of the two AIMS systems are comparable.
Figure 3. Angularity of AIMS1 and AIMS2
AIMS1 and AIMS 2 texture results, shown in Figure 4, rank the aggregates in the same order. However, due to the difference in the cameras and lighting used in AIMS2 and AIMS1, the range of the scale of the texture results of the two systems were different. The scale range for the studied aggregates for AIMS1 was 0 - 600 while the scale for AIMS2 was 0 - 200. It was found that a multiplication shift factor of 2.4563 for the AIMS2 data would provide results comparable to those of AIMS1.The texture values of AIMS1 and AIMS2 after applying the shift factor are shown in Figure 5. The comparison between AIMS1 and AIMS2 results proved that the two systems provide the same ranking of aggregates and give comparable results. Consequently, the classification system developed previously by the TAMU research team for AIMS1 (Mahmoud et al. 2008) can be used to classify aggregates based on AIMS2 results.
Figure 4. Texture of AIMS1 and AIMS2
Figure 5. Texture of AIMS1 and AIMS2 shifted
Ruggedness Study
The purpose of the ruggedness study is to identify important operational and environmental factors which might cause significant variability in the results. The results of the ruggedness study can be used to establish appropriate ranges of the parameters in questions. The ruggedness test will be carried out according to ASTM C 1067-00 "Conducting a Ruggedness or Screening Program for Test Methods for Construction Materials."
The study was conducted following ASTM procedures C 1067-00. The analysis was done for 1 coarse aggregate size and 2 fine aggregate sizes in the following sieve ranges, 12.5mm to 9.5mm (0.5 in to 0.375 in), 2.36 mm to 1.18 mm (ASTM #8 sieve to ASTM #16 sieve), and 1.18 mm to 0.600 mm (ASTM #16 sieve to ASTM #30 sieve). Particles in the 12.5 mm to 9.5 mm size range passed the 12.5 mm sieve but were retained on the 9.5 mm sieve. In this study the aggregate sieve ranges will be referred to by the retained sieve size, 12.5mm to 9.5mm (0.5 in to 0.375 in) will be abbreviated as 9.5mm (0.375 in). Two aggregates were used for each sieve size, one dark color aggregate and one light color aggregate. The coarse aggregates are characterized by analyzing the angularity, texture, sphericity, and flat and elongated parameters of 50 particles. The angularity and 2D form of 150 particles are used to characterize each of the sizes of the fine aggregates.
The seven factors were selected for the fine and coarse aggregates based on plausible factors which could cause significant variation in the test results. The high and low limits for each factor were selected based on limits that would reasonably occur in the test if no particular measures were taken to control them. The factors and limits chosen for the coarse and fine aggregates are shown in Table 1 and Table 2.
| Factor | Coarse Aggregate Study Factors: | Low Limit | High Limit |
|---|---|---|---|
| A | Tray size | +1 | -1 |
| B | Light illumination (Top and Bottom Light) | -1 | +1 |
| C | AIMS2 Door | Close | Open |
| D | Focus | 0 | +1 |
| E | Zoom level | -5% | +5% |
| F | Tray Height | -1mm | +1mm |
| G | Ambient light (On, Off) | On | Off |
| Factor | Fine Aggregate Study Factors: | Low Limit | High Limit |
|---|---|---|---|
| A | Tray color | Clear Tray | Opaque Tray |
| B | Light illumination (Top and Bottom Light) | Top -1 Bottom 0 | Top +1 Bottom +1 |
| C | AIMS2 Door | Closed | Open |
| D | CHPR | 0 | 0.02 |
| E | Zoom level | -5% | +5% |
| F | Particle Count | -25 | +25 |
| G | Ambient light | On | Off |
For the coarse aggregates, each sieve range has an individual tray with different trough sizes to correctly position the aggregates under the camera. The limits for the tray size were selected as one tray size above and one tray size below the correct tray size. The light illumination is the top and bottom lighting required to capture the images. The light illumination limits were selected as +1 and -1 from the proper settings. The AIMS2 doors limits were chosen as completely open or closed to predict the significance of the door position which could let in additional ambient light. The focus, zoom level, and tray height are to check the impact of miscalculation in determining the proper levels. The tray height is the distance from the camera to the tray. The ambient light is to consider the performance of the doors in eliminating the effect changes in exterior lighting.
For the fine aggregates, the light illumination, doors position, zoom level, and ambient light factors were kept to analyze the significance of the changes on the results. One tray size is used for all the fine aggregates, but the user must select the tray color, either clear or opaque, depending on the aggregate size and color. The lighting for the fine aggregates is directly related to the tray color, if the tray color is clear the bottom is used and if the tray color is opaque the top light is used. For the clear tray, the bottom light was not able to analyze the images at -1, therefore the limits were changed to 0 and +1. The top lighting was kept at the same limits of +1 and -1. The particle count was added to determine the effect of analyzing more or less than the instructed number of particles. The CHPR value is used to eliminate touching particles that could be captured and analyzed as a single particle.
A total of 16 scans were performed: two replicate sets of eight determinations each. Scans 1 through 8 are duplicated for the study to obtain scans 9 through 16 for the analysis. Table 3 shows a template of the scans performed.
Table 3. Template of Scans
| Factor | Low Limit | High Limit | Scan Number | |||||||
|---|---|---|---|---|---|---|---|---|---|---|
| 1 | 2 | 3 | 4 | 5 | 6 | 7 | 8 | |||
| A | a | A | a | a | a | a | A | A | A | A |
| B | b | B | b | b | B | B | b | b | B | B |
| C | c | C | C | c | C | c | C | c | C | c |
| D | d | D | D | D | d | d | d | d | D | D |
| E | e | E | e | E | e | E | E | e | E | e |
| F | f | F | F | f | f | F | F | f | f | F |
| G | g | G | G | g | g | G | g | G | G | g |
| Factor | Low Limit | High Limit | Scan Number | |||||||
|---|---|---|---|---|---|---|---|---|---|---|
| 9 | 10 | 11 | 12 | 13 | 14 | 15 | 16 | |||
| A | a | A | a | a | a | a | A | A | A | A |
| B | b | B | b | b | B | B | b | b | B | B |
| C | c | C | C | c | C | c | C | c | C | c |
| D | d | D | D | D | d | d | d | d | D | D |
| E | e | E | e | E | e | E | E | e | E | e |
| F | f | F | F | f | f | F | F | f | f | F |
| G | g | G | G | g | g | G | g | G | G | g |
Experiment 1 and 2
The coarse aggregates ruggedness study was performed twice, with different trays each time. Experiment 1 used trays which produced dark shadow lines from the bottom light. This reduced the total number of particles scanned especially with the lower light intensities. The trays were replaced with ones which did not have dark shadowed lines for Experiment 2. Table 4, 5, 6, and 7 list the results from AIMS2 for the dark and light coarse aggregates for Experiment 1 and 2. The fine aggregates were not affected by the trays. The results for the dark and light fine aggregates are shown in Table 8, 9, 10, and 11.
| Number of Particles | Angularity | Texture | Sphericity | Flat and Elongated | |
|---|---|---|---|---|---|
| Scan 1 | 35 | 2826.68 | 265.71 | 0.65 | 2.92 |
| Scan 2 | 44 | 2767.43 | 280.40 | 0.70 | 2.33 |
| Scan 3 | 50 | 2756.97 | 264.41 | 0.73 | 2.03 |
| Scan 4 | 50 | 2747.62 | 270.23 | 0.64 | 3.11 |
| Scan 5 | 24 | 2658.89 | 250.85 | 0.67 | 2.79 |
| Scan 6 | 18 | 3135.49 | 272.17 | 0.75 | 1.84 |
| Scan 7 | 48 | 2846.78 | 272.74 | 0.73 | 2.04 |
| Scan 8 | 48 | 2774.34 | 271.54 | 0.68 | 2.56 |
| Scan 9 | 38 | 2763.31 | 272.66 | 0.63 | 3.12 |
| Scan 10 | 43 | 2781.10 | 272.47 | 0.71 | 2.18 |
| Scan 11 | 50 | 2759.57 | 264.60 | 0.74 | 2.00 |
| Scan 12 | 50 | 2762.95 | 270.94 | 0.64 | 3.16 |
| Scan 13 | 22 | 3030.97 | 282.86 | 0.65 | 2.82 |
| Scan 14 | 17 | 2848.53 | 255.47 | 0.77 | 1.76 |
| Scan 15 | 48 | 2756.67 | 272.36 | 0.74 | 2.00 |
| Scan 16 | 48 | 2825.92 | 269.46 | 0.68 | 2.56 |
| Number of Particles | Angularity | Texture | Sphericity | Flat and Elongated | |
|---|---|---|---|---|---|
| Scan 1 | 39 | 2434.41 | 43.74 | 0.65 | 2.71 |
| Scan 2 | 43 | 2407.84 | 42.89 | 0.69 | 2.20 |
| Scan 3 | 50 | 2462.07 | 44.79 | 0.73 | 1.98 |
| Scan 4 | 50 | 2507.19 | 41.70 | 0.64 | 3.02 |
| Scan 5 | 27 | 2336.08 | 37.78 | 0.64 | 2.75 |
| Scan 6 | 20 | 2476.93 | 35.40 | 0.75 | 1.78 |
| Scan 7 | 50 | 2448.42 | 41.28 | 0.71 | 2.06 |
| Scan 8 | 50 | 2435.48 | 43.97 | 0.67 | 2.43 |
| Scan 9 | 45 | 2422.70 | 40.76 | 0.66 | 2.68 |
| Scan 10 | 50 | 2453.50 | 42.10 | 0.69 | 2.21 |
| Scan 11 | 50 | 2484.49 | 44.04 | 0.73 | 1.98 |
| Scan 12 | 50 | 2435.96 | 41.92 | 0.64 | 3.01 |
| Scan 13 | 28 | 2807.60 | 40.11 | 0.64 | 2.59 |
| Scan 14 | 18 | 2691.57 | 40.69 | 0.69 | 1.98 |
| Scan 15 | 50 | 2401.64 | 40.84 | 0.71 | 2.05 |
| Scan 16 | 50 | 2407.32 | 44.07 | 0.67 | 2.43 |
| Number of Particles | Angularity | Texture | Sphericity | Flat and Elongated | |
|---|---|---|---|---|---|
| Scan 1 | 50 | 2648.27 | 263.47 | 0.65 | 2.95 |
| Scan 2 | 50 | 2682.28 | 264.23 | 0.70 | 2.35 |
| Scan 3 | 50 | 2722.65 | 264.35 | 0.74 | 2.02 |
| Scan 4 | 50 | 2784.45 | 260.64 | 0.63 | 3.31 |
| Scan 5 | 49 | 2828.15 | 257.26 | 0.65 | 3.07 |
| Scan 6 | 49 | 2850.43 | 257.84 | 0.75 | 1.91 |
| Scan 7 | 50 | 2703.87 | 258.45 | 0.72 | 2.17 |
| Scan 8 | 50 | 2753.98 | 260.55 | 0.69 | 2.56 |
| Scan 9 | 50 | 2628.28 | 265.41 | 0.65 | 2.95 |
| Scan 10 | 50 | 2731.97 | 265.11 | 0.70 | 2.35 |
| Scan 11 | 50 | 2781.50 | 264.90 | 0.74 | 2.02 |
| Scan 12 | 50 | 2732.04 | 263.02 | 0.63 | 3.28 |
| Scan 13 | 49 | 2788.81 | 256.58 | 0.65 | 3.05 |
| Scan 14 | 50 | 2892.87 | 259.52 | 0.75 | 1.95 |
| Scan 15 | 50 | 2719.25 | 258.93 | 0.72 | 2.15 |
| Scan 16 | 50 | 2765.43 | 261.26 | 0.68 | 2.65 |
| Number of Particles | Angularity | Texture | Sphericity | Flat and Elongated | |
|---|---|---|---|---|---|
| Scan 1 | 50 | 2429.46 | 46.98 | 0.65 | 2.79 |
| Scan 2 | 50 | 2322.89 | 45.19 | 0.68 | 2.38 |
| Scan 3 | 50 | 2477.50 | 46.51 | 0.72 | 1.99 |
| Scan 4 | 50 | 2481.87 | 45.55 | 0.62 | 3.17 |
| Scan 5 | 48 | 2352.98 | 42.99 | 0.63 | 3.04 |
| Scan 6 | 48 | 2422.59 | 44.76 | 0.72 | 1.95 |
| Scan 7 | 48 | 2459.10 | 44.29 | 0.70 | 2.13 |
| Scan 8 | 48 | 2417.34 | 44.88 | 0.67 | 2.54 |
| Scan 9 | 50 | 2351.49 | 46.68 | 0.65 | 2.79 |
| Scan 10 | 50 | 2421.08 | 46.39 | 0.68 | 2.30 |
| Scan 11 | 50 | 2532.09 | 46.54 | 0.73 | 1.99 |
| Scan 12 | 50 | 2466.29 | 46.04 | 0.62 | 3.16 |
| Scan 13 | 48 | 2376.74 | 43.32 | 0.63 | 2.94 |
| Scan 14 | 48 | 2396.31 | 44.61 | 0.72 | 1.94 |
| Scan 15 | 48 | 2444.22 | 43.99 | 0.70 | 2.14 |
| Scan 16 | 48 | 2414.69 | 44.06 | 0.67 | 2.53 |
| Number of Particles | Angularity | 2D Form | |
|---|---|---|---|
| Scan 1 | 175 | 2733.38 | 7.01 |
| Scan 2 | 127 | 2773.50 | 6.90 |
| Scan 3 | 126 | 2749.41 | 7.06 |
| Scan 4 | 159 | 2728.83 | 7.15 |
| Scan 5 | 35 | 4232.48 | 8.84 |
| Scan 6 | 43 | 4130.45 | 8.77 |
| Scan 7 | 114 | 3974.41 | 8.53 |
| Scan 8 | 138 | 3886.20 | 8.54 |
| Scan 9 | 175 | 2760.43 | 7.00 |
| Scan 10 | 125 | 2750.34 | 6.90 |
| Scan 11 | 125 | 2741.02 | 7.04 |
| Scan 12 | 163 | 2730.96 | 7.18 |
| Scan 13 | 35 | 3933.64 | 8.46 |
| Scan 14 | 43 | 4095.74 | 8.76 |
| Scan 15 | 116 | 4038.62 | 8.74 |
| Scan 16 | 143 | 3984.80 | 8.70 |
| Number of Particles | Angularity | 2D Form | |
|---|---|---|---|
| Scan 1 | 176 | 3361.02 | 7.62 |
| Scan 2 | 125 | 3395.39 | 7.56 |
| Scan 3 | 125 | 3450.58 | 7.77 |
| Scan 4 | 166 | 3364.33 | 7.69 |
| Scan 5 | 176 | 3518.22 | 7.75 |
| Scan 6 | 127 | 3502.52 | 7.84 |
| Scan 7 | 126 | 3418.22 | 7.63 |
| Scan 8 | 176 | 3493.94 | 7.65 |
| Scan 9 | 175 | 3336.29 | 7.57 |
| Scan 10 | 126 | 3326.40 | 7.57 |
| Scan 11 | 127 | 3392.10 | 7.84 |
| Scan 12 | 163 | 3367.07 | 7.66 |
| Scan 13 | 175 | 3505.06 | 7.72 |
| Scan 14 | 128 | 3520.79 | 7.84 |
| Scan 15 | 125 | 3464.49 | 7.62 |
| Scan 16 | 177 | 3498.74 | 7.63 |
| Number of Particles | Angularity | 2D Form | |
|---|---|---|---|
| Scan 1 | 177 | 3865.54 | 8.07 |
| Scan 2 | 125 | 4035.04 | 8.34 |
| Scan 3 | 127 | 3888.82 | 7.94 |
| Scan 4 | 175 | 3940.66 | 8.19 |
| Scan 5 | 80 | 4257.11 | 8.72 |
| Scan 6 | 112 | 4524.45 | 9.00 |
| Scan 7 | 127 | 4448.05 | 8.69 |
| Scan 8 | 178 | 4488.10 | 8.74 |
| Scan 9 | 177 | 3932.82 | 8.13 |
| Scan 10 | 125 | 4021.97 | 8.23 |
| Scan 11 | 128 | 3816.84 | 7.91 |
| Scan 12 | 176 | 3923.79 | 8.03 |
| Scan 13 | 75 | 4267.24 | 8.74 |
| Scan 14 | 105 | 4566.33 | 8.95 |
| Scan 15 | 126 | 4444.20 | 8.95 |
| Scan 16 | 178 | 4506.22 | 8.76 |
| Number of Particles | Angularity | 2D Form | |
|---|---|---|---|
| Scan 1 | 175 | 3476.30 | 7.29 |
| Scan 2 | 126 | 3529.06 | 7.23 |
| Scan 3 | 125 | 3512.45 | 7.27 |
| Scan 4 | 176 | 3490.71 | 7.26 |
| Scan 5 | 175 | 3251.36 | 7.38 |
| Scan 6 | 125 | 3361.33 | 7.49 |
| Scan 7 | 125 | 3215.62 | 7.44 |
| Scan 8 | 175 | 3144.88 | 7.42 |
| Scan 9 | 175 | 3518.83 | 7.26 |
| Scan 10 | 126 | 3518.01 | 7.31 |
| Scan 11 | 125 | 3503.70 | 7.27 |
| Scan 12 | 175 | 3518.25 | 7.23 |
| Scan 13 | 180 | 3230.41 | 7.36 |
| Scan 14 | 127 | 3351.78 | 7.57 |
| Scan 15 | 125 | 3159.08 | 7.47 |
| Scan 16 | 176 | 3180.98 | 7.48 |
ASTM C1067 contains details about calculations necessary for determining the significance of the main factors using an effect factor. An effect factor ≥ 5.59 represents a significant effect with a 5% probability for drawing an erroneous conclusion (ASTM C1067, Section 7.6). If the effect factor is ≤5.59 then the factor is considered not significant (NS) with a 95% level of confidence. The summary of the analysis for the coarse aggregates are show in Table 12 and the fine aggregates are shown in Table 13.
| Experiment 1 | Experiment 2 | Factors | |||
|---|---|---|---|---|---|
| Light | Dark | Light | Dark | ||
| Angularity | NS | NS | NS | 160.03 | Tray size |
| NS | NS | 96.34 | NS | Light illumination | |
| NS | NS | NS | 25.24 | AIMS2 Door | |
| NS | NS | NS | 408.77 | Focus | |
| NS | NS | NS | NS | Zoom level | |
| NS | NS | NS | NS | Tray Height | |
| NS | NS | NS | NS | Ambient light | |
| Texture | 19.39 | NS | 4933.41 | 20737.60 | Tray size |
| 25.86 | NS | NS | NS | Light illumination | |
| NS | NS | NS | NS | AIMS2 Door | |
| 5.89 | NS | NS | 235.86 | Focus | |
| NS | NS | 164.87 | 220.20 | Zoom level | |
| NS | NS | NS | NS | Tray Height | |
| 6.25 | NS | NS | 17.65 | Ambient light | |
| Sphericity | NS | 255.69 | 8431.15 | 27870.38 | Tray size |
| NS | NS | 2696.45 | 606.57 | Light illumination | |
| NS | NS | 32.90 | NS | AIMS2 Door | |
| NS | NS | NS | NS | Focus | |
| 121.02 | 56.09 | 567676.59 | 210883.99 | Zoom level | |
| 4305.08 | 13049.38 | 9961142.09 | 5330850.92 | Tray Height | |
| NS | NS | NS | NS | Ambient light | |
| Flat and Elongated | 876.31 | 2119.02 | 8095.51 | 27942.97 | Tray size |
| NS | NS | 121.76 | 118.08 | Light illumination | |
| NS | NS | NS | NS | AIMS2 Door | |
| NS | NS | 241.74 | 162.87 | Focus | |
| 1375.34 | 400.86 | 137713.27 | 169145.47 | Zoom level | |
| 84311.45 | 122749.74 | 3483469.88 | 7088424.96 | Tray Height | |
| 25.61 | 12.01 | 49.65 | 424.29 | Ambient light | |
| 1.18 mm (ASTM #16) | 0.600 mm (ASTM #30) | Factors | |||
|---|---|---|---|---|---|
| Dark | Light | Dark | Light | ||
| Angularity | 533994.64 | 1826.07 | 952321.83 | 125990.04 | Tray color |
| NS | NS | NS | 387.33 | Light illumination | |
| NS | NS | 4796.95 | 15.10 | AIMS2 Door | |
| NS | 27.78 | 331.31 | 293.74 | CHPR | |
| NS | NS | 13.70 | NS | Zoom level | |
| NS | NS | 349.59 | 75.06 | Particle Count | |
| NS | 8.94 | 60.90 | 13.52 | Ambient light | |
| 2D Form | 241891.77 | 103.93 | 32755.39 | 7789.89 | Tray color |
| NS | NS | 28.00 | NS | Light illumination | |
| NS | NS | 45.84 | 5.76 | AIMS2 Door | |
| 6.44 | 9028.55 | NS | NS | CHPR | |
| NS | 384.09 | NS | 34.92 | Zoom level | |
| NS | 77.40 | NS | 32.19 | Particle Count | |
| NS | NS | NS | 9.89 | Ambient light | |
Overall for the coarse aggregates, the angularity and texture showed significance due to the tray size, light illumination, ambient light, focus, and zoom level. The sphericity and flat and elongated results had more significant factors for both the light and dark aggregates for Experiment 1 and 2. The tray size, light illumination, focus, zoom level, and tray height affected both the sphericity and flat and elongated results. The ambient light affected only the flat and elongated results. Since the ambient light had significance on the results, but the AIMS2 doorposition did not, it can be concluded the AIMS2 doors are not shedding the exterior light as designed. Therefore, it was concluded that the door should be designed to be nontransparent and block ambient light.
The fine aggregates, the tray color had the most significance for both aggregate colors and sizes for the angularity and 2D form results. All of the seven factors were significant for either the angularity or the 2D form for one or more of the four fine aggregate samples tested. Since both the AIMS2 door and the ambient light were significant, the AIMS2 doors seem to be assisting to some extent in shedding exterior light; however, replacing the doors to become nontransparent would make the ambient light not significant in influencing the results.
Experiment 3
Additional analyses were performed on the coarse aggregates. In Experiment 3, some of the previous factors from Experiment 1 and 2 were removed and the limits of the remaining factors were tightened. A "dummy factor" was introduced to put in place of the removed factors. These "dummy factors" did not change any of the settings. Although the AIMS2 doors were found not to shed light as intended, they were still kept as is for Experiment 3. Table 14 lists Experiment 3 coarse aggregate factors and limits. The results for the coarse aggregates are shown in Table 15 and 16 for the dark and light aggregates. The effect factors were found to determine the significance of the main factors. The summary of the effect factors are shown in Table 17.| Factor | Coarse Aggregate Adjusted Study Factors: | Low Limit | High Limit |
|---|---|---|---|
| A | Tray size | 0 | -1 |
| B | Light illumination (Top light and Bottom light) | -1 | +1 |
| C | "Dummy Factor" | 0 | 0 |
| D | "Dummy Factor" | 0 | 0 |
| E | "Dummy Factor" | 0 | 0 |
| F | Tray Height | -0.5mm | +0.5mm |
| G | Ambient light | On | Off |
| Number of Particles | Angularity | Texture | Sphericity | Flat and Elongated | |
|---|---|---|---|---|---|
| Scan 1 | 50 | 2703.54 | 261.97 | 0.65 | 2.97 |
| Scan 2 | 50 | 2570.88 | 261.76 | 0.69 | 2.43 |
| Scan 3 | 50 | 2741.46 | 261.72 | 0.70 | 2.41 |
| Scan 4 | 50 | 2732.39 | 262.35 | 0.66 | 2.88 |
| Scan 5 | 50 | 2630.47 | 270.62 | 0.66 | 2.85 |
| Scan 6 | 50 | 2539.57 | 268.44 | 0.69 | 2.41 |
| Scan 7 | 50 | 2714.99 | 270.44 | 0.70 | 2.36 |
| Scan 8 | 50 | 2688.32 | 268.80 | 0.67 | 2.79 |
| Scan 9 | 50 | 2642.89 | 260.08 | 0.65 | 2.93 |
| Scan 10 | 50 | 2656.08 | 262.86 | 0.69 | 2.44 |
| Scan 11 | 50 | 2689.69 | 261.48 | 0.70 | 2.40 |
| Scan 12 | 50 | 2733.28 | 263.37 | 0.66 | 2.89 |
| Scan 13 | 50 | 2625.65 | 268.98 | 0.66 | 2.81 |
| Scan 14 | 50 | 2608.40 | 269.83 | 0.69 | 2.43 |
| Scan 15 | 50 | 2737.52 | 268.91 | 0.70 | 2.35 |
| Scan 16 | 50 | 2722.96 | 268.96 | 0.66 | 2.81 |
| Number of Particles | Angularity | Texture | Sphericity | Flat and Elongated | |
|---|---|---|---|---|---|
| Scan 1 | 50 | 2329.30 | 41.40 | 0.64 | 2.94 |
| Scan 2 | 50 | 2374.09 | 41.29 | 0.68 | 2.42 |
| Scan 3 | 50 | 2434.67 | 41.28 | 0.68 | 2.38 |
| Scan 4 | 50 | 2443.27 | 42.03 | 0.65 | 2.86 |
| Scan 5 | 50 | 2349.79 | 40.99 | 0.65 | 2.82 |
| Scan 6 | 50 | 2328.91 | 42.29 | 0.68 | 2.40 |
| Scan 7 | 50 | 2408.62 | 40.77 | 0.68 | 2.36 |
| Scan 8 | 50 | 2371.11 | 40.71 | 0.65 | 2.76 |
| Scan 9 | 50 | 2303.40 | 41.79 | 0.64 | 2.96 |
| Scan 10 | 50 | 2373.15 | 41.59 | 0.68 | 2.44 |
| Scan 11 | 50 | 2406.42 | 40.98 | 0.68 | 2.40 |
| Scan 12 | 50 | 2403.76 | 41.64 | 0.65 | 2.88 |
| Scan 13 | 50 | 2345.61 | 41.50 | 0.64 | 2.88 |
| Scan 14 | 50 | 2325.77 | 41.20 | 0.67 | 2.43 |
| Scan 15 | 50 | 2406.41 | 40.74 | 0.69 | 2.34 |
| Scan 16 | 50 | 2373.41 | 42.02 | 0.65 | 2.78 |
| Experiment 3 | Factors | ||
|---|---|---|---|
| Light | Dark | ||
| Angularity | 64.12 | NS | Tray size |
| 7308.12 | 337.25 | Light illumination | |
| NS | NS | "Dummy Factor" | |
| 9.66 | NS | "Dummy Factor" | |
| 293.44 | NS | "Dummy Factor" | |
| 37.33 | NS | Tray Height | |
| NS | NS | Ambient light | |
| Texture | NS | 13151.15 | Tray size |
| NS | NS | Light illumination | |
| NS | NS | "Dummy Factor" | |
| NS | NS | "Dummy Factor" | |
| NS | NS | "Dummy Factor" | |
| NS | NS | Tray Height | |
| NS | NS | Ambient light | |
| Sphericity | 27.87 | 5344.64 | Tray size |
| 1602.37 | 3849.15 | Light illumination | |
| NS | NS | "Dummy Factor" | |
| 7.79 | NS | "Dummy Factor" | |
| NS | 11.26 | "Dummy Factor" | |
| 847660.40 | 7085309.92 | Tray Height | |
| NS | 21.33 | Ambient light | |
| Flat and Elongated | 3753.97 | 746.50 | Tray size |
| 5271.79 | 207.21 | Light illumination | |
| 7.01 | NS | "Dummy Factor" | |
| NS | NS | "Dummy Factor" | |
| NS | NS | "Dummy Factor" | |
| 11256827.41 | 2005250.58 | Tray Height | |
| 480.54 | 42.50 | Ambient light | |
The angularity results of both aggregates (light and dark) showed significant variation to only the light illumination. Several factors for the light aggregates angularity were significant including tray size, tray height and two "dummy factors". The texture results have significant variations due to changes in the tray size only. The sphericity and flat and elongated results were affected by changes in the tray size, light illumination, tray height and ambient light.
Experiment 4
Since there were some "dummy factors" shown to be significant in Experiment 3, Experiment 4 was conducted using all factors as "dummy factors." This was done to determine if AIMS2 was able to control the normal variability in the system. The dark, 9.5mm (0.375 in), coarse aggregate and light and dark, 0.600 mm (ASTM #30), fine aggregates were used in Experiment 4. Also, the doors were changed to nontransparent which no longer allowed ambient light into the system. Table 18 lists the factors and the limits for Experiment 4. These are the same for the coarse and fine aggregates. The results from Experiment 4 for the coarse and fine aggregates are shown in Table 19, 20, and 21. The summary of the effect factors are shown in Table 22 for the coarse aggregates and Table 23 for the fine aggregates.
| Factor | Coarse and Fine Aggregate Factors: | Low Limit | High Limit |
|---|---|---|---|
| A | "Dummy Factor" | 0 | 0 |
| B | "Dummy Factor" | 0 | 0 |
| C | "Dummy Factor" | 0 | 0 |
| D | "Dummy Factor" | 0 | 0 |
| E | "Dummy Factor" | 0 | 0 |
| F | "Dummy Factor" | 0 | 0 |
| G | "Dummy Factor" | 0 | 0 |
| Number of Particles | Angularity | Texture | Sphericity | Flat and Elongated | |
|---|---|---|---|---|---|
| Scan 1 | 50 | 2731.88 | 656.32 | 0.66 | 2.78 |
| Scan 2 | 50 | 2751.49 | 657.16 | 0.66 | 2.79 |
| Scan 3 | 50 | 2719.72 | 660.84 | 0.66 | 2.78 |
| Scan 4 | 50 | 2722.21 | 657.90 | 0.67 | 2.73 |
| Scan 5 | 50 | 2680.50 | 659.98 | 0.66 | 2.77 |
| Scan 6 | 50 | 2697.37 | 658.39 | 0.67 | 2.75 |
| Scan 7 | 50 | 2728.48 | 662.15 | 0.66 | 2.78 |
| Scan 8 | 50 | 2747.92 | 661.14 | 0.66 | 2.77 |
| Scan 9 | 50 | 2702.50 | 661.24 | 0.66 | 2.77 |
| Scan 10 | 50 | 2747.12 | 663.30 | 0.66 | 2.76 |
| Scan 11 | 50 | 2706.37 | 660.57 | 0.66 | 2.77 |
| Scan 12 | 50 | 2719.17 | 657.08 | 0.66 | 2.75 |
| Scan 13 | 50 | 2709.70 | 657.85 | 0.66 | 2.76 |
| Scan 14 | 50 | 2677.41 | 661.83 | 0.66 | 2.76 |
| Scan 15 | 50 | 2730.12 | 661.51 | 0.67 | 2.75 |
| Scan 16 | 50 | 2660.21 | 658.07 | 0.67 | 2.73 |
| Number of Particles | Angularity | 2D Form | |
|---|---|---|---|
| Scan 1 | 152 | 3841.29 | 7.83 |
| Scan 2 | 151 | 3727.50 | 7.72 |
| Scan 3 | 153 | 3900.22 | 7.74 |
| Scan 4 | 152 | 3772.68 | 7.79 |
| Scan 5 | 151 | 3761.00 | 7.80 |
| Scan 6 | 150 | 3775.48 | 7.82 |
| Scan 7 | 150 | 3712.38 | 7.73 |
| Scan 8 | 150 | 3810.79 | 7.78 |
| Scan 9 | 150 | 3737.36 | 7.76 |
| Scan 10 | 150 | 3815.72 | 7.74 |
| Scan 11 | 152 | 3897.90 | 7.82 |
| Scan 12 | 150 | 3800.96 | 7.73 |
| Scan 13 | 151 | 3845.72 | 7.73 |
| Scan 14 | 153 | 3851.68 | 7.79 |
| Scan 15 | 153 | 3884.05 | 7.76 |
| Scan 16 | 150 | 3892.99 | 7.74 |
| Number of Particles | Angularity | 2D Form | |
|---|---|---|---|
| Scan 1 | 151 | 3330.09 | 6.91 |
| Scan 2 | 150 | 3241.78 | 6.91 |
| Scan 3 | 150 | 3293.31 | 6.94 |
| Scan 4 | 151 | 3306.61 | 6.95 |
| Scan 5 | 151 | 3318.89 | 6.96 |
| Scan 6 | 151 | 3359.40 | 6.95 |
| Scan 7 | 150 | 3351.62 | 6.95 |
| Scan 8 | 151 | 3326.83 | 6.94 |
| Scan 9 | 151 | 3324.90 | 6.95 |
| Scan 10 | 151 | 3380.49 | 6.95 |
| Scan 11 | 151 | 3376.37 | 6.95 |
| Scan 12 | 151 | 3375.59 | 6.96 |
| Scan 13 | 151 | 3362.93 | 6.95 |
| Scan 14 | 151 | 3410.54 | 6.95 |
| Scan 15 | 150 | 3334.68 | 6.93 |
| Scan 16 | 150 | 3359.42 | 6.92 |
| Experiment 4 | ||
|---|---|---|
| Dark | Factors | |
| Angularity | NS | "Dummy Factor" |
| NS | "Dummy Factor" | |
| NS | "Dummy Factor" | |
| NS | "Dummy Factor" | |
| NS | "Dummy Factor" | |
| NS | "Dummy Factor" | |
| NS | "Dummy Factor" | |
| Texture | NS | "Dummy Factor" |
| NS | "Dummy Factor" | |
| NS | "Dummy Factor" | |
| NS | "Dummy Factor" | |
| NS | "Dummy Factor" | |
| NS | "Dummy Factor" | |
| NS | "Dummy Factor" | |
| Sphericity | NS | "Dummy Factor" |
| NS | "Dummy Factor" | |
| NS | "Dummy Factor" | |
| NS | "Dummy Factor" | |
| NS | "Dummy Factor" | |
| NS | "Dummy Factor" | |
| NS | "Dummy Factor" | |
| Flat and Elongated | NS | "Dummy Factor" |
| NS | "Dummy Factor" | |
| NS | "Dummy Factor" | |
| NS | "Dummy Factor" | |
| NS | "Dummy Factor" | |
| NS | "Dummy Factor" | |
| NS | "Dummy Factor" | |
| Experiment 4 | Factors | ||
|---|---|---|---|
| Dark | Light | ||
| Angularity | NS | NS | "Dummy Factor" |
| NS | NS | "Dummy Factor" | |
| NS | NS | "Dummy Factor" | |
| NS | NS | "Dummy Factor" | |
| NS | NS | "Dummy Factor" | |
| NS | NS | "Dummy Factor" | |
| NS | NS | "Dummy Factor" | |
| 2D Form | NS | NS | "Dummy Factor" |
| NS | NS | "Dummy Factor" | |
| NS | NS | "Dummy Factor" | |
| NS | NS | "Dummy Factor" | |
| NS | NS | "Dummy Factor" | |
| NS | NS | "Dummy Factor" | |
| NS | NS | "Dummy Factor" | |
All of the "dummy factors" for the coarse and fine aggregates showed no significance in the results of the system. It can be concluded that AIMS2 is able to control normal variation in the factors without having significant effects on the results.
Summary and Conclusion
The following is a summary and conclusions of the research efforts conducted so far in the project:
- AIMS1 and AIMS2 results were found to be comparable in characterizing aggregates. A shift factor was applied to the texture results of AIMS2 to match the scale of AIMS1 texture measurements.
- The ruggedness analysis has lead to identifying significant factors affecting AIMS2 measurements. Consequently, limits were proposed for these factors. It is recommended to replace the AIMS2 doors with non-transparent ones. The new doors should be designed to completely block any ambient light which was showed to be affecting the results. Several of the other factors were significant in effecting the results, tighter limits are suggested to reduce the effect of the factors. When all "dummy factors" were used and all of the limits were selected to their correct values, AIMS2 was able to control the variations in the system enough to not have a significant effect on the results.
- For Experiments 1 and 2 discussed in this report, the factors are thought to be interacting with each other causing factors to be significant. This is also evidenced in the results of Experiment 3 with Dummy Factors indicating significance. While considered beyond the scope of this investigation, possible future research could be done to achieve a better understanding of these interactions.
- A Ruggedness study for AIMS2 was completed. The factors studied were light intensity, tray size and color, door position, focus level, zoom level, tray height, image smoothness, and particle count. Limits were recommended for these factors in order to eliminate their influence onthe results and produce repeatable and reproducible results. As long as these limits are achieved by the system, AIMS2 can control normal variations related to the factors without significantly changing the results with a 95% level of confidence. It is recommended to use nontransparent door that can block ambient light in order for the ambient light not to be a significant factor in influencing the AIMS2 results.
- The system is now ready for an Inter-laboratory Study to determine the precision of the AIMS2 system.
References
Masad, E., T. Al-Rousan, J. Button, D. Little, and E. Tutumluer, (2007). "Test Methods for Characterizing Aggregate Shape, Texture, and Angularity" National Cooperative Highway Research Program NCHRP Report 555, Washington, D.C.
Mahmoud, E., L. Gates, E. Masad, S. Erdoğan, E. Garboczi, (Under Review). "Comprehensive Evaluation of AIMS Texture, Angularity, and Dimensional Measurements" Journal of Materials in Civil Engineering.
Grant Number DTFH61-08-G-00003
Pine Instrument Company
Grove City, PA
Phone: (724) 458-6391
Fax: (724) 458-6418
www.pineinst.com
sales01@pineinst.com