

Intelligent Asphalt Compaction Analyzer
Slide 1
Project Team: Haskell Lemon Construction Company, University of Oklahoma, Volvo Road Machinery, and EST Inc.
Award: $200,000
A video clip is available (.wmv, 10.2 mb)
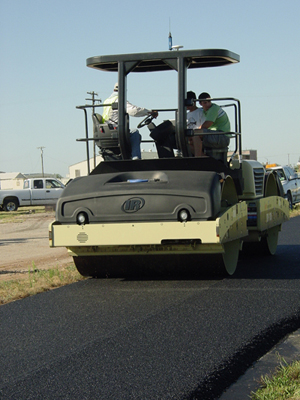
Slide 2 – The Intelligent Asphalt Compaction Analyzer Is a Roller Mounted Device
- Continuously senses the amplitude and frequency of vibrations of the compactor
- Estimates, in real-time, the quality (compacted density, stiffness) during the construction of an asphalt pavement
- Key features are the real-time monitoring of the compaction progress over the entire pavement
Slide 3 – Need
- Ruts, potholes, cracks and other forms of defects reduce the useful life of a pavement
- Improper or inadequate compaction is the most common cause of early degradation of asphalt pavements
Anticipated Advantages to Conventional Practice
- Instantaneous and complete evaluation of the pavement being compacted
- Higher efficiency and increased productivity
- Reduction in labor and fuel costs
- Reduction in the number of conventional spot tests
- Higher adaptability of compaction process to suit thin/thick lifts, soft/stiff subgrades, etc.
- Better quality resulting from uniform and optimum compaction
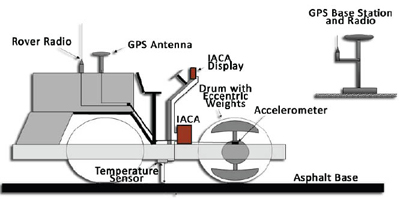
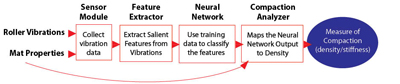
Slide 4 – Principle of Operation of the IACA
Slide 5 – IACA User Display
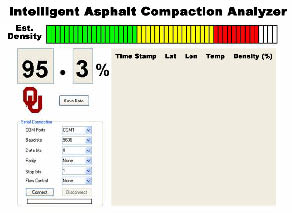
The IACA display provides real-time information on the density and the mat temperature to the roller operator at each location on the pavement during each roller pass.
Slide 6 – IACA "As-Built" Density Map
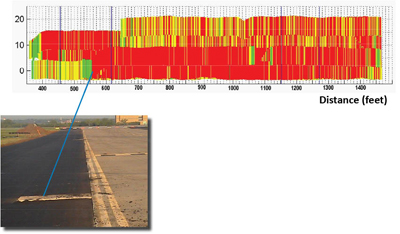
Concrete manhole cover
- Density information from the final pass of the roller can be used to compile the final density of the entire pavement. The color-coded map (red is 90%, green is 92%, yellow is 94%,) portrays the uniformity of compaction that was achieved.
- Areas in green indicate inadequate compaction or uncompacted areas resulting from relief features on the pavement surface).
- Uneven compaction can be investigated to determine the cause. In this case, soft subgrade had resulted in uneven compaction.
Slide 7 – Comparison of IACA and Non-nuclear Density Measurements
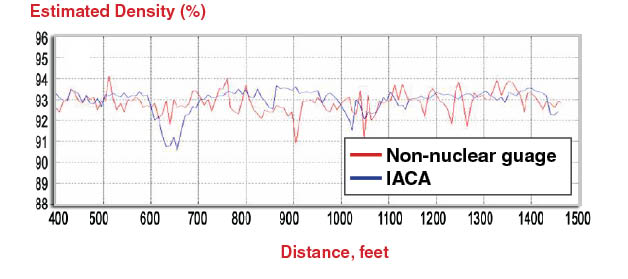
The density estimates of the IACA are comparable to those obtained by point-wise measurements using a non-nuclear gauge.
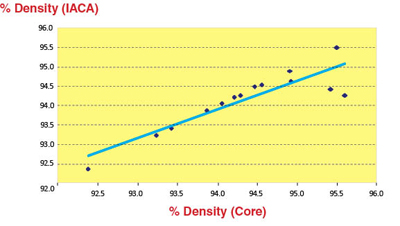
The density estimates obtained using the IACA compare very favorably with density measured from roadway cores.