

Intelligent Asphalt Compaction Analyzer
PHASE 0 PROGRESS REPORT FOR ASSISTANCE AGREEMENT
DTFH61-08-G-0002
| Program: | Highways for LIFE Technology Partnerships Program |
| Project Title: | Intelligent Asphalt Compaction Analyzer |
| Period: | October 01, 2007–December 31, 2007 |
| Submitted by: | Sesh Commuri, Associate Professor, University of Oklahoma, Norman on behalf of Haskell Lemon Construction Company Bob Lemon, Vice President Phone: (405) 947-6069 Email: BLemon@haskelllemon.com |
| Project Team: | Haskell Lemon Construction Company, Oklahoma City, OK University of Oklahoma, Norman, OK Volvo Road Machinery, Shippensburg, PA Engineering Services and Testing, Inc., Norman, OK |
| Submitted to: | Federal Highway Administration Office of Acquisition Management (HAAM) 1200 New Jersey Ave., SE, Washington, DC 20590 |
The Intelligent Asphalt Compaction Analyzer (IACA) is a device based on Neural Network Technology that can measure the density of an asphalt pavement continuously in real-time during its construction. This technology was developed at the University of Oklahoma (OU) and was tested to a limited extent in the field. These field trials demonstrated that, after calibration, the IACA can measure the density in real-time with accuracy comparable to existing point-wise measurement technologies (e.g., a nuclear density gauge or a non-nuclear density gauge such as Transtech's PQI301). While the capability of the technology was demonstrated to a limited extent, the commercial acceptance of the technology depends on the refinement and the development of a commercial prototype that is rugged and easy to use. This report addresses the Phase 0 activities in the refinement and field validation of the Intelligent Asphalt Compaction Analyzer (IACA) under the Assistance Agreement DTFH61-08-G-0002.
The following are the summary results of this phase of the project:
- A low cost WAAS GPS receiver, Trimble ProXT 10, capable measuring position with sub-meter accuracy, was integrated with the IACA and automatic calibration procedures were developed. The calibration and training procedures developed were verified using construction data from prior research.
- Preliminary studies were conducted during the construction of a full-depth pavement (base, intermediate layers and shoulder) at three sites and the calibration procedure was validated. Test results show that the density estimated by the IACA compares well with the density measured from roadway cores. Results from the 14 core locations indicate that the mean error between the IACA measurement and the actual density as measured form the core is less than 1 pcf (pound-per-cubic-feet) with a 95% confidence interval 6 of less than 3 pcf.
The results of the Phase 0 of the project indicate that the IACA can estimate the density of the asphalt pavement with an accuracy that is suitable for quality control during the construction of the asphalt pavement. The integration of low-cost GPS sensor also improves the commercial feasibility of the technology. Based on the results of Phase 0, the project team is ready to start the next phase of the project, i.e. the development of a IACA prototype as described in the Phase 1 of the proposal. It is anticipated that in the Phase 1 of the study, the calibration technique outlined in this report will be rigorously evaluated at several construction sites involving overlay of base, intermediate, and surface coures, as well as the construction of full-depth asphalt pavements across the state of Oklahoma.
Disclaimer
The contents of this report reflect the views of the author, who is responsible for the facts and the accuracy of the data presented herein. The contents do not necessarily reflect the views of the University of Oklahoma, Volvo Road Machinery, EST Inc., or the Federal Highway Administration.
Table of Contents
- 1.0 Project Goals and Results
- 2.0 Project Background
- 3.0 Field Demonstration of the IACA Calibration Procedure
- 4.0 Results and Discussions
- 5.0 Conclusions and Recommendations for Future Work
- References
- List of Figures
- List of Tables
- Appendix
1.0 Project Goals and Results
The Intelligent Asphalt Compaction Analyzer (IACA)2 is a device based on Neural Network Technology that can measure the density of an asphalt pavement continuously in real-time during its construction. This technology was developed at the University of Oklahoma (OU) and was tested to a limited extent in the field. These field trials demonstrated that, after calibration, the IACA can measure the density in real-time with accuracy comparable to existing point-wise measurement technologies (e.g., a nuclear density gauge or a non-nuclear density gauge such as Transtech's PQI 301).
Prior to the start of this project, the IACA training and calibration techniques were performed manually, thereby limiting the utility of the IACA. Developing automated, simple to use calibration techniques, and the validation of the performance during exhaustive field testing are necessary for the IACA technology to gain acceptance. This project report addresses the first step in this process, i.e., the automation of the calibration process of the IACA. The following are the goals for the Phase 0 of the project:
- Develop a procedure to automatically train and calibrate the IACA using measurements of the roller vibrations during compaction.
- Validate the training procedure under laboratory setting using real field data.
- Demonstrate the training and calibration procedure during preliminary field experiments.
The following are the summary results of this phase of the project:
- A low cost WAAS GPS receiver, Trimble ProXT 10, capable measuring position with sub-meter accuracy, was integrated with the IACA and automatic calibration procedures were developed. The calibration and training procedures developed were verified using construction data from prior research.
- Preliminary studies were conducted during the construction of a full-depth pavement (base, intermediate layers and shoulder) at three sites and the calibration procedure was validated. Test results show that the density estimated by the IACA compares well with the density measured from roadway cores. Results from the 14 core locations indicate that the mean error between the IACA measurement and the actual density as measured form the core is less than 1 pcf (pound-per-cubic-feet) with a 95% confidence interval 6 of less than 3 pcf.
The results of the Phase 0 of the project indicate that the IACA can estimate the density of the asphalt pavement with an accuracy that is suitable for quality control during the construction of the asphalt pavement. The integration of low-cost GPS sensor also improves the commercial feasibility of the technology. Based on the results of Phase 0, the project team is ready to start the next phase of the project, i.e. the development of the IACA prototype as described in the Phase 1 of the proposal. It is anticipated that in the Phase 1 of the study, the calibration technique outlined in this report will be rigorously evaluated at several construction sites involving overlay of base, intermediate, and surface coures, as well as the construction of full-depth asphalt pavements across the state of Oklahoma.
2.0 Project Background
The Intelligent Asphalt Compaction Analyzer (IACA) is a device that can measure the density of an asphalt pavement continuously in real-time, over the entire length of the pavement during its construction. Quality control techniques currently used in the field involve the measurement of density at several locations on the completed pavement or the extraction of roadway cores. These methods are usually time consuming and do not reveal the overall quality of the construction. Furthermore, any compaction issues that are identified cannot be easily remedied after the asphalt mat has cooled down.
In recent years, several Intelligent Compaction (IC) technologies have been introduced by manufacturers of vibratory compactors1, 7, 8, 9, 12. Uniform compaction of both soil and aggregate bases is achieved through the variation of the machine parameters (amplitude and frequency of vibrations, vectoring of the thrust, etc.). Dynamic control of the machine parameters allows for the application of the vibratory energy only to under-compacted areas and thereby preventing over-compaction and ensuring uniform compaction of the soil/aggregate base. While these IC techniques hold promise for the future, their performance is yet to be fully evaluated. Further, these IC products require the purchase of a new vibratory compactor that is equipped with the technology. The different IC products, their underlying technology, and open issues are listed in the Appendix.
In contrast to the IC technologies being offered in the market place today, the IACA is a measurement device that does not control any aspect of the machine behavior. Further, the IACA is a stand alone device that can be retrofitted on any existing vibratory compactor. The main utility of the IACA is in providing real-time measurements of the density of the asphalt mat at each location on the pavement under construction. This information can then be utilized by the roller operator to ensure uniform compaction, address under-compaction, as well as prevent over-compaction of the pavement
A brief description of the functioning of the IACA is provided in the next section. Details of the IACA design, calibration, and field validation can be found in our earlier published work2, 3, 4.
2.1 Principle of operation of the IACA
The IACA functions on the hypothesis that the vibratory roller and the underlying Hot Mix Asphalt (HMA) pavement form a coupled system. The response of the roller is determined by the frequency of its vibratory motors and the natural vibratory modes of the coupled system. Compaction of an asphalt mat increases its stiffness and as a consequence, the vibrations of the compactor are altered. The knowledge of the properties of the mat and the vibration spectrum of the compactor can therefore be used to estimate the stiffness of the mat. Since the quality specifications are usually specified as percentage air void content or as a percentage of the Maximum Theoretical Density (MTD) of the asphalt mat, the IACA estimates the compacted density of the pavement rather than the stiffness.
A vibratory compactor equipped with IACA is shown in Figure 1(a) and the components of the IACA are shown in Figure 1(b). The sensor module (SM) in the IACA consists of accelerometers for measuring the vibrations of the compactor during operation, infrared temperature sensors for measuring the surface temperature of the asphalt mat, an user interface for specifying the amplitude and frequency of the vibration motors, and for recording the mix type and lift thickness. The feature extraction (FE) module computes the Fast Fourier Transform (FFT) of the input signal and extracts the features corresponding to vibrations at different salient frequencies. The Neural Network (NN) Classifier is a multi-layer Neural Network (NN) that is trained to classify the extracted features into different classes where each class represents a vibration pattern specific to a pre-specified level of compaction. The Compaction Analyzer (CA) then post-processes the output of the NN and estimates the degree of compaction in real time.
2.2 Implementation of the IACA
In the experimental setup implemented in this project, the Sensor Module of the IACA comprised of an accelerometer mounted on the frame of a DD-138HFA Ingersoll-Rand vibratory compactor, an Intel Pentium based laptop to input the mat properties, and a real-time data acquisition system. The accelerometer used was a CXL10HF3 tri-axial accelerometer manufactured by Crossbow5, capable of measuring 10g acceleration up to a frequency of 10 kHz. An embedded Pentium computer, the xPC target11, served as the data acquisition system to collect and process the data.
Feature Extractor Module. This module implements a Fast Fourier Transform to efficiently extract the different frequency components of the roller vibrations. The output of the FFT is a vector with 256 elements, where each element corresponds to the signal power at the corresponding frequency. Since the vibration signal of the roller is sampled at 1 kHz, the frequency spectrum is uniformly distributed from 0 and 500 Hz. In order to classify these vibrations, the 200 elements corresponding to the response above the excitation frequency of the compactor are used as input to the classifier.
Classifier Module. The Neural Network (NN) classifier implemented is a three layer NN with 200 inputs, 10 nodes in the input layer, 4 nodes in the hidden layer, and 1 node in the output layer. The inputs of the NN correspond to the outputs of the feature extraction module, i.e. in this case 200 features in the frequency spectrum. The output corresponds to a signal indicative of the level of compaction reached.
Analyzer Module. The analyzer module uses the mix parameters, and the calibration data to convert the output of the classifier to a value representing the density of the asphalt mat at the current location of the roller.
2.3 Training of the Neural Network
Central to the functioning of the IACA is the neural network that is used to classify the observed vibrations of the compactor into classes representing different levels of compaction. In order to accomplish this, the output of the FE module is analyzed over several roller passes during the calibration process and the total power content in the vibration signal is calculated at each instant in time. Five equally spaced power levels are identified and the features corresponding to these power levels are used to train the Neural Network. During compaction, the NN observes the features of the roller vibration and classifies these features as those corresponding to one of the levels of compaction. Figure 2 shows the features corresponding to five different compaction levels, with the lowest level corresponding to the case where the roller is operating with the vibration motors turned off and the highest level corresponding to the case where the maximum vibrations observed.
2.4 Calibration of the Analyzer
The initial calibration assumes that the 'Level 0' of the vibrations correspond to the "lay down" density of the mat and the 'Level 4' of the vibrations correspond to the target density as specified in the mix design sheet (designed at 100 gyrations of the superpave gyratory compactor). Three roadway cores are extracted from known locations on the compacted pavement and their density is measured in the laboratory according to AASHTO T-166 method. The offset and slope constants for the compaction analyzer are determined to minimize the mean square error between the estimated density and the density measured from the cores.
3.0 Field Demonstration of the IACA Calibration Procedure
The field validation of the calibration and training procedure outlined in Sections 2.3 and 2.4 was carried out during the construction of State Highway SH-99 between the towns of Seminole and Little in the state of Oklahoma. An Ingersoll-Rand DD-138HFA vibratory compactor equipped with the IACA was used for the demonstration. The demonstration was carried out during normal construction and the IACA measurements did not influence the rolling process. The goal of the demonstration was to demonstrate that the proposed training and calibration scheme can be used in the field and that the measurement error between the density measured from roadway cores and the IACA is less than 2 percent of MTD of the asphalt mix.
3.1 Selection of Test Pavement
About five (5) miles of full-depth asphalt pavement was constructed and SH-99 was expanded from two to four lanes. The test sites were part of the project ACNHY-012N(014)GB/(015)GB on SH-99. Prior to the construction, an 8-inch modified subgrade stabilized with 12% fly ash was compacted and prime coat was applied immediately after the final compaction. A separator fabric and a Geogrid (Type 1) were placed on top of the compacted subgrade and an 8 inch aggregate base was placed in accordance with the Oklahoma Department of Transportation (ODOT) project ACNHY-012N(014)GB/(015)GB specifications (State Job 10166 (08)).
In order to demonstrate the calibration procedure, three different locations were selected during the construction of the base layer, the intermediate layer, and the shoulder (Figure 3 shows the plan schematic of the SH-99 project and the relative locations of the test sites TS1, TS2, and TS3. The materials used and the construction details are as follows.
3.1.1 Test Site 1 (Base Layer: Inner lane - North bound SH-99)
An ODOT S2 Recycle mix was placed at a thickness of approximately 4.0 inches on top of the compacted aggregate base. The mix contained approximately 24 percent rock, 40 percent manufactured sand, 11 percent natural sand, 25 percent recycled asphalt pavement, and 4.0 percent PG 64-22OK binder. The gradations of the mix are shown in Table 1 and the typical section of the pavement is shown in Figure 4.
3.1.2 Test Site 2 (Intermediate Layer: Shoulder - North bound SH-99)
An ODOT S3 Recycle mix was placed at a thickness of approximately 3.0 inches on top of the compacted base layer. The mix contained approximately 24 percent rock, 26 percent manufactured sand, 10 percent natural sand, 15 percent C-33 screenings, 25 percent recycled asphalt pavement, and 4.2 percent PG 64-22OK binder. The gradations of the mix are shown in Table 2 and the typical section of the pavement is shown in Figure 5(a).
3.1.3 Test Site 3 (Intermediate Layer: Inner Lane - South bound SH-99)
An ODOT S3 Recycle mix was placed at a thickness of approximately 3.0 inches on top of the compacted base layer. The mix contained approximately 23 percent rock, 39 percent manufactured sand, 13 percent natural sand, 10 percent C-33 screenings, 15 percent recycled asphalt pavement, and 4.3 percent PG 70-28OK binder. The gradations of the mix are shown in Table 3 and the typical section of the pavement is shown in Figure 5(b).
3.2 Training and Calibration of the IACA
The evaluation described in this section has been carried out during the construction of the base and the intermediate course. The calibration procedure is as follows:
- The vibration data for calibration of the IACA is first acquired during the construction of a control strip. The control strip is one hundred feet long and twelve feet wide. A thirty foot "test section" is selected in the middle of the control strip and the GPS sensor is used to trigger the collection of the vibration data as the roller compacted this "test section." The test section is selected in order to ensure that the roller is moving at a constant velocity on this section.
- Using the GPS sensor, the coordinates at the beginning and at the end of the test section is obtained by taking measurements at the center of the lane. These coordinates are used to start and stop the collection of the vibration signals as the roller passes over the test strip.
- Three test locations at the center of the lane, five feet, fifteen feet and twenty five feet from the beginning of the test section are marked.
- After each roller pass, the density is measured at each of the test locations marked in step (iv).
- The compaction process is stopped when no appreciable increase in the density is seen after the roller pass or when "roll over" is observed. The core locations are marked from the center of the lane at each of the test locations in step (iv). The GPS locations of the cores, as well as the density at the core and in the immediate vicinity of the core are recorded.
- The cores marked in the previous step are extracted and their density is measured in accordance with the AASHTO T-166 method.
- The density measurements taken after each roller pass and the densities of the extracted cores are used to train and calibrate the IACA.
4.0 Results and Discussions
4.1 Test Site 1-TS1 (Compaction of 4-inch S2 PG 64-22 OK Base Course)
The training and calibration procedure outlined above was evaluated during the compaction of the base layer. During each pass, several density readings were taken on the test strip using a calibrated PQI 301 non-nuclear density gauge. Five roller passes were used to compact the test strip before "roll over" was observed. Three cores (S1, S2, and S3 in Table 4) were extracted along the center line of the pavement 5 feet, 15 feet and 25 feet from starting point of the compacted control strip and their density was measured in the laboratory in accordance with AASHTO T-166 method. The measured density was used to calibrate the IACA. Table 5 shows the post-calibration results of the IACA measurement at the core locations.
After the calibration was completed, the performance of the IACA was evaluated during the construction of a 100 feet section of the base layer. Figure 6 shows the density measured at select locations after each pass and the density estimated by the IACA. It can be seen that the density estimated by the IACA correlates well with the density measured by a PQI 301 non-nuclear density gauge. Further, the density estimated by the IACA is also seen to accurately reflect the density measured using roadway cores extracted form the compacted pavement (Table 6).
4.2 Test Site 2-TS2 (Compaction of 3-inch S3 PG 64-22 OK Shoulder)
The calibration procedure outlined earlier was also evaluated during the construction of the intermediate layer consisting of a 3-inch lift of S3 PG 64-22 OK mix. The location of this test section is shown in Figure 3 and the cross section of the pavement is shown in Figure 5(a). Similar to the calibration procedure in Section 4.1, a thirty feet section of the pavement under construction was marked and the vibration data was collected during each roller pass over this section. Three cores (W1, W2, and W3 in Table 8) were extracted along the center line of the pavement 5 feet, 15 feet and 25 feet from starting point of the compacted control strip and their density was measured as previously described.
The IACA was trained as before and calibrated against three roadway cores (W1, W2, and W3) that were extracted from the completed pavement. The estimated densities after the calibration process and the densities of the roadway cores are shown in Table 9. After the calibration was completed, the performance of the IACA was evaluated during the construction of a 100 feet section of the shoulder. The performance of the IACA is shown in Table 10 where it can be seen that the mean 'absolute error' between the core and the estimated density is 0.5% with a standard deviation of 0.51.
4.3 Test Site 3-TS3 (Compaction of 3-inch S3 PG 70-28 OK Intermediate Layer)
The evaluation of the training and calibration of the IACA was also performed at a test site about 4 miles south of "Test Site 1" on the south bound lanes of SH-99 (Figure 5(b)). Calibration and validation was of the IACA was performed in a manner similar to that in Sections 4.1 and 4.2. The low ambient temperatures and excessive surface moisture made the use of a non-nuclear gauge ineffective in the measurement of density.
The performance of the IACA was validated during the construction of several hundred feet of the outer driving lane on southbound SH-99. Three cores were extracted at random and their density was measured in accordance with the AASHTO T-166 method (Table 11). In Table 12, the density estimated by the IACA is compared with the measurements obtained from the roadway core as well as the nuclear density gauge.
The validity of the training data from TS2 (Section 4.2) in estimating the density at this test location is shown in Table 13. It can be seen that although the calibration was performed on a site several miles from the test location, the estimated density is close to that obtained after calibration at this test site.
The density results in Tables 12, 13 indicate that adequate compaction was not achieved during the construction of this stretch of the highway. The polymer binder used along with denser aggregates from the quarry resulted in higher "Rice" density. However during construction, the compacted density above 92% Rice density was rarely achieved. The results in Section 4.2 and 4.3 underscore the importance of the IACA. Knowledge of the insufficient compaction during the construction process would have greatly assisted the roller operator and the contractor to identify the underlying cause and remedy the problem. The difficulty associated with the field use of the nuclear density gauge and the non-nuclear density gauge resulted in the under-compaction not being identified till a later date when cores were extracted and their density measured in the lab.
5.0 Conclusions and Recommendations for Future Work
This report addressed the automatic calibration of the Intelligent Asphalt Compaction Analyzer and its demonstration during the construction of a full-depth asphalt pavement on SH-99. The conclusions of the Phase 0 of the study are summarized below.
- The calibration procedures developed are easy to use and the calibrated IACA can estimate the density of the asphalt mat in real-time with an accuracy suitable for quality control in the field.
- Test results show that the density estimated by the IACA compares well with the density measured from roadway cores.
- Results from the 14 core locations indicate that the mean error between the IACA measurement and the actual density as measured form the core is less than 1 pcf (pound-per-cubic-feet) with a 95% confidence interval6 of less than 3 pcf.
- The Compaction Monitor (Figure 7) that was developed serves as a user interface and displays the GPS position of the roller, the estimated density, the temperature of the mat. The output of the IACA during compaction can be saved to a "data log" that can be used to determine density at specified locations on the road. In addition to this, the data in the log can be processed to generate as-built maps that can serve as a record of the quality of construction.
During the demonstration of the calibration procedures, several issues were identified that have to be addressed in the next phase of the project. Field calibration of the IACA should take into account all the intricacies and uncertainties of field work. These uncertainties could result due to variations in the subgrade (rehabilitation projects), seasonal variations in weather, or variability in the mix, etc. Such variations could potentially affect the accuracy of the density measurements. The calibration and validation runs were performed on a short stretch of the pavement under construction. This also minimized the difference between the calibration and validation scenarios. These issues are the focus of the evaluation studies planned in Phase I of the project and are now summarized below.
- The calibration technique outlined in this report has to be rigorously evaluated at several construction sites involving overlay of base, intermediate, and surface courses, as well as the construction of full-depth asphalt pavements across the state of Oklahoma.
- The daily and seasonal variations in ambient temperature and their effect on the HMA mat under compaction have to be studied and the impact on the performance of the IACA has to be investigated.
- Variations in the geomorphology over the project extant and the effect on the measurement accuracy have to be investigated.
- Adequacy of the proposed methodology in measuring the density of thin-lift asphalt pavements has to be studied.
- The results from the limited study of the performance of the IACA are very encouraging and detailed, thorough study in Phase I should be able to address the critical issues in the commercialization of this technology.
References
- Arasteh, Michael M., (2005). "Innovations in Compaction Control and Testing," 2007 Construction Conference, Bismark, ND.
http://www.dot.nd.gov/conferences/construction/presentations/2007/Intelligent Compaction M Arasteh FHWA.ppt (.ppt, 8.2 mb) - Commuri, S. and Zaman, M., (2007). "Final Report - Intelligent Asphalt Compaction Analyzer," submitted to Oklahoma Center for the Advancement of Science and Technology (OCAST).
- Commuri,S., and Zaman, M., (2008). "Neural Network Based Compaction Analyzer for Density Measurement during the Construction of an Asphalt Pavement," International Journal of Pavement Engineering, (in press). Also http://hotnsour.ou.edu/commuri/Intelligent_Compaction_files/IJPE_Commuri_2006.pdf (.pdf, 0.5 mb)
- Commuri, S., Mai, Anh T., and Zaman, M., (2007). "Neural Network-based Intelligent Compaction Analyzer for Estimating Compaction Quality of Hot Asphalt Mixes," ASCE Journal of Construction Engineering and Management, (under review). Also http://hotnsour.ou.edu/commuri/Intelligent_Compaction_files/ASCE2008.pdf (.pdf, 1.6 mb)
- Crossbow, (2005). Crossbow Technology Inc., 4145 N. First Street, San Jose, CA 95134.. http://www.xbow.com/Products/Product_pdf_files/Accel_pdf/HF_Series_Datasheet.pdf (.pdf, 0.1 mb)
- Freund, J.E., (1962). Mathematical Statistics, Prentice Hall, Englewood Cliffs, NJ. pp. 227-228.
- Landers, Kirk (2006). The World of Smart Compaction Systems, Better Roads, vol. 76, no. 10, pp. 56-59.
- Moore, W., (2006)."Intelligent Compaction: Outsmarting soil and asplhalt," Construction Equipment, vol. 4, pp. 39-48.
- Peterson, D. L., (2005). Continuous Compaction Control, MnROAD Demonstration, Report: MN/RC- 2005-07, submitted to Federal Highway Administration, St. Paul, MN 55101.
- ProXT GPS Pathfinder, (2007). Trimble Navigation Limited, Sunnyvale, CA. http://www.trimble.com/pathfinderproxt.shtml
- The Mathworks Inc., 3 Apple Hill Drive, Natick, MA 01760-2098. http://www.mathworks.com
- Thompson, M. J., (2006). Intelligent Soil Compaction for Assuring Subgrade Quality, Greater Iowa Asphalt Conference, Des Moines, IA. http://www.ucs.iastate.edu/mnet/_repository/2006/asphalt/pdf/Intelligent Compaction for Assuring Subgrade Quality.pdf (.pdf, 1.8 mb)
List of Figures
- Figure 1. Experimental Setup: (a) Instrumentation of the compactor; (b) Functional schematic of the IACA
- Figure 2. Spectral features corresponding to five levels of compaction
- Figure 3. Plan schematic of SH-99 project with the Test Sites TS1, TS2, and TS3
- Figure 4. Typical section of the pavement at the north end of Highway 99-TS1
- Figure 5. Typical pavement section of SH-99- TS2 and TS3
- Figure 6. Comparison of IACA estimated density and PQI measurements during compaction of the 4-inch S2 base (TS1)
- Figure 7. IACA display monitor
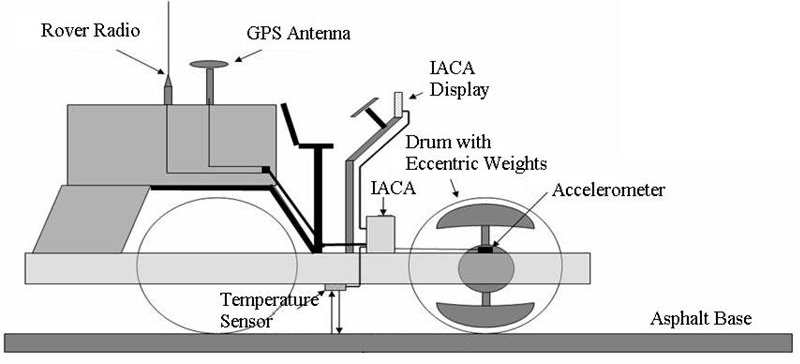
(a) Instrumentation of the compactor
(b) Functional schematic of the IACA
Figure 1. Experimental Setup
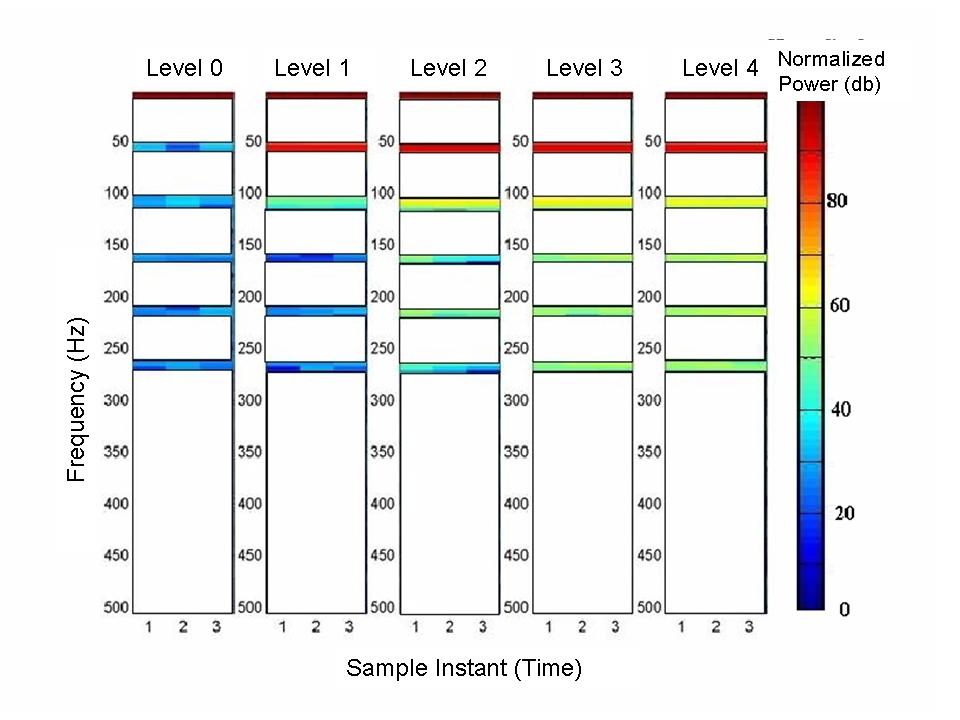
Figure 2. Spectral features corresponding to five levels of compaction
Figure 3. Plan schematic of SH-99 project with the Test Sites TS1, TS2, and TS3
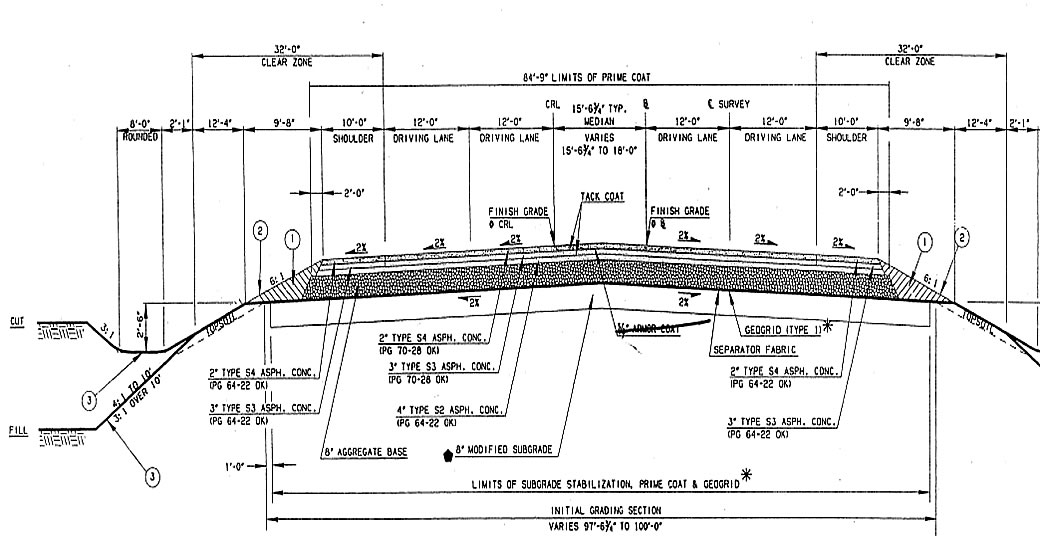
Figure 4. Typical section of the pavement at the north end of Highway 99-TS1
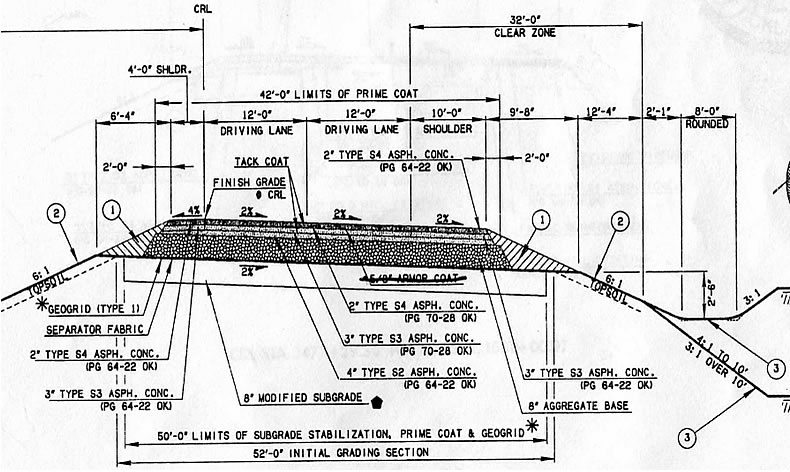
(a) Typical section of the pavement at the Test Site 2-Southbound lanes
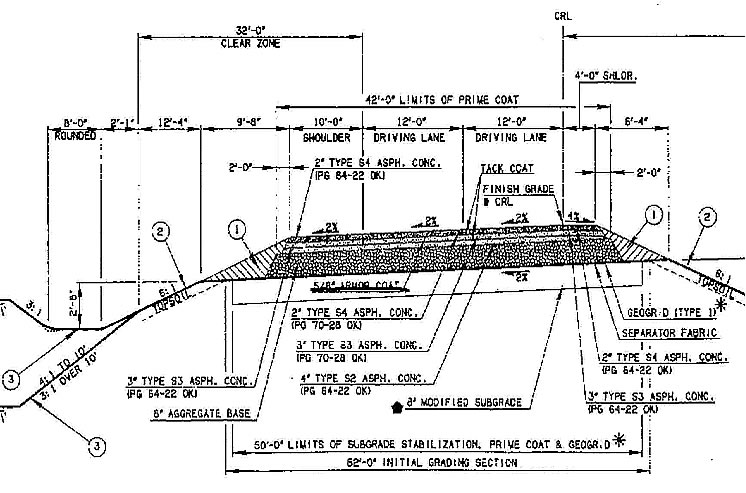
(b) Typical section of the pavement at the Test Site 3-Northbound lanes
Figure 5. Typical pavement section of SH-99- TS2 and TS3
Figure 6. Comparison of IACA estimated density and PQI measurements during compaction of the 4-inch S2 base (TS1)
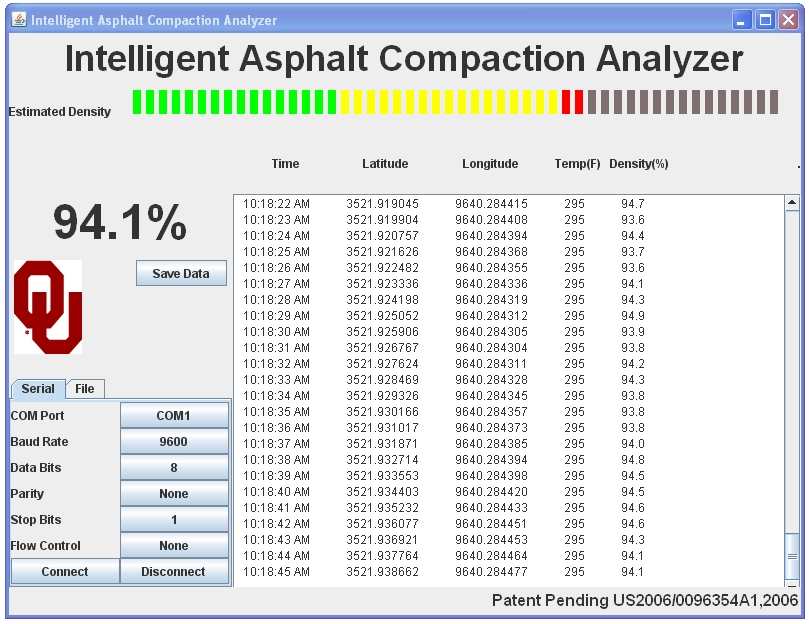
Figure 7. IACA display monitor
List of Tables
- Table 1.Gradation for mix S2 (PG64-22OK)
- Table 2.Gradation for mix S3 (PG64-22OK)
- Table 3. Gradation for mix S3 (PG70-28OK)
- Table 4. Core density results at TS1 (S2 Mix, MTD @JMF = 2.525)
- Table 5. Post calibration comparison of estimated and measured densities at TS1 (% MTD)
- Table 6. Performance of the IACA after calibration-TS1
- Table 7. Pass by pass comparison of IACA and PQI measured densities (% MTD) at TS2
- Table 8. Core density results at TS2 (S3 Mix, MTD @JMF = 2.511)
- Table 9. Comparison of calibrated IACA measurement and density of extracted cores (% MTD) at TS2
- Table 10. Performance of the IACA after calibration-TS2
- Table 11. Core density results at TS3 (S3 Mix, MTD @JMF = 2.511)
- Table 12. Validation of IACA density estimates at TS3
- Table 13. Density estimates using calibration data from TS2 at TS3
| Sieve No. | Job Formula (% passing sieve) |
|---|---|
| 25.4 mm ( 1 in) | 100 |
| 19 mm (0.75 in) | 90 |
| 12.7 mm (0.5 in) | 80 |
| 9.52 mm (0.375 in) | 76 |
| No. 4; 4.75 mm (0.187 in) | 64 |
| No. 8; 2.36 mm (0.0929 in) | 44 |
| No. 16; 1.18 mm (0.0464 in) | 32 |
| No. 30; 0.6 mm (0.0236 in) | 25 |
| No. 50; 0.3 mm (0.0118 in) | 16 |
| No. 100; 0.15 mm (0.0059 in) | 6 |
| No. 200; 0.075 mm (0.0029 in) | 3.9 |
| Sieve No. | Job Formula (% passing sieve) |
|---|---|
| 25.4 mm ( 1 in) | 100 |
| 19 mm (0.75 in) | 97 |
| 12.7 mm (0.5 in) | 88 |
| 9.52 mm (0.375 in) | 82 |
| No. 4; 4.75 mm (0.187 in) | 64 |
| No. 8; 2.36 mm (0.0929 in) | 45 |
| No. 16; 1.18 mm (0.0464 in) | 29 |
| No. 30; 0.6 mm (0.0236 in) | 20 |
| No. 50; 0.3 mm (0.0118 in) | 13 |
| No. 100; 0.15 mm (0.0059 in) | 5 |
| No. 200; 0.075 mm (0.0029 in) | 3 |
| Sieve No. | Job Formula (% passing sieve) |
|---|---|
| 25.4 mm ( 1 in) | 100 |
| 19 mm (0.75 in) | 97 |
| 12.7 mm (0.5 in) | 87 |
| 9.52 mm (0.375 in) | 80 |
| No. 4; 4.75 mm (0.187 in) | 62 |
| No. 8; 2.36 mm (0.0929 in) | 45 |
| No. 16; 1.18 mm (0.0464 in) | 28 |
| No. 30; 0.6 mm (0.0236 in) | 20 |
| No. 50; 0.3 mm (0.0118 in) | 13 |
| No. 100; 0.15 mm (0.0059 in) | 5 |
| No. 200; 0.075 mm (0.0029 in) | 3.2 |
| S1 | S2 | S3 | S4 | S5 | S6 | |
|---|---|---|---|---|---|---|
| Air wt. (gm) | 3870.0 | 3990.6 | 4170.0 | 3471.0 | 3709.5 | 4050.9 |
| Water wt. (gm) | 2208.9 | 2281.3 | 2397.0 | 2017.8 | 2163.7 | 2350.4 |
| SSD. wt (gm) | 3895.7 | 4019.7 | 4191.4 | 3494.3 | 3725.7 | 4067.7 |
| Volume (cc) | 1686.8 | 1738.4 | 1794.4 | 1476.5 | 1562.0 | 1717.3 |
| Spec. Gravity | 2.294 | 2.300 | 2.324 | 2.351 | 2.375 | 2.360 |
| Density (pcf) | 143.38 | 143.75 | 145.25 | 146.94 | 148.44 | 147.5 |
| % Density | 90.85 | 91.09 | 92.04 | 93.11 | 94.06 | 93.42 |
| Core Location | IACA | Core |
|---|---|---|
| S1 | 90.7 | 90.85 |
| S2 | 90.9 | 91.09 |
| S3 | 91.9 | 92.04 |
| Core Location | PQI | IACA | Core |
|---|---|---|---|
| S4 | 92.2 | 93.1 | 93.11 |
| S5 | 94.5 | 93.7 | 94.06 |
| S6 | 94.8 | 93.6 | 93.42 |
| Location 1 | PQI Min | PQI Max | PQI Average | IACA |
|---|---|---|---|---|
| Pass 1 | 89.9 | 92.6 | 91.3 | 91.1 |
| Pass 2 | 91.8 | 92.4 | 92.1 | 91.5 |
| Pass 3 | 91.1 | 94.3 | 92.7 | 92.9 |
| Pass 4 | 92.0 | 93.6 | 92.8 | 91.3 |
| Location 2 | PQI Min | PQI Max | PQI Average | IACA |
|---|---|---|---|---|
| Pass 1 | 90.6 | 91.6 | 91.1 | 90.9 |
| Pass 2 | 92.2 | 93.0 | 92.6 | 90.8 |
| Pass 3 | 92.5 | 93.2 | 92.9 | 93.5 |
| Pass 4 | 92.2 | 93.8 | 93.0 | 91.2 |
| Location 3 | PQI Min | PQI Max | PQI Average | IACA |
|---|---|---|---|---|
| Pass 1 | 90.5 | 91.4 | 91.0 | 91.1 |
| Pass 2 | 91.1 | 92.3 | 91.7 | 90.8 |
| Pass 3 | 91.3 | 92.3 | 91.8 | 91.2 |
| Pass 4 | 91.1 | 92.0 | 91.6 | 91.3 |
| Location 4 | PQI Min | PQI Max | PQI Average | IACA |
|---|---|---|---|---|
| Pass 1 | 90.8 | 91.4 | 91.1 | 90.5 |
| Pass 2 | 91.2 | 92.4 | 91.8 | 90.8 |
| Pass 3 | 90.7 | 92.7 | 91.7 | 91.1 |
| Pass 4 | 91.3 | 93.7 | 92.5 | 91.8 |
| W1 | W2 | W3 | W4 | W5 | W6 | W7 | W8 | |
|---|---|---|---|---|---|---|---|---|
| Air wt.(gm) | 3190.2 | 3123.9 | 3198.1 | 2961.5 | 2882.4 | 3062.2 | 3153.6 | 3083.6 |
| Water wt.(gm) | 1828.1 | 1776.8 | 1814.5 | 1694.1 | 1644.8 | 1746.6 | 1798.0 | 1758.0 |
| SSD. wt | 3206.0 | 3135.1 | 3207.8 | 2979.5 | 2894.1 | 3070.7 | 3166.7 | 3092.3 |
| Volume (cc) | 1377.9 | 1358.3 | 1393.3 | 1285.4 | 1249.3 | 1324.1 | 1368.7 | 1334.3 |
| Spec. Gravity | 2.315 | 2.300 | 2.295 | 2.304 | 2.307 | 2.313 | 2.304 | 2.311 |
| Density (pcf) | 144.69 | 143.75 | 143.44 | 144.0 | 144.19 | 144.56 | 144.0 | 144.44 |
| % Density | 92.2 | 91.6 | 91.4 | 91.8 | 91.9 | 92.1 | 91.8 | 92.0 |
| Location | IACA | Core | Error |
|---|---|---|---|
| W1 | 92.2 | 92.2 | 0 |
| W2 | 91.8 | 91.6 | -0.2 |
| W3 | 91.6 | 91.4 | -0.2 |
| Level 1 | IACA | Core | Error |
|---|---|---|---|
| W4 | 91.6 | 91.8 | 0.2 |
| W5 | 92.3 | 91.9 | -0.4 |
| W6 | 90.8 | 92.1 | 1.3 |
| W7 | 90.5 | 91.8 | 1.3 |
| W8 | 91.6 | 92 | 0.4 |
| N1 | N2 | N3 | |
|---|---|---|---|
| Air wt. (gm) | 2899.9 | 3351.8 | 2906.6 |
| Water wt. (gm) | 1612.4 | 1908.7 | 1649.5 |
| SSD. wt (gm) | 2858.6 | 3355.4 | 2913.8 |
| Volume (cc) | 1246.2 | 1446.7 | 1264.5 |
| Spec. Gravity | 2.287 | 2.317 | 2.299 |
| Density (pcf) | 142.94 | 144.81 | 143.69 |
| % Density | 90.2 | 91.4 | 90.7 |
| Location | IACA | Nuclear Density gauge | Core |
|---|---|---|---|
| N1 | 91.4 | 91.5 | 90.2 |
| N2 | 91.1 | 92.2 | 91.4 |
| N3 | 91.2 | 91.9 | 90.7 |
| Location | IACA (Old Calibration) |
IACA (New Calibration) |
Core | Nuclear Density |
|---|---|---|---|---|
| N1 | 90.6 | 91.4 | 90.2 | 91.5 |
| N2 | 90.7 | 91.1 | 91.4 | 92.2 |
| N3 | 90.6 | 91.2 | 90.7 | 91.9 |
Appendix
| S.No | IC Product | Manufacturer | Technology | Pros/Cons |
|---|---|---|---|---|
| 1. | AMMANN Compaction Expert (ACE) | Ammann America Inc. Carrollton, Texas 75006, USA info@ammann-america.com http://www.ammann-group.com |
Continuous Compaction Control (CCC)
|
Merits:
|
| 2. | BOMAG VARIO Control | BOMAG Hellerwald D-56154 Boppard Germany http://www.bomag.com |
Continuous Compaction Control (CCC)
|
Merits:
|
| 3. | GeoDynamik Compactometer | Geodynamik Regeringsgatan 111A, SE-10392 Stockholm, Sweden |
Continuous Compaction Control (CCC)
|
Merits:
Open Issues:
|
| 4. | Caterpillar IC | Caterpillar Peoria, Illinois. http://www.cat.com |
Continuous Variable Amplitude System
|
Merits:
Open Issues:
|
| 5. | Hamm Compaction | Hamm Compaction Division Wirtgen America Inc. Antioch, TN. http://www.hammcompactors.com |
Oscillation Compaction Technology
|
Merits:
Open Issues:
|
| 6. | Sakai | Sakai America, Inc. http://www.sakaiamerica.com |
Variable Amplitude System
|
Merits:
Open Issues:
|