

Performance Evaluation of Various Rehabilitation and Preservation Treatments
Appendix B - Pavement Condition Rating By Target States
KANSAS DOT
For the purposes of this report, Kansas reported their pavement condition rating in terms of the International Roughness Index.
References
Miller, R. (2009, July 17). Pavement Management Engineer, KSDOT. Email Correspondence.
Pavement Management Information System (PMIS) Glossary. (2009, February 25). Retrieved July 29, 2009, from Kansas Department of Transportation: http://www.ksdot.org/matreslab/pmis/glossary.asp
MICHIGAN DOT
MDOT collects pavement performance data (surface distresses, ride quality, and friction) on one-half of the network every year for every 0.1 mile along the pavement network under its jurisdiction. The pavement surface distress survey is conducted by videotaping and the pavement distresses collected by MDOT include transverse, longitudinal, and alligator cracking; block cracking; patches; and raveling. MDOT uses a pavement condition rating called Distress Index (DI). DI of a pavement section is a weighted score of the Distress Points (DPs) assigned to the distresses recorded by viewing video images of the pavement and identifying the type, extent and severity of each distress. For any pavement section, the DI can be calculated as the sum of the DPs along a section normalized to the section length as:

Where ΣDP is the sum of the DPs along the pavement section and L is the number of 0.1-mile pavement sections. The DI scale starts at zero for a distress free pavement condition and increases (without bound) as pavement condition worsens. MDOT assigns DIs in three categories with threshold values based on historical pavement performance: low (DI ≤ 20), medium (20 < DI <40), and high (DI ≥ 40). A DI of 50 or higher corresponds to a distress level beyond which rehabilitation or reconstruction should be seriously considered. A DI of 50 also corresponds to a remaining service life (RSL) of zero.
References
Schafer, P. (2009, May 29). Pavement Management Engineer, Michigan DOT. Email Correspondence.
Bausano, J. P., Chatti, K., & Williams, R. C. (2004). Determining Life Expectancy of Preventive Maintenance Fixes for Asphalt-Surfaced Pavements. Transportation Research Record: Journal of the Transportation Research Board, No. 1866, TRB, National Research Council, Washington, D.C. , 1-8.
MINNESOTA DOT
Pavement condition information is collected using a Pathway Services Digital Inspection Vehicle. The equipment is used to collect roughness, rutting, cracking, and faulting as well as digital images of the pavement surface. MNDOT's pavement condition data is used to calculate three condition indexes: the PSR, SR, and PQI. These indices are used to rank pavement sections and for predicting future condition and needs. Each index is reported to the tenths place and is briefly described below.
Present Serviceability Rating (PSR)
The PSR is MNDOT's ride or smoothness index. It uses a 0.0 - 5.0 rating scale, the higher the value, the smoother the road. Most new construction projects have an initial PSR slightly over
4.0. Pavements are normally designed for a terminal PSR value of 2.5. This does not mean the road is not drivable at this level but rather that it has deteriorated to a point where most people feel it is uncomfortable to drive. MNDOT measures IRI and converts it to PSR by the following formula:
PSR = 5.6972 − 2.104 IRI
Surface Rating (SR)
The SR is MNDOT's crack and surface distress index. It uses a 0.0 - 4.0 rating scale, the higher the number the less cracking is present. A brand new road has a SR of 4.0. As the type, amount and severity of the various defects increase, the SR drops. The pavement distresses that make up the SR are determined by two trained raters from MNDOT's Pavement Management Unit. Once the distress is categorized and measured, the SR can be calculated using the following procedure:
Step 1. Convert the amount of distress to a percentage (the amount of each distress type and severity level must be converted to percent).
Step 2. Calculate the Individual Weighted Distress (multiply the percent of each distress by the appropriate weighting factors).
| Distress Type | Severity | Weighting Factor |
|---|---|---|
| Transverse Cracking | Low | 0.01 |
| Medium | 0.10 | |
| High | 0.20 | |
| Longitudinal Cracking | Low | 0.02 |
| Medium | 0.03 | |
| High | 0.04 | |
| Longitudinal Joint Deterioration | Low | 0.02 |
| Medium | 0.03 | |
| Hioh | 0.04 | |
| Multiple (block) cracking | - | 0.15 |
| Alligator Cracking | - | 0.35 |
| Ruttino | - | 0.15 |
| Ravelino &Weatherino | - | 0.02 |
| Patching | - | 0.04 |
| Distress Type | Severity | Weighting Factor |
|---|---|---|
| Transverse Joint Spalling | Low | 0.10 |
| High | 0.20 | |
| Longitudinal Joint Spalling | Low | 0.10 |
| Hioh | 0.20 | |
| Cracked Panels | - | 0.07 |
| Broken Panels | - | 0.07 |
| Faulted Joints | - | 0.10 |
| Faulted Panels | - | 0.07 |
| 100% Overlaid Panels | 0.00 | |
| Patched Panels | 0.14 | |
| D-C racking | 0.10 |
| Distress Type | Severity | Weighting Factor |
|---|---|---|
| Patch Deterioration | - | 0.30 |
| Localized Distress | - | 0.40 |
| D-Cracking | - | 0.05 |
| Transverse Cracking | - | 0.25 |
Step 3. Calculate the Total Weighted Distress (TWD) (sum all of the Individual Weighting Distress to get the Total Weighted Distress).
Step 4. Convert the TWD to SR (Use the TWD and Table 4 to find the SR).
| Total Weighted Percent | SR |
|---|---|
| 0 | 4 .0 |
| 1 | 3.8 |
| 2 | 3.6 |
| 3 | 3.4 |
| 4 | 3.2 |
| 5 | 3.0 |
| 6 | 2.9 |
| 7 | 2.8 |
| 8 | 2.7 |
| 9 | 2.6 |
| 10 | 2.5 |
| 11 | 2.4 |
| 12 | 2.3 |
| 13 | 2.2 |
| 14 | 2.1 |
| 15 | 2.0 |
| 16 - 17 | 1.9 |
| 18 | 1.8 |
| 19 - 20 | 1.7 |
| 21 | 1.6 |
| 22 - 23 | 1.5 |
| 24 | 1.4 |
| 25 - 26 | 1.3 |
| 27 | 1.2 |
| 28 - 29 | 1.1 |
| 30 - 33 | 1.0 |
| 34 - 40 | 0.9 |
| 41 - 47 | 0.8 |
| 48 - 54 | 0.7 |
| 55 - 61 | 0.6 |
| 62 - 68 | 0.5 |
| 69 - 75 | 0.4 |
| 76 - 82 | 0.3 |
| 83 - 89 | 0.2 |
| 90 - 96 | 0.1 |
| 97 - 100 | 00 |
Pavement Quality Index (PQI)
The PQI is MN/DOT's overall pavement condition index. It combines the PSR and SR to give an overall performance indicator. It is equal to the square root of the PSR multiplied by the SR and ranges from 0.0 (failed) to about 4.5 (no defects).
References
Lukanen, E. (2009, June 5). Preventive Maintenance Engineer, Office of Materials, MNDOT. Email Correspondence.
Mn/DOT. (February 2003). Mn/DOT Distress Identification Manual. Office of Materials and Road Research, Pavement Management Unit.
Kuemmel, D., Robinson, R., Sonntag, R., Griffin, R., & Giese, J. K. (2001). Policies and Thresholds for Pavement Improvement on Rural Two-Lane Highways. Transportation Research Record: Journal of the Transportation Research Board, No. 1769, TRB, National Research Council, Washington, D.C. , 11-19.
TEXAS DOT
TXDOT measures rut (wherever available), ride quality and rates pavement distress on the State maintained highway network each year. Visual distress ratings, rutting and ride quality are summarized by every Data Collection Section (DCS) which is arbitrarily-defined in the Pavement Management Information System (PMIS) and usually 0.5-mile in length. A Condition Score (CS) index combines distress ratings, ride quality measurements (measured IRI converted to Serviceability Index), average daily traffic, and speed limit into a single value from 1 (worst) to 100 (best), as shown in Figure 1.
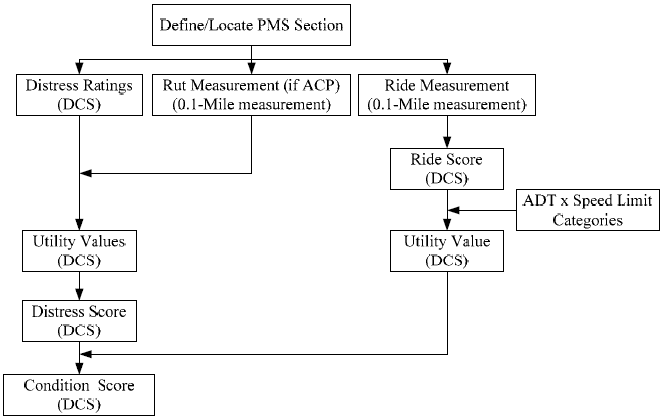
TX DOT Process Used to Calculate PMIS Condition Score
A multiplicative utility analysis approach is used to calculate the pavement distress score for every DCS section. Each distress value, with the exception of raveling, flushing, average crack spacing, and apparent joint spacing, is converted into a utility value between 0 and 1 using a sigmoidal (S-shaped) utility curve. This curve may be represented by the following equation:
Where:
U = utility value;
L = level of distress (for distress type) or ride quality lost (for ride quality);
i = distress type (e.g., deep rutting or punchouts);
e = base of the natural logarithms (e = 2.71828…);
α = a horizontal factor controlling the maximum amount of utility that can be lost;
ρ = a prolongation factor controlling "how long" the curve "last" above a certain value;
β = a slope factor controlling how steeply utility is lost in the middle of the curve.
The pavement distress score is calculated from the pavement utility curves. The equations listed in Table 1, one for each pavement type, are used to calculate the Distress Score.
| Pavement type | Distress Score Equation |
|---|---|
Asphalt |
DS=100x[USRut * UDRut * UPatch * UFail * UBlk * UAlg * ULng * UTrn] DS = Distress Score, |
Continuously |
DS=100x[Uspall * Upunch * UACPat * UPCPat] DS = Distress Score, |
Jointed |
DS=100x[UFlj * UFail * USS * ULng * UPCPat] DS = Distress Score, |
The Serviceability Index (SI) is measured automatically and reported on a scale of 0 (rough) to 5 (smooth), which is the user perception correlated to the roughness of the highway. Within the PMIS, ADT × Speed Limit is used to classify sections into Low (ADT ≤ 500 at 55 miles per hour), Medium (ADT 501 to 3,000 at 55 miles per hour), and High (ADT > 3,000 at 55 miles per hour) categories for ride quality and subsequently determine the percent of ride quality lost, L, given in equation 1. The SI is converted into a Ride Utility score from 0 to 1 using the same equation as previously introduced. To arrive at a final PMIS Condition Score for each segment of highway, the Distress Utility and Ride Utility scores are combined as shown follows.
CS =100×UDS ×URS
where:
CS = Condition Score,
DS = Distress Score, and
URide= a Ride Utility score from 0 to 1.
References
Stampley, B. E. (2009, May 11). Senior Pavement Engineer, Materials & Pavements Section, Construction Division, TXDOT. Email Correspondence.
Stampley, B. (2009, February 23). Senior Pavement Engineer, TxDOT. Overview of Calculation of PMIS Condition Score . Presented at the TxDOT Research Project 6386 Meeting.
WASHINGTON STATE DOT
The Washington DOT uses the Pavement Structural Condition (PSC) value to rate their pavement conditions. The PSC is a measure of pavement distress such as cracking and other distress measures and ranges from zero (extensive distress or very poor condition) to 100 (no distress or very good condition). PSC is a single index value used to quantify all forms and severity levels of pavement cracking including alligator (fatigue) cracking, longitudinal cracking, transverse cracking and patching for flexible pavements; and slab cracking, joint and crack spalling, pumping, faulting, scaling (e.g., from reactive aggregate distress) and patching for rigid pavements. PSC is calculated separately for flexible and rigid pavements and described by four broad pavement condition categories:
Excellent (75 <PSC ≤100)
Good (50 <PSC ≤75)
Fair (25 <PSC ≤50), and
Poor (0 ≤PSC ≤25).
Each type of distress severity is converted to an "equivalent cracking (EC)" number based on its extent and severity. The PSC is then determined using the following equations. In practice, a threshold value of PSC =50 triggers maintenance/rehabilitation for pavements.
Flexible pavements: PSC = 100 - 15.8(EC)0.50
Rigid pavements: PSC = 100 - 18.6(EC)0.43
Most often pavement distress such as cracking triggers pavements maintenance/rehabilitation; however, excessive roughness, rutting, or low surface friction can as well.
The following presents an example of how the condition index, PSC, is calculated for asphalt pavements. Note that the relevant calculations for concrete pavements are not available when this report was prepared; instead the abovementioned PSC for rigid pavements was used.
Calculation of PSC for Asphalt Pavements
The first step is to calculate the sum of the following (Type Coefficient * ((coefficient * distress) ^ power)): *The maximum allowed percentages of patching are 28.5%, 16.5%, and 8.1% for high, medium, and low, respectively. This limits the effect of patching on the overall PSC score. If the distress is higher than this, the maximum value is used.
| Distress | Type Coefficient | coefficient | Power |
|---|---|---|---|
| % Length Patching High* | 0.75 | 1 | 1 |
| % Length Patching Med* | 0.75 | 0.445 | 1.15 |
| % Length Patching Low* | 0.75 | 0.13 | 1.35 |
| % Both Wheel Paths of Alligator Cracking High | 1 | 1 | 1 |
| % Both Wheel Paths of Alligator Cracking Med | 1 | 0.445 | 1.15 |
| % Both Wheel Paths of Alligator Cracking Low | 1 | 0.13 | 1.35 |
| % Length Transverse Cracking High | 0.8 | 1 | 1 |
| % Length Transverse Cracking Med | 0.8 | 0.445 | 1.15 |
| % Length Transverse Cracking Low | 0.8 | 0.13 | 1.35 |
| % Length Longitudinal Cracking High | 0.1 | 1 | 1 |
| % Length Longitudinal Cracking Med | 0.1 | 0.445 | 1.15 |
| % Length Longitudinal Cracking Low | 0.1 | 0.13 | 1.35 |
*The maximum allowed percentages of patching are 28.5%, 16.5%, and 8.1% for high, medium,
and low, respectively. This limits the effect of patching on the overall PSC score. If the distress
is higher than this, the maximum value is used.
The sum of deducts (SD) is then applied in the following equation:
PSC = 100 - 15.8 * (SD ^ 0.5).
In other words, a 1 mile section of road with 1000 ft. of low longitudinal cracking, 400 ft. of medium alligator cracking, 250 ft. of low patching, and 50 high severity transverse cracks would have a PSC score of:
Low Longitudinal Deduct = 0.1 * [0.13 * (100 * (1000/5280))]^1.35 = 5.302
Med Alligator Deduct = 1 * [0.445 * (100 * (400/(5280 * 2)))]^1.15 = 1.823
Low Patch Deduct = 0.75 * [0.13 * (100 * (250/5280))]^1.35 = 0.40
High Trans Deduct = 0.8 * [1 * (100 * (50/5280))]^1 = 0.758
Total Deduct = 8.283
PSC = 100 - 15.8 * (8.23 ^ 0.5) = 54.67
References
WSDOT. (May 1999). Washington State Highway Pavements: Trends, Conditions and Strategic Plan. Olympia, WA: WSDOT Field Operations Support Service Center, Materials Laboratory.
David R. Luhr (2009, August 31). State Pavement Management Engineer, WSDOT. Email Correspondence.