Defining a Data Governance Program presented by Zeke Bishop (Oracle)
Webinar Promotion

Note: Attendance is limited to 100 connections so we encourage participants to log into the webinar room together where possible. By watching the webinar with another participant you can help maximize the number of total participants! If you do not make it into the webinar before we have hit maximum capacity, please call in using the teleconference number and follow along with the PDF version of the presentations linked (at the bottom) to this bulletin.
October 2, 2014 from 2-4pm Eastern
Defining a Data Governance Program
Presented by Zeke Bishop (Oracle)
During this session we will take time to better understand why a data governance program is beneficial, what is data governance, how can a data governance program help the organization, and who should ultimately be concerned about data governance within the organization.
Many organizations today are beginning to understand the clear benefits of managing their information assets efficiently. With this said, many organizations are also struggling to understand the clear starting place for maturing their Enterprise Information Management function and often start the journey with the wrong questions and little understanding of what road blocks lay ahead. Key focus areas for any endeavor of this magnitude are People, Process, and Technology. We often find organizations investing significant time on the technology portion of this equation and little time on the process and people components. Data Governance is about the people and how we can structure the organization effectively to ensure one of our most important assets, data, is governed effectively.
Zeke Bishop is currently an Enterprise Architect at Oracle focusing on the Public Sector in North America. Zeke has over 16 years of experience in the Public Sector with 14 years at the City of Phoenix working with all departments and functions to deliver on key business objectives. During his time at the City of Phoenix, Zeke was able to work towards transforming the organizations view of Information Management and develop a strong center of excellence for managing the use and delivery of information. During the development of this COE, the City found it critical to develop a strong governance model that would support the delivery of timely and accurate information to the business processes across various departments, including Aviation, Public Transit, Water and Public Works. Zeke has spent the last two years at Oracle working with States, Counties, and Cities in North America to develop their Enterprise Architecture discipline, which includes the discipline of Information Management and Data Governance.
Meeting Information
Participants do not need to preregister to attend the webinar. Attendance is limited to 100 connections and is first-come, first-served. You can log on to the webinar at:
https://connectdot.connectsolutions.com/tmipvirtualseminars/
The TeleConference Toll Free Number: 1-888-675-2535
Participant Passcode: 8344566
Meeting information has also been included in the linked Outlook calendar file.
We are committed to providing equal access to this online event for all participants. If you need alternative formats or other reasonable accommodations, please send an e-mail to the TMIP Moderator with your request as soon as possible.
Contact Us
If you have other TMIP webinar topic suggestions or if you are interested in presenting, please let us know. If you have any questions or comments about TMIP, please contact Sarah Sun, FHWA

Update your subscriptions, modify your password or email address, or stop subscriptions at any time on your Subscriber Preferences Page. You will need to use your email address to log in. If you have questions or problems with the subscription service, please contact subscriberhelp.govdelivery.com. This service is provided to you at no charge by DOT FHWA Office of Planning, Environment, and Realty (HEP). |
|
This email was sent to katie.kobylenski@rsginc.com using GovDelivery, on behalf of: DOT FHWA Office of Planning, Environment, and Realty (HEP) | 1200 New Jersey Avenue, SE | Washington, DC 20590 | 202-366-4000 |
|
Webinar Participation
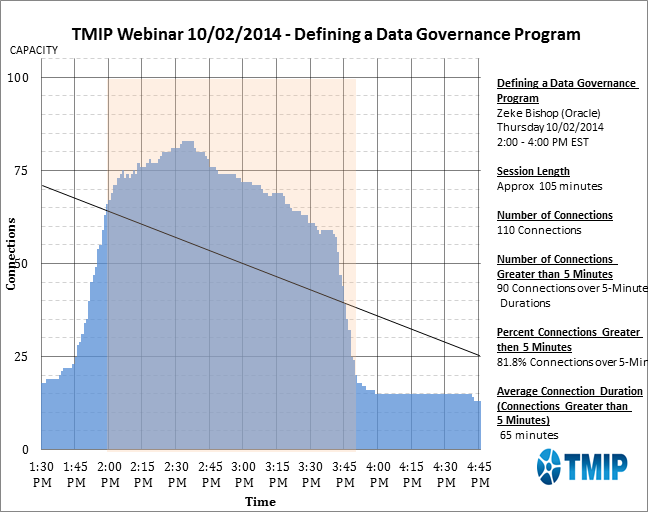
Of the 110 unique attendees (meeting connections), over 81.8% attended the webinar for over 65 minutes (of a duration of approximately 105 minutes). Error! Reference source not found. below presents a temporal profile of all the webinar participants.
Figure 1: Temporal Profile of Webinar Participation
During the webinar, attendees were encouraged to submit questions via the meeting room chat pod. Five (5) questions on the content of the presentations were asked in the chat. These questions are as follows:
The questions were answered during the presentation, which is recorded.
Seven polling questions were administered as part of the webinar. The results of some questions are listed below.
Question 1
How many participants are there at your location?
Response Options |
Response |
Percentage |
|---|---|---|
One Person |
29 |
85% |
Two People |
2 |
6% |
Three People |
2 |
6% |
Four People |
1 |
3% |
Five People |
0 |
0% |
Six to Nine People |
0 |
0% |
Ten to Twenty People |
0 |
0% |
Total |
34 |
100% |
Most respondents attended the webinar alone.
Question 2
How relevant was this webinar to your day-to-day job?
Response Options |
Response |
Percentage |
|---|---|---|
Very |
12 |
57% |
Somewhat |
9 |
43% |
Not very |
0 |
0% |
Total |
21 |
100% |
All of the respondents found the webinar to be very or somewhat useful at their current job.
Question 3
What changes would you like to see in the format?
Response Options |
Response |
Percentage |
|---|---|---|
More Time for Question & Answer |
2 |
10% |
More Presentation Time |
4 |
19% |
Just About Right As Is |
15 |
71% |
Total |
21 |
100% |
A significant majority of 71% viewed the webinar as "Just About Right As Is."
Question 4
What type of organization do you work for?
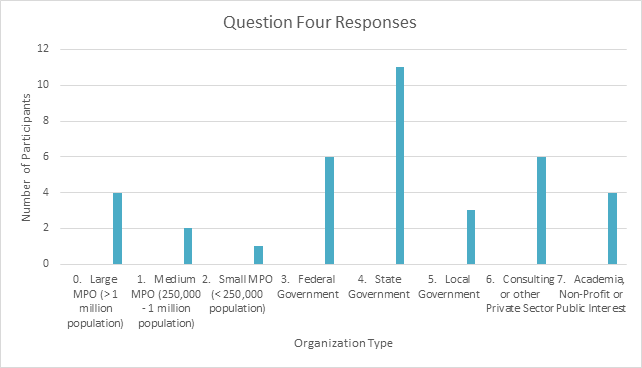
Figure 2: Evaluation Poll Question - Type of Organization
The largest group of webinar the attendees of this webinar were from State Government.
Question 5
Which of the following best describes you?
The majority of the participants in the webinar conduct or oversee research related to travel modeling as part of their agency or firm role.
Question 6
If you work for a public agency that is responsible for model-based travel forecasts, how soon do you think it will start implementing an activity-based model system?
The majority of the participants in the webinar are not responsible for model-based travel analysis.
Question 7
Do you have a Data Governance Program?
Response Options |
Response |
Percentage |
Yes |
5 |
20% |
No |
20 |
80% |
Total |
25 |
100% |
The majority of respondents (80%) do not have a Data Governance Program at this time.
Webinar Participant Feedback and Recommendations
Participant response to the webinar was generally very positive. As indicated by the unedited comments below, the participants hoped that these seminars would continue with additional details and topics. A few common themes in the comments included requests for more detail on data governance programs and suggestions for future webinar topics.
Comments
Emerging Technologies in Travel Surveys
Webinar Description and Promotion
September 25, 2014 from 2-4pm Eastern
Emerging Technologies in Travel Surveys
Collection of External Survey Data Using Bluetooth and a Community Web Survey
Presented by Ed Hard (TTI)
This presentation will provide an overview of the methods and results of an external survey conducted in the Omaha-Council Bluffs area in 2013 where Bluetooth and a Community Web Survey were used as part of a multi-faceted approach to collect external survey data. It will cover the deployment and coordination of all data collection efforts, which also included a passive video survey as well as intercept surveys, and explain the data elements collected as part of each component. The presentation will provide the technical detail related to Bluetooth, review the design of the web survey, and discuss the numerous efforts used to inform the community about the survey and direct them to the survey website. It will also discuss lessons learned and provide a brief snapshot of a current external survey underway which is comparing cell versus Bluetooth collected O&D data
Using Mobile Phone Data to Develop an External Trip Model
Presented by Leta Huntsinger, PhD, PE, and Kyle Ward, EI, (Parsons Brinckerhoff)
The presentation will cover the development of external-internal/internal-external (IX) trip model for the French Broad River MPO (FBRMPO) in western North Carolina. The data was collected 24 hours a day for one month during May 2013 for the North Carolina Department of Transportation. The data was used to develop a through trip table and to estimate an IX trip model. In the interest of time, the presentation will focus the data processing and trip table creation aspects of this effort.
Metropia: Mobility Management and Data Analytics
Presented by Mia Zmud, Principal (Metropia, Inc.)
This presentation introduces and provides real-world applications of Metropia mobility management platform and mobile app technology that dynamically manages, controls, and influences travel demand, traffic demand and traffic flow of a regions' transportation facilities. The recently available mobile app, Metropia Mobile, uses prediction and coordinating technology combined with user rewards to incentivize drivers to cooperate, balance traffic load on the network, and reduce traffic This dynamic smartphone-based data mechanism opens up the possibilities of allowing long-term continual data collection to support travel behavior research, traffic management, and transportation planning and modeling.. Several data analytics use cases will be presented.
Applications of Mobile Technology to Study Transit Rider Behavior and Sustainable Travel
Presented by Joan L. Walker, PhD, and Andre Carrel (University of California at Berkeley)
This presentation covers two large studies that made use of mobile technology to study and change behavior. The first one, Quantified Traveler, was a 130-person study in which participants were fed back information on the footprint of their travel patterns with the goal of inducing more sustainable travel behavior. The second was the San Francisco Travel Quality Study, in which nearly 800 transit riders in San Francisco were recruited to give feedback about their experiences using public transportation in San Francisco. By fusing cell phone tracking data with survey responses and other data sources, it was possible to collect a rich data set that provides insights on behavior and satisfaction at an individual-level scale.
Meeting Information
Participants do not need to preregister to attend the webinar. Attendance is limited to 100 connections and is first-come, first-served. You can log on to the webinar at:
https://connectdot.connectsolutions.com/tmipvirtualseminars/
The TeleConference Toll Free Number: 1-888-675-2535
Participant Passcode: 8344566
Meeting information has also been provided in the attached calendar invite.
We are committed to providing equal access to this online event for all participants. If you need alternative formats or other reasonable accommodations, please send an e-mail to the TMIP Moderator with your request as soon as possible.
Contact Us
If you have other TMIP webinar topic suggestions or if you are interested in presenting, please let us know. If you have any questions or comments about TMIP, please contact Sarah Sun, FHWA.
Webinar Participation
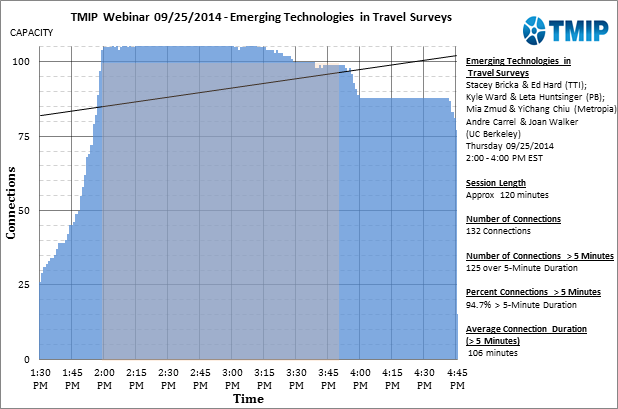
Of the 132 unique attendees (meeting connections), over 90% attended the webinar for over 106 minutes (of a duration of approximately 120 minutes). Figure 3, below presents a temporal profile of all the webinar participants.
Figure 3: Temporal Profile of Webinar Participation
During the webinar, attendees were encouraged to submit questions via the meeting room chat pod. Twenty-two (22) questions on the content of the presentations were asked in the chat. These questions are as follows:
The questions were answered after each presentation concluded and also while other presentations were going on within the chat pod.
Six polling questions were administered as part of the webinar. The results of some questions are listed below.
Question 1
How many participants are there at your location?
Most respondents attended the webinar alone.
Question 2
How relevant was this webinar to your day-to-day job?
Response Options |
Response |
Percentage |
|---|---|---|
Very |
19 |
49% |
Somewhat |
20 |
51% |
Not very |
0 |
0% |
Total |
39 |
100% |
All of the respondents found the webinar to be very or somewhat useful at their current job.
Question 3
What changes would you like to see in the format?
A significant majority of 79% viewed the webinar as "Just About Right As Is."
Question 4
What type of organization do you work for?
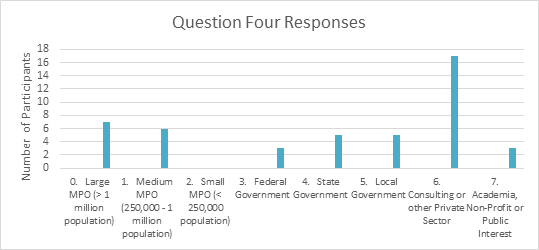
Figure 4: Evaluation Poll Question - Type of Organization
The largest group of webinar the attendees of this webinar were from private sector consulting firms.
Question 5
Which of the following best describes you?
The majority of the participants in the webinar applies and maintains travel demand models as part of their agency or firm role.
Question 6
If you work for a public agency that is responsible for model-based travel forecasts, how soon do you think it will start implementing an activity-based model system?
The majority of the participants in the webinar are not responsible for model-based travel analysis.
Participant Feedback and Recommendations
Participant response to the webinar was generally very positive. As indicated by the unedited comments below:
Comments
What does (data) integrity and utility mean to you? Painstaking attention to detail comes to mind.
Webinar Description and Promotion
If you do not make it into the webinar before we have hit maximum capacity, please call in using the teleconference number and follow along with the PDF version of the presentations linked (at the bottom) to this bulletin.
August 21, 2014 from 2-4pm Eastern
What does (data) integrity and utility mean to you? Painstaking attention to detail comes to mind.
Household travel survey data collection is a complex process, with most contracts structured to provide interim datasets and then a final dataset at the conclusion of data collection. What can you do to assure to improve the quality of the data during the survey collection period, what will you do with the data to improve its utility after the final receipt of the data? Staff from three MPOs will discuss how they evaluated interim data deliverables and modified survey field work, and how they have checked the final deliverables and edited records to adjust for anomalies, and how new sample weights were developed. A discussant will identify the key points from the 3 presentations and identify recommendation for future activities and research based on the presentations and her own survey experience.
Presented By:
Stacey Bricka, TTI
Sangeeta Bhowmick and KyeongSu Kim, NYMTC (and Louis Berger)
Chris Pulchasky, Ben Gruswitz, and Sarah Moran, DVRPC
Shimon Israel, MTC
Christi McDaniel-Wilson and Becky Knudson, Oregon DOT
Meeting Information
Participants do not need to preregister to attend the webinar. Attendance is limited to 100 connections and is first-come, first-served. You can log on to the webinar at:
https://connectdot.connectsolutions.com/tmipvirtualseminars/
The TeleConference Toll Free Number: 1-888-675-2535
Participant Passcode: 8344566
Meeting information has also been included in the linked Outlook calendar file.
We are committed to providing equal access to this online event for all participants. If you need alternative formats or other reasonable accommodations, please send an e-mail to the TMIP Moderator with your request as soon as possible.
Contact Us
If you have other TMIP webinar topic suggestions or if you are interested in presenting, please let us know. If you have any questions or comments about TMIP, please contact Sarah Sun, FHWA.
Webinar Participation
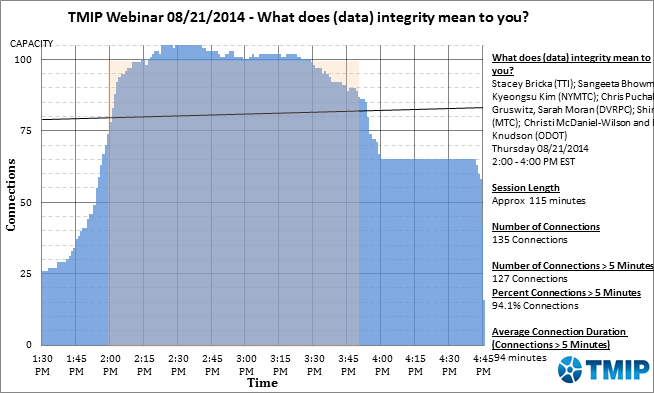
Of the 135 unique attendees (meeting connections), over 94.1% attended the webinar for over 94 minutes (of a duration of approximately 115 minutes). Error! Reference source not found. below presents a temporal profile of all the webinar participants.
Figure 5: Temporal Profile of Webinar Participation
Six polling questions were administered as part of the webinar. The results of some questions are listed below.
Question 1
How many participants are there at your location?
Most respondents attended the webinar alone.
Question 2
How relevant was this webinar to your day-to-day job?
Response Options |
Response |
Percentage |
|---|---|---|
Very |
26 |
65% |
Somewhat |
13 |
32% |
Not very |
1 |
3% |
Total |
40 |
100% |
All but one of the respondents found the webinar to be very or somewhat useful at their current job.
Question 3
What changes would you like to see in the format?
A significant majority of 93% viewed the webinar as "Just About Right As Is."
Question 4
What type of organization do you work for?
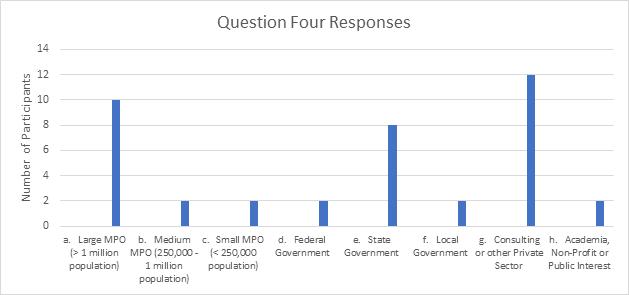
Figure 6: Evaluation Poll Question - Type of Organization
The largest group of webinar the attendees of this webinar were from consulting or other private sector firms.
Question 5
Which of the following best describes you?
The majority of the participants in the webinar conduct or oversee research related to travel modeling as part of their agency or firm role.
Question 6
If you work for a public agency that is responsible for model-based travel forecasts, how soon do you think it will start implementing an activity-based model system?
The majority of the participants in the webinar are not responsible for model-based travel analysis.
Participant Feedback and Recommendations
Participant response to the webinar was generally very positive. As indicated by the unedited comments below, the participants hoped that these seminars would continue with additional details and topics. A few common themes in the comments included requests for better audio/technical setup to improve webinar function and suggestions for future webinar topics.
Table 6: Participant Comments and Feedback
Comments
Notice
This document is disseminated under the sponsorship of the U.S. Department of Transportation in the interest of information exchange. The United State Government assumes no liability for its contents or use thereof.
The United States Government does not endorse manufacturers or products. Trade names appear in the document only because they are essential to the content of the report.
The opinions expressed in this report belong to the authors and do not constitute an endorsement or recommendation by FHWA.
This report is being distributed through the Travel Model Improvement Program (TMIP).
[1] Smart Growth Area Planning Tool (SmartGAP) At A Glance document is available for download at:
http://www.fhwa.dot.gov/planning/tmip/publications/other_reports/smartgap/index.cfm
[2] METROPOLITAN TRAVEL FORECASTING: Current Practice and Future Direction, Transportation Research Board, 2007, Page 3
[3] October 17, 2013 Email Feedback