This section provides an overview of the Baltimore Regional Transportation Board (BRTB) and regional characteristics, introduces the modeling activity conducted by Baltimore Metropolitan Council (BMC) staff in support of BRTB's activities, and presents the goals for this peer review.
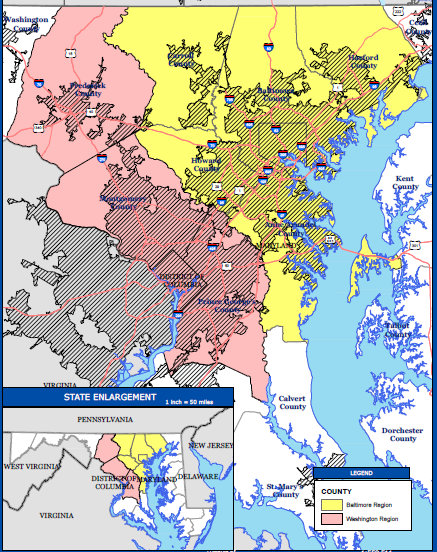
The Baltimore Regional Transportation Board (BRTB) is the federally designated MPO for the Baltimore metropolitan region, which includes Anne Arundel, Baltimore, Carroll, Harford, Howard, and Queen Anne counties (Figure 2–1). The agency is responsible for transportation planning and policy in the region. Specifically, the agency provides policy direction and oversight in the development of a federally mandated Long Range Transportation Plan (latest version: Maximize2040), Short Range Plan (latest version 2016-2019 Transportation Improvement Program (TIP)), and the transportation component of the State Air Quality Implementation Plan. In addition, BRTB manages the Unified Planning Work Program (UPWP), which provides a list of transportation-related tasks and studies to be undertaken in the region over a period of one year. The Baltimore Metropolitan Council (BMC) provides support to the work activities of the BRTB.
In 2012, the Baltimore planning area encompassed approximately 2.7 million persons and 1.5 million employment and is the 20th largest planning region in the United States. The vast majority of the population live in urbanized areas and, as shown in Figure 2–1, the region is urbanized through the north-east corridor extending through Washington, DC and Baltimore. The BRTB planning responsibilities are restricted to the six counties listed in the previous section, however travel in the Baltimore region is strongly influenced by travel in the adjacent Washington planning region. Therefore, BRTB and the Metropolitan Washington Council of Governments (MWCOG) conduct cooperative planning and both the Baltimore and Washington planning regions were described during the peer review.
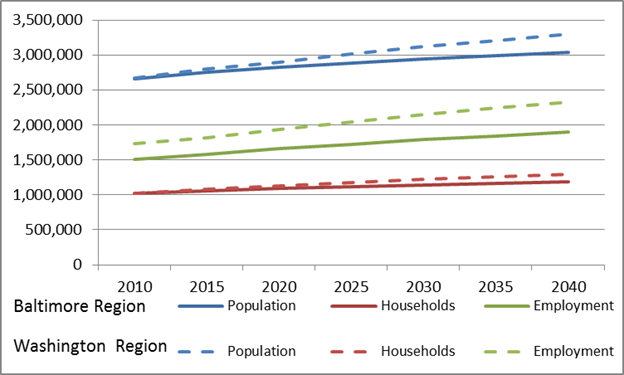
Both the Baltimore and Washington regions are forecast to grow steadily through 2040 (Figure 2–2) with Washington growing faster than Baltimore. The Baltimore region 2040 forecast shows a 14.0% increase in population with a 15.9% increase in households over 2010, which implies a decreasing average household size. 2040 employment within the Baltimore region is forecast to grow by 26.1% over 2010. This implies that a higher percentage of the population will be employed within the region and/or that more commuter trips will originate outside of the planning area.
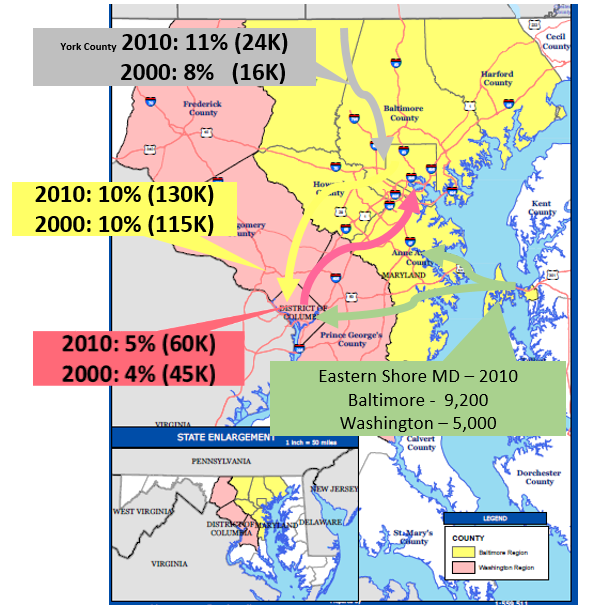
There are also substantial inter-regional interactions in terms of where people live and work (see Figure 2–3). For example, the number of workers who live in the City of Baltimore but work in Washington D.C. has risen from about 115,000 to 130,000 workers between 2000 and 2010. Over the same period, the reverse flow of workers (i.e., workers who live in Washington D.C. but work in Baltimore) has increased from about 45,000 to 60,000.
The major planning areas that the BRTB is focused on are the following:
BMC staff are responsible for maintaining the transportation model for the Baltimore planning region. The current model development activities in the area are the following:
This peer review was focused on the InSITE Activity Based Model that is described in Section 3.0.
This review is a follow up to an initial review that was conducted on December 6, 2013. The purpose of the prior review was to seek guidance and recommendations on the BMC's activity-based travel demand model framework, structure and methodology as well as the model validation criteria, targets and sensitivity testing.
Model development is complete and the model validation and testing are scheduled to be complete by June 2016. BMC plans to run InSITE in parallel with the trip based model for at least one year to gain understanding and educate model users. After one year, the model will be released to local consultants for project application. BMC's charge to the panel is to: