Chittenden County Metropolitan Planning Organization (CCMPO) Travel Model Peer Review Report
Appendix D Peer Review Panel Technical Questions
CCMPO Model Peer Review
Session 1 Follow-up - 2/28/2011
Below are two series of issues related to the CCMPO review discussion. First are several technical questions related to the existing model formulation. Brief responses to these technical questions are provided below. Second are suggested topics of discussion regarding potential model improvements - these issues will be reviewed in more detail during our next session on Thursday, 3/3/2011 at 1 pm EST.
Technical Questions
- Has the CCMPO TRANSIMS Track1 Implementation Model been utilized by the agency?
- The TRANSIMS work has not been utilized by CCMPO in-house, but some of the work performed by RSG was used to further examine traffic operations near a proposed new interchange near Burlington. MPO staff has concerns about the usability of the TRANSIMS network editing and presentation tools. As TRANSIMS is refined, the MPO may consider implementing this tool, but it is not included in the current work program.
- The TRANSIMS work is one example of on-going research in the region. For example, the University of Vermont has built an UrbanSim land-use model with support from RSG on the model integration piece. Additionally, RSG is working on the SHRP2-C10A project (Jacksonville, Burlington) which is building upon this original TRANSIMS work and incorporating DaySim.
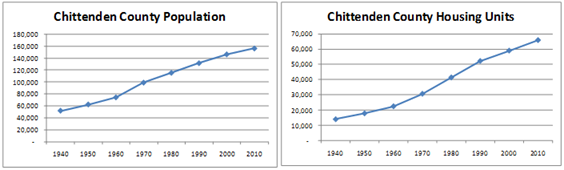
- What are the historical demographics? Stable, low growth?
- Overall, the county has a fairly stable but modest growth rate. Housing unit growth is a little faster than population growth as average HH size has declined over the years, a consistent trend throughout Vermont. The 2000-2010 compound annual population growth rate was 0.7%; for housing growth was 1.1% annually. As the charts below illustrate, growth occurred at higher rates between 1960-1990.
- Has ACS data been examined and/or utilized?
- ACS data was examined for recent trends in journey to work modes as part of CCMPO's review of the model. Future model updates will likely rely more heavily on the ACS as additional CTPP products based on the ACS are released at smaller geographies.
- How many Census tracts are there in the region?
- The CCMPO model has 335 internal TAZs; the latest 2010 Census TIGER data has 35 Census Tracts and 100 Block Groups in Chittenden County.
- What are the Production/Attraction ratios before balancing is performed?
- HBW P/A = 1.13 HBO P/A = 0.63 NHB P/A = 1.01
- The home-based other balancing ratio is admittedly larger than we would like to be.
- Were other variables considered for the cross-class trip production rates? (income, workers, etc)
- Cross-class rates by income were included in the model a number of years ago. At the time it was concluded that differences in auto ownership in the urban -vs- rural areas was a more important factor to take into account. This decision has been in place for a number of years, predating all those currently involved with the model and could easily be revisited. Regardless, neither auto ownership nor any other SE variable is carried beyond trip generation in the model sequence.
- Was there a methodology to specify the three I-I trip types (HBW, HBO, NHB) versus other potential trip types? Did the NHTS data lead in this direction?
- These are the three internal trip purposes that have been included in the model historically. The NHTS data was therefore reviewed with these trip purposes in mind. We are interested in the panel's feedback on the value of adding additional trip purposes such as shopping, school/univ, etc. We would want to carry these trip purposes through at least trip distribution to be meaningful.
- Was there a review of trip attraction coefficients from the NHTS in lieu of using ITE rates?
- No.
- Are the node delays movement specific?
- No, the node delays calculated by the volume delay function are approach-specific and not movement specific. The only movement specific delays come from turning penalties (left turns).
- Are all the counts factored to an average September weekday?
- Yes, all the counts were factored to September 2005 using monthly adjustment factors.
- How many feedback iterations are performed? Quit criteria?
- Distribution-Assignment feedback is performed until a quit criteria is satisfied. Two quit criteria must be satisfied. In the base year, 4 feedback iterations are usually required to satisfy the quit criteria. The link measure is typically satisfied before the matrix measure.
- Change in link volumes
- If less than 5% of links have a volume change less than 10%
- Change in trip interchanges
- If less than 2% of zone-to-zone interchanges have a change less than 1%
- We've tested more stringent criteria, such as:
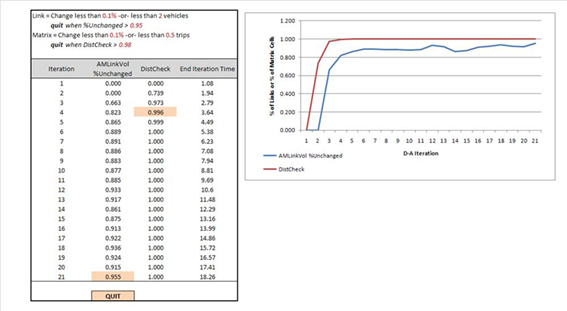
- Our perspective on this has been that convergence of the trip distribution matrices is the most important consideration. As you can see, trip distribution matrices converge tightly within 5 iterations. The networks, however, take 20 or so iterations to converge.
- We are interested in the group's feedback on recommended convergence measures and thresholds, and specifically a recommendation with respect to the value of converging on the roadway volumes tightly in the feedback loop if we can demonstrate that skims don't change after a certain iteration.
- Are the volume-delay functions facility specific?
- Yes, the link and node parameters in the IITPR.vdf are facility-type specific. See Figure 31 in the model documentation. Different parameters are used for interstates and surface streets (arterials and collectors).
- How are vehicle speeds determined? Facility type lookup tables or individual link settings?
- Individual links are assigned a free-flow speed, which is typically the speed limit. If no speed is coded in the network a facility type lookup is utilized.
-
| Facility |
Speed(mph) |
Capacity (vphpl) |
| Interstate |
65 |
1,900 |
| Limited Access Hwy |
50 |
1,900 |
| Principal Arterial |
45 |
1,600 |
| Minor Arterial |
35 |
1,200 |
| Major Collector |
35 |
800 |
| Urban Local |
25 |
800 |
| Rural Major Collector |
30 |
650 |
| Ramps |
35 |
1,170 |
| Internal Centroid |
15 |
5,000 |
| External Centroid |
30 |
5,000 |
- What impedances are used in the D-A feedback?
- Peak travel time for work and off-peak travel time for non-work.
- How are group quarters handled in the model?
- Group quarters are included in the household and population inputs. Base year has 4,517 institutional group quarter residents. Group quarters are treated as 50% one person-zero vehicle and 50% two person-one vehicle households for determining trip generation. Group quarters are associated with institutional housing for higher education (e.g. Univ of VT students). There is a regional correctional facility, but inmates are not included in the model group quarters estimates.
- Is your employment data expanded to BEA control totals? How is agricultural employment handled? How do you deal with the "headquarters" effect in employment data?
- Employment is based on infoUSA data with supplemental corrections applied by the MPO to reduce issues associated with the headquarters effect and account for major employers not included in the infoUSA dataset. The employment is not expanded to BEA control totals. Agricultural employment is located at commercial farms and related enterprises included in the infoUSA dataset.
- Did the NHTS have a GPS correction factor?
- The NHTS does not include a GPS component and haven't attempted to inflate trip generation rates to account for non-reporting a GPS survey might find. We are interested in learning about the experience in Ohio (and perhaps elsewhere) in this regard.
- Do the assignment impedance equations include time and distance?
- The assignment objective function is based solely on time.
- Is the mode choice model applied by hour or by day?
- The mode choice model is applied to a daily trip table. Peak impedances are used for work and offpeak impedances are used for non-work.
- ozone air quality analysis will require re-factoring September model output to peak ozone period in July. Should the use of September as the base month be revisited?
- Perhaps. September was selected to reflect colleges/schools being in session. Chittenden County is home to a number of small colleges and universities, University of Vermont among them. Presumably September VMT can also be adjusted based on seasonal factors to estimate July travel.
- Is the Huntington region in the model located in a State Park? Recommend avoiding concave model geography to avoid issues with I-E and E-I trips.
- There is a state park in a portion of the town of Huntington's land area, but most of the town is a river valley, which basically follows the town boundary on the internal side of the model (western edge of town), so there should not be an issue with concave model geography here.
Panel Suggested Topics for Discussion
- Incremental improvements to trip-based model
- Developing and applying a vehicle ownership model
- Additional trip purposes (shopping, school, university)
- Trip generation
- Cross-classified trip rates using different variables (workers, income)
- ii. Potential for using 2-digit NAICS for trip attraction equations
- Mode choice
- Including Mode Choice within the Distribution-Assignment feedback loop
- Adding a school bus mode
- Including land form variables in the mode choice models
- Mode choice parameters (relationship between variables)
- Expanding the model geography & zone splitting
- Use of automated license plate matching or Bluetooth equipment to better refine external travel parameters.
- Advanced models
- a. Knoxville 'Hybrid' Model
- b. Dynamic Traffic Assignment (DTA)
- c. Activity-based demand models & DaySim


