
The existing statewide travel demand model used by VDOT was developed in 2005. The primary model area includes the entire state and surrounding areas. Overall, the model includes 1,000 primary traffic analysis zones (TAZs) located within the state, and an additional 600 external TAZs. Those primary TAZs within the state are further broken into over 6,000 sub-TAZs. The network contains nearly 250,000 links and over 100,000 nodes. The TAZ structure and network are shown in Figure 3-1.
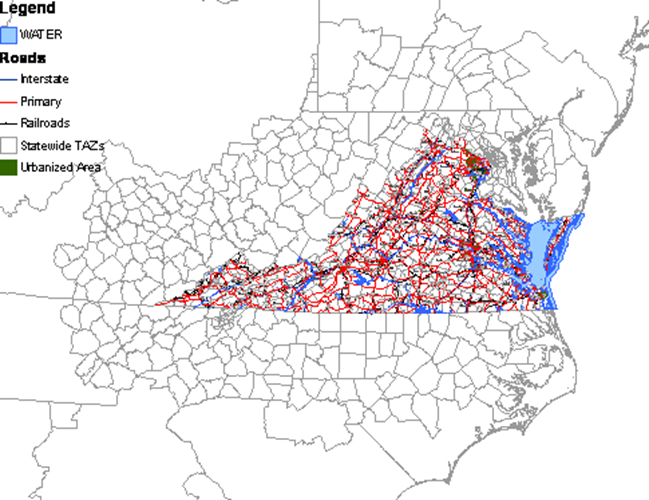
Figure 3-1: Modeling Geography of Existing Virginia Statewide Model
Like many statewide models, trips are segmented into different types. The two primary categories are passenger and freight travel. Passenger trip segmentations are shown in Table 3-1.
Trip Type |
Distance |
Purpose |
|---|---|---|
Person Trips |
Long-Distance |
Business |
Tourist |
||
Other |
||
Short-Distance |
Home-based work |
|
Home-based other |
||
Non-home-based |
In large part due to the introduction of HB 2, VDOT is developing a new statewide transportation model. Moreover, the timeframe for completing model development is relatively short, only 12 months.
Modeling Needs & Objectives
In planning for development of the new statewide model, VDOT identified several modeling capabilities and policies that the model should be sensitive to:
Due to the short timeframe for model development, VDOT developed a six-component plan for development of the model:
Data Development
The data development task will focus on several key data items needed for model development, including development of the TAZ structure, network development, socioeconomic data, data related to passenger travel, and calibration/validation data.
The TAZ structure will cover all of Virginia, using TAZ boundaries consistent with the state's regional models and Census boundaries. Some aggregation of these boundaries will be required. In addition, the TAZ structure will be extended to neighboring counties, and an even more detailed geography in neighboring districts in Washington, D.C. and Maryland, due to strong interactions that occur in that area. For freight modeling, the TAZ system will extend to all of the contiguous U.S., Mexico, and Canada, though at a relatively rough geographic scale.
The highway network will be developed using the HERE network, with speed and capacity lookup tables based on area and facility types. For out-of-state travel, the Freight Analysis Framework (FAF) network will be used. Transit network data will consider both intercity and urban transit systems, and will be based on the Virginia Department of Rail and Public Transportation (DRPT) network.
Socioeconomic data will mostly consist of population, household, and employment data, and will come from Census 2010, Census Transportation Planning Products (CTPP), and ACS survey data. In addition, data from the state's MPOs, the Virginia Employment Commission (VEC), and the Center for Public Service of the University of Virginia will be used.
Passenger travel information will primarily come from the National Household Travel Survey (NHTS) 2008-2009. Virginia purchased an add-on from that survey, so the data is richer than it would otherwise be. In addition, AirSage Data and special generator data will also be considered. AirSage data will be particularly useful for validation and for developing estimates of external travel and some long-distance interchanges in the state. Special generator data will come from traffic flow data to/from airports, seaports, and intermodal rail terminals.
Several sources of data can be used for calibration and validation of the model. These include INRIX speed and travel time data, HERE data, vehicle counts, as well as other sources.
Passenger Model Development
The passenger model will be split into two key components: short-distance trips (less than 50 miles) and long-distance trips (greater than 50 miles). The overall model structure will use a variant of the traditional 4-step procedure, including trip generation, destination choice, mode choice, time-of-day split, and traffic assignment. The overall modeling process will closely resemble VDOT's recommended travel demand model process defined in their manual, and as shown in Figure 3-2.
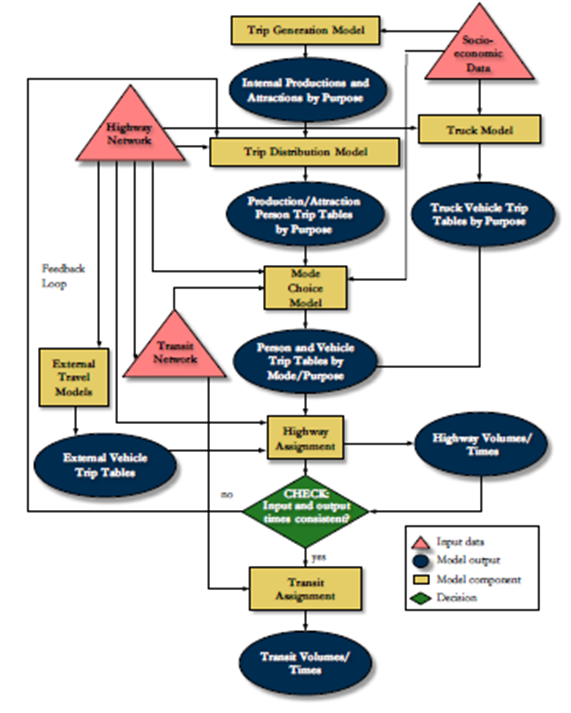
Figure 3-2: Example Four-Step Modeling Process[3]
Trip generation for short distance trips will be based on trip production and attraction rates. Internal-internal, internal-external, external-internal, and external-external trips will each be estimated separately. The model will consider six trip purposes: home-based work, home-based shop, home-based social/recreation, home-based other, non-home-based work, and non-home-based other. The trip generation rates in existing MPO models will be reviewed and incorporated as possible to ensure consistency between the statewide and MPO models.
For long-distance trips, trip generation will be quite similar in many ways, using trip production and attraction rates, but it will also include two additional trip purposes, home-based business and home-based vacation trips. In addition, trip rates will be tied to control totals for both short-and long-distance trips to avoid potential issues of double counting. The 2001 NHTS and 1995 American Travel Survey (ATS) long-distance components will be used where possible, and will be supplemented with AirSage data as needed in model development.
The destination choice models for both short- and long-distance components will be very similar in nature, using a multinomial logit (MNL) model structure. Both will use as a key measure of impedance, the composite utility (or logsum) across travel modes. Travel modes will be defined differently for short- and long-distance models.
Short-distance mode choice models may consider a number of modes. Analysis of the survey data will be used to identify specifically which modes will be used. The list of potential modes includes auto (drive alone, shared ride 2, and shared ride 3 or more) and transit (walk access and drive access). The long-distance model will pivot off the DRPT intercity rail travel demand model, which was last updated in 2008. The model will require some significant modifications as the current model is a 2-step model, first forecasting market size, then forecasting mode shares. Key impedance measures will include travel time, travel cost, frequency of service (for public modes), and on-time performance. Impedance measures will be specific to time periods in the day, defined by the time-of-day model. Appreciating how access and egress attributes are valued differently than attributes of common carrier modes will be important for the long-distance model.
Four time periods will be used for the statewide model: AM peak, midday, PM peak, and overnight. Four of the state's MPO models currently have time of day components, but the time period definitions vary across each as shown in Table 3-2. The Metropolitan Washington Council of Governments (MWCOG) time period definitions will be used for the statewide model using splits estimated from the NHTS add-on data.
Highway assignment will use multi-user class, user equilibrium approach for each time period. The models will consider at least three classes of autos: drive alone, shared ride 2, and shared ride 3 or more. Trucks may be included in separate classes, or may be preloaded on the network. Conical volume-delay functions will be used to estimate the interaction between volumes and congestion levels. Transit assignment routines will also be conducted for peak and off-peak periods. The final step will be feedback loops to ensure convergence between demand and supply levels.
Freight Model Development
The freight model will be split into two components: an intrastate truck trip model and an interstate freight model. The intrastate truck trip model will use American Truck Research Institute (ATRI) and Trimble GPS data. The GPS data must be processed to identify stops among GPS coordinate data, and land use information at those stops must be identified. The model will consist of two parts. The first part is trip generation, including trip production and attraction, which relates truck trip ends to land use characteristics in a TAZ. The second is trip distribution, which will use a gravity-type model to link origin and destination trip ends identified from trip generation step.
The interstate freight model will use TRANSEARCH database. The 2010 data for Virginia will serve as the primary source of commodity flow information to develop the model. The dataset will be based on flows that start/end in Virginia or travel through the state. The basic approach will be to determine the relationships that govern these commodity flows with respect to the corresponding industries that produce them. The modeling procedure will be similar to the 4-step approach.
Model Validation and Calibration
Model validation will focus on several validation items. These include traditional validation standards, like traffic counts, VMT, transit boardings, and matching screenline counts. They also include measures for each individual model component. Several documents will be used as references for model validation:
The overall goal for the peer review meeting from VDOT's perspective was for the peer review panel to assess the statewide model development work plan (as summarized in the previous section). At the time of the meeting, VDOT was just getting started with the data development phase of the work, and the peer review meeting was quite timely in that regard. They hoped the peer review would help them identify and evaluate the capabilities and limitations of statewide models and VDOT's own work plan.
In preparation for the peer review meeting, VDOT devised five key questions for which they wanted response from the peer review panel members, specifically those from other state agencies:
In addition to the five questions listed above, VDOT prepared several other questions of the peer review panel members.
[3] VDOT Travel Demand Modeling Policies and Procedures, 2014. http://www.virginiadot.org/projects/resources/vtm/VTM_Policy_Manual.pdf.

