
The following appendix summarizes the version of the VTrans model at the time of the peer review, along with the data sources used in the development of the model.
The following sections summarize models components from the model documentation current to the timing of the model review. The model is made up of two models, freight and passenger, which are each comprised of four primary modules that are shown in the figure below:
The trip-generation module combines TAZ-based land-use characteristics with town-based fractions of number of workers divided by number of workers cross-classifications to calculate home-based trips produced by each internal TAZ. The module then calculates trip attractions for each internal TAZ by purpose and trip-productions for the non-home-based (NHB) purpose using purpose-specific regression equations, each of which utilizes a different set of employment and/or population field(s) from the TAZ characteristics table. For example, the equation for home-based work (HBW) trips attracted is based on all of the employment fields in the TAZ characteristics table, but the equation for home-based shopping (HBSHOP) trips is based solely on the retail employment field. Truck (TRUCK) productions and attractions are calculated simply by multiplying the truck percentages from the TAZ characteristics table by the production and attraction totals for the other four trip purposes.
Productions and attractions for zones external to Vermont are calculated by first applying external TRUCK trips as the ADT for the external zones listed in the TAZ characteristics table (presumably taken from traffic counts) multiplied by the truck percentages from the TAZ characteristics table. These values are split evenly as productions and attractions. The total for other external vehicle-trips is taken as the remaining fraction of the ADT for each external zone listed in the TAZ characteristics table. The external vehicle occupancy rate (as an input) is applied to this total to derive non-TRUCK external person-trips. Total non-TRUCK external person-trips are then subdivided by the other trip purposes using the fractions in the external trip-fractions table.
Ultimately, this process outputs a table of productions and attractions for each of the five trip purposes in the model (HBW, HBO, HBSHOP, NHB, TRUCK) for each of the 936 internal and external zones. However, because the production and attraction estimates for the internal TAZs came from different sources for each of the four home-based trip purposes, they do not match. This mismatch is typical for most demand-forecasting models where separate regression models are estimated for production and attraction across a full study area with unique predictor variables. Balance factors are calculated as the ratio of trip productions destined for internal zones to the corresponding trip attractions in internal zones by trip purpose. Balancing is accomplished by zone by multiplying the balancing factors to the internal trip attractions only so that they match total productions (internal and external) by trip purpose. The end result is a table of balanced productions and attractions for each of the five trip purposes in the model for each zone. Figure D1 provides a visual summary of the trip generation process.
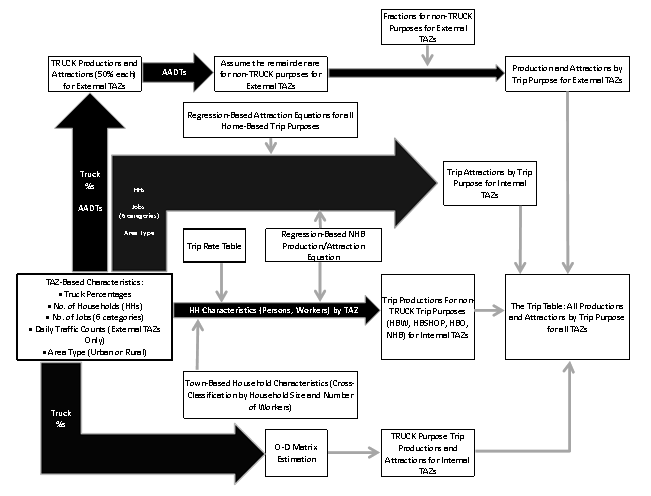
Figure D1: Trip Generation Process
The trip-distribution sub-module takes the balanced trip table, a matrix of free-flow travel times between TAZs and a set of impedance functions to develop a matrix of productions and attractions between all zones. The result of this step is a matrix of productions and attractions between all zones. The final step in the trip-distribution application is to convert this matrix into a matrix of origin-destination (O-D)-based trips. Since the model is a daily model, all trips are assumed to return, indicating that all trips originating in one zone and destined for another must also originate in the destination zone and terminate in the origin zone. This assumption requires that the final matrix be diagonally symmetric. To accomplish this, the matrix is transposed, added to the original, and then all cells are halved. The result is a diagonally-symmetric O-D matrix of person-trips. Figure D2 provides an illustration of the tip distribution process.
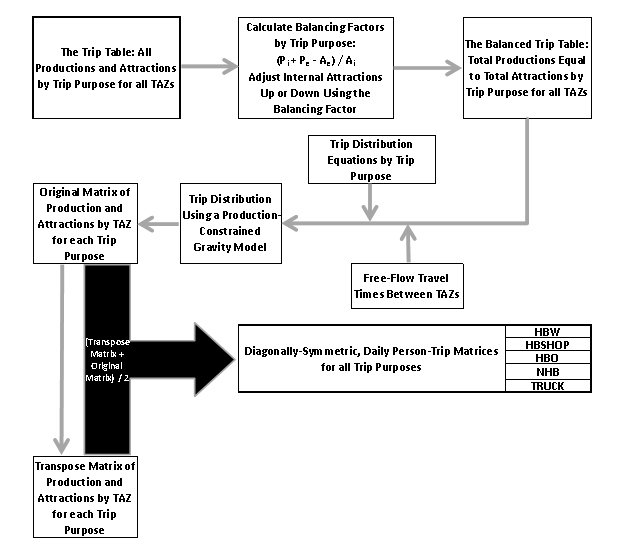
Figure D2: Trip Distribution Process
In the past, the O-D matrix of person-trips was reduced by the expected transit demand before allocating the remaining trips to passenger vehicles. However, the existing matrix of transit demand may date back as far as 1997, and no definable data source for the transit demand could be located, and the 2009 NHTS does not support the development of full O-D matrix of transit demand statewide. Therefore, transit demand is no longer considered directly in the Model. Instead, the full O-D matrices resulting from the trip-distribution step are divided by a vehicle-occupancy to convert them from person-trips to passenger vehicle-trips.
The final matrix, including all external vehicle-trips, is assigned to the road network in the traffic assignment sub-module. Free-flow travel speed on each link is assumed to be the five miles per hour over the speed limit, and the user-equilibrium traffic assignment is used.
Table D1: Comparison of the Classification of Vermont Households by Size
| No. of People in Household | NHTS | Model |
|---|---|---|
| 1 | 28% | 28% |
| 2 | 38% | 38% |
| 3 | 15% | 15% |
| 4 | 13% | |
| 5 | 5% | 19% |
| 6 | 1% |
Table D2: Comparison of the Classification of Vermont Household by Number of Workers
| No. of Workers in Household | NHTS | Model |
|---|---|---|
| 0 | 25% | 25% |
| 1 | 40% | 36% |
| 2 | 30% | 33% |
| 3 | 4% | 6% |
| 4 | 1% |
Table D3: Comparison of the Relationship Between Link Volumes and Traffic Counts
| Roadway Category | Model Result for Volume/Count | Acceptable Standard for Volume/Count |
|---|---|---|
| Freeway | -15.2% | +/- 7% |
| Divided Arterial | +1.0% | +/- 15% |
| Undivided Arterial | -13.7% | +/- 15% |
| Collector | -3.0% | +/- 25% |
The following section provides brief descriptions of the sources of data used in the model.
US Census - 2010 Population and Household Data
Bureau of Economic Analysis/Vermont Department of Labor - 2009 Employment Estimates
American Community Survey - 2006 to 2010 Number of Workers and Number of Household Members by Town
National Household Travel Survey - 2009 Household Travel Information (Person Trip Table)
Vermont Center for Geographic Information - Speed Zone Layer along Interstates and State and Federal Highways in Vermont
VTrans Project Information - Preliminary List of Major Roadway Projects whose Construction Began Prior to 2011
VTrans - 2009 Statewide Traffic Counts - Average Annual Daily Traffic (AADT)

