U.S. Department of Transportation
Federal Highway Administration
1200 New Jersey Avenue, SE
Washington, DC 20590
202-366-4000
Federal Highway Administration Research and Technology
Coordinating, Developing, and Delivering Highway Transportation Innovations
|
LTBP NEWS This newsletter is an archived publication and may contain dated technical, contact, and link information. |
|
| Publication Number: FHWA-HRT-15-050 Date: Issue 5, June 2015 |
Publication Number: FHWA-HRT-15-050 Date: Issue 5, June 2015 |

FHWA Contact: Yamayra Rodriguez-Otero, HRDI-60 LTBP Team, 202-493-3252, yamayra.rodriguez@dot.gov
By Nenad Gucunski and Hooman Parvardeh, Center of Advanced Infrastructure and Transportation, Rutgers University
On October 6 and 7, 2014, the Long-Term Bridge Performance (LTBP) Program team performed a third round of inspection of the Virginia Pilot Bridge, which had been selected for pilot testing of the LTBP Protocols. The Virginia Pilot Bridge carries U.S. Route 15 over Interstate 66 in Haymarket, VA (figure 1). NDE technologies were used to perform a detailed condition assessment of the deck with respect to corrosion, delamination, and concrete quality. This was the third assessment of this bridge deck over the last 5 years; previous assessments were performed in September 2009 and August 2011.
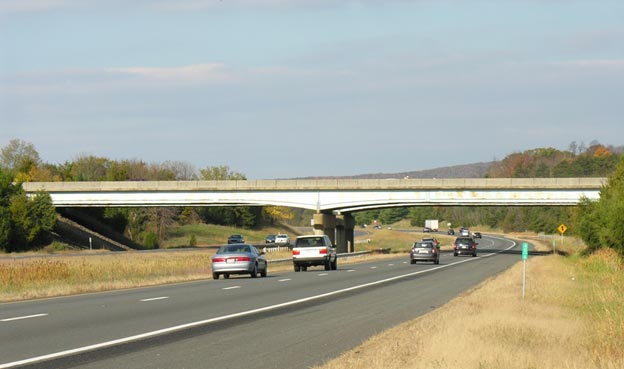
Figure 1. Photo. The Virginia Pilot Bridge carrying U.S. Route 15 over Interstate 66 in Haymarket, VA.
This two-span bridge was constructed in 1979 with a reinforced concrete deck on continuous steel girders. The bridge has a small skew and is about 275 ft long. The bridge deck has two 12-ft lanes, a 10-ft-wide right shoulder, and a 4-ft-wide left shoulder, making the total deck area about 11,000 ft2. After 35 years of service, the whole bridge is scheduled for replacement in 2015, and this assessment was a unique, last opportunity to evaluate the deck condition prior to demolition. Figure 2 clearly shows a bridge deck that has gone through numerous repairs.
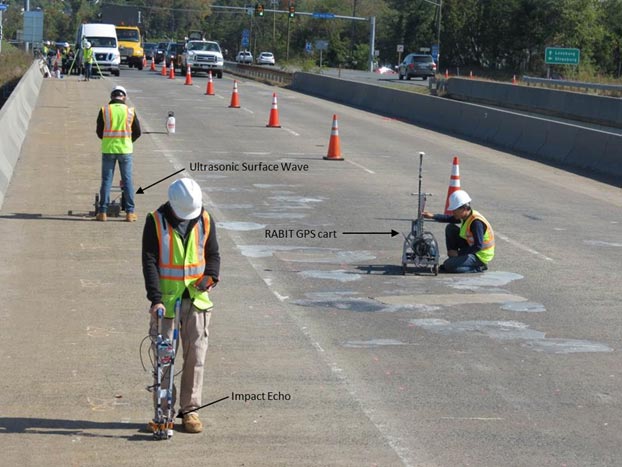
Figure 2. Photo. Data collection on the deck of the Virginia Pilot Bridge.
The following suite of five NDE technologies, identified by the LTBP Program as appropriate technologies to achieve those goals, was deployed:
The data collection (figure 2) was conducted on a 2- by 2-ft grid.
The results from three of the deployed technologies are shown herein as an example. The selected assessment results unambiguously confirmed rapid progression of deterioration during the 5-year period. The ER condition map (figure 3) describes the corrosive environment, which was becoming more aggressive and encompassing larger areas with every new measurement. The increase in the aggressiveness of the corrosive environment is directly reflected in the rate at which reinforced steel corrodes, increasing the likelihood of deck delamination and spalling.
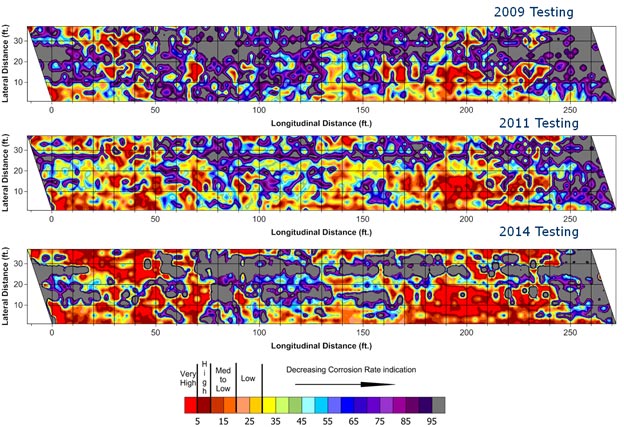
Figure 3. Contour map. Electrical resistivity condition maps from the 2009, 2011, and 2014 surveys.
The condition maps from the three GPR assessments paint a similar picture of deterioration progression (figure 4). Strong attenuation of the GPR signal in the zones plotted in hot colors (reds and yellows) is an indication of a highly corrosive environment and likely indicates the presence of cracks and delamination. The condition maps from the three IE assessments clearly show progression of delamination (figure 5). The zones in red color show delaminated areas on the bridge deck. The condition maps from the other NDE technologies further support these results in both the deterioration progression and affected areas identified.
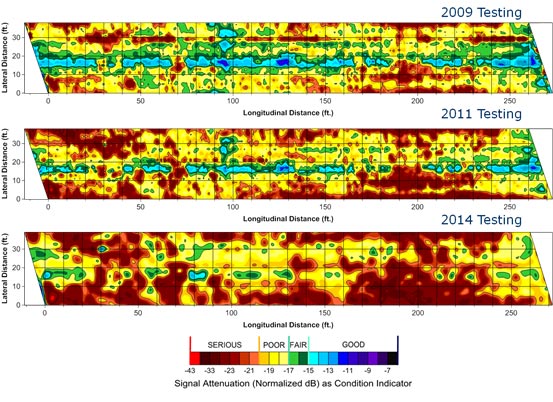
Figure 4. Contour map. GPR condition maps from the 2009, 2011, and 2014 surveys.
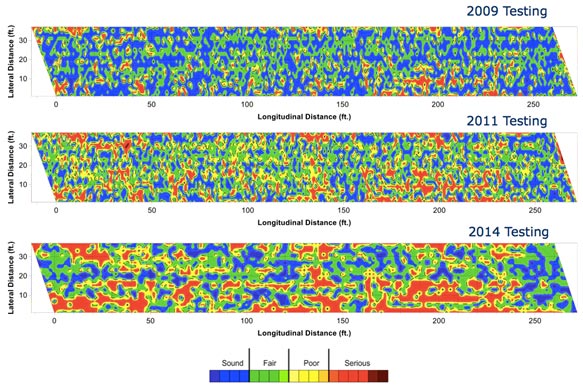
Figure 5. Contour map. IE condition maps from the 2009, 2011, and 2014 surveys.
The best illustration of the quantitative nature of NDE results is the calculated condition assessment, a weighted average of percentages of the deck area in various states of deterioration on a scale of 0 to 100. For example, delamination is calculated as an average of three assigned weight values: good or no signs of delamination (100), initial or incipient delamination (50), and fully developed delamination (0).
Figure 6 shows the color-coded result of this calculation based on data from 2009 testing. The top part shows the result based on IE, and the bottom part corresponds to HCP. The figure divides the bridge deck into different segments.
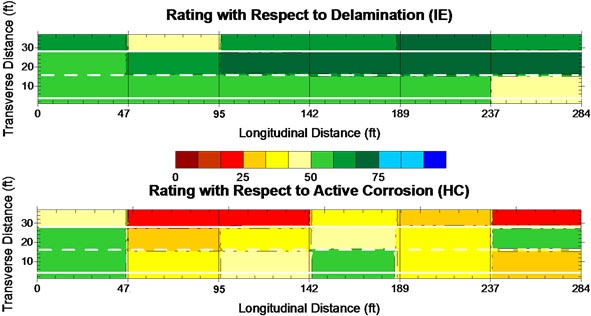
Figure 6. Illustration. Segmentation grading of the deck based on IE and HCP data from 2009.
Table 1 shows the corrosion, delamination, and concrete quality NDE condition assessment for the three surveys. The delamination condition of the assessed bridge deck dropped from 70 (2009) to 60 (2011) and then to 40 (2014), indicating a very rapid progression of deck delamination. The combined condition assessment also shows a rapid decrease in the overall condition of the deck. In contrast, the results of the visual inspections conducted during the same period do not indicate this rapid progression of deterioration. This is because NDE technologies provide information about deterioration processes and defects that typically are not visible. This ability to describe deterioration quantitatively allows for a more objective condition assessment of bridge decks and for more realistic deterioration models to better predict the service life of concrete decks and better manage them.
Table 1. NDE condition assessment of the Virginia Pilot Bridge.
| NDE Condition Assessment | 2009 | 2011 | 2014 |
| Active Corrosion | 40 | 30 | 25 |
| Delamination | 70 | 60 | 40 |
| Concrete Degradation | 50 | 35 | 25 |
| Combined NDE Assessment | 53 | 41 | 30 |
By S-K Lee, SK Lee & Associates, Inc., and Paul Virmani, FHWA
The Federal Highway Administration (FHWA) Coatings and Corrosion Laboratory at the Turner-Fairbank Highway Research Center in McLean, VA, in collaboration with the Long-Term Bridge Performance (LTBP) Program, has recently completed the laboratory portions of three research studies as described below. The reports will be available in 2015.
Comparative Rebar Study for Corrosion Protection of Reinforced Concrete (RC) Bridges
This study investigated the performance of various alloyed and cladded reinforcing steel (rebar) by repeated application of deicers in the laboratory using accelerated test methods. The following rebar materials were evaluated: epoxy-coated rebar, dual-coated rebar, hot dip galvanized, high-strength microcomposite bar, two stainless steel clad bars in accordance with American Association of State and Highway Transportation Officials Material Property 13, two low-grade stainless steel bars in accordance with the unified numbering system (UNS) S41003, and three solid stainless steel bars (UNS 32101, UNS S32304, and UNS S24100), with black steel reinforcement as the control.
Eight large RC slabs (1.5 ft by 8 ft by 5.5 inches) were constructed with the above rebar materials in the top mat and black reinforcement in the bottom mat. All slabs were constructed using concrete with an intentionally high water-to-cement ratio of 0.66 to facilitate the rapid ingression of chlorides. For approximately 18 months, each slab was exposed to a weekly cycle of 3 days of wetting with 15 percent by weight of sodium chloride solution and 4 days of drying at 100°F. Corrosion progression of the embedded rebar was monitored weekly with various NDE tools to measure corrosion potential, rate of corrosion, macro cell currents, and concrete resistance between top and bottom mats. At the end of the exposure period, 279 cores were extracted from 8 slabs. All the cores have been analyzed for chloride ions, and the condition of the extracted rebar will be correlated with NDE data along with the chloride content at rebar level. This detailed analysis, along with visual condition of the extracted rebar, will form the basis for conclusions regarding the corrosion performance of each type of rebar material and their cost effectiveness. A report will be available in 2015.
Corrosion Evaluation of Post-Tensioned (PT) Strand and Cable Stayed by NDE Techniques
This study investigated the viability of various NDE techniques in evaluating the level of corrosion damage of high-strength prestressing strands and wires embedded in grout and encased in polyethylene and metallic ducts. The findings of this research will help improve the state-of-the-practice inspection of PT strands, cable stays, and suspension cables.
To simulate corrosion damage in PT tendons, duct specimens were deliberately fabricated with voided grout sections, uneven grout cover, and varying degrees of strand defects (section loss). PT tendon specimens were also obtained from the Varina-Enon Bridge in Virginia and the Hale Boggs Memorial Bridge, a cable-stayed bridge in Louisiana, for inspection and evaluation in the laboratory.
The study employed a number of NDE techniques to evaluate the current condition of the strands and wires, including ultrasonic and sonic echo/impulse response method, magnetostrictive sensor guided wave test, microwave thermoreflectometry, remnant magnetization method, and magnetic main flux method (MMFM). In laboratory assessments, the MMFM provided better correlation with the known defects, and the MMFM technique was employed to evaluate corrosion issues on two bridges.
In addition, autopsies on three of the Hale Boggs Memorial Bridge cable samples were performed to verify the MMFM NDE data with actual wire condition.
Results from this study are expected in 2015.
Corrosion Resistance of Metallic Dowel Bars
The third study evaluated the corrosion resistance performance of eight different types of metallic dowel bar materials. Dowel types studied included epoxy-coated; hot-dip galvanized; zinc clad; solid stainless steel; and stainless steel clad types A, B, and C. Black steel (uncoated) served as the control. Seven small concrete slabs (15 by 36 by 5.5 inches) were constructed with a prefabricated transverse crack (to simulate a joint) for each of the dowel types. The slabs were ponded with 15 percent by weight of sodium chloride solution and subjected to weekly wetting and drying cycles over 450 days to accelerate corrosion of the embedded dowel bars.
Data was obtained by NDE techniques—including macro-cell current, half-cell potential, rate of corrosion, and concrete resistance—prior to conducting autopsies of the slabs. Analysis of the NDE data and autopsy findings is currently underway to correlate the condition of each dowel material/bar with the measured chloride content to predict the expected service life, cost effectiveness, and relative corrosion performance of the various metallic dowel bars.
Results from this third study are expected in 2015.
By Susan Lane, FHWA
Onsite Bridge Data Collection and Analysis in the Mid-Atlantic and Northeast States
A new LTBP research contract with Professional Service Industries, Inc., will collect bridge data and analyze it for the Mid-Atlantic and Northeast States. The objective of the task order contract is to support the FHWA LTBP Program by collecting bridge legacy data, including plans, specifications, construction, inspection, maintenance, and cost data for reference and cluster bridges in these regions of the country.
Bridge legacy data will be collected for more than 500 prestressed concrete girder, steel girder, and prestressed concrete box girder bridges in Connecticut, Delaware, Maine, Maryland, Massachusetts, New Hampshire, New Jersey, New York, Ohio, Pennsylvania, Rhode Island, Vermont, Virginia, and West Virginia. The data items collected on these bridges will then be analyzed to identify any correlations with bridge performance.
Onsite Bridge Data Collection Beginning in the Gulf Coast States
On-site bridge data collection is beginning in the Gulf Coast States as a result of a new research contract with Michael Baker, Jr., Inc. The objective of the contract is to support the FHWA LTBP Program by collecting visual inspection and physical/material sampling data for reference and cluster bridges in the Gulf region of the United States, following specific LTBP Program data collection protocols.
Data will be collected for 24 steel girder bridges and prestressed concrete girder bridges in Alabama, Arkansas, Florida, Louisiana, Mississippi, and Texas. Bridges were selected in partnership with each State.
Onsite Bridge Data Collection Beginning in the Northwest and Southwest States
LTBP data collection efforts are beginning in the Northwest and Southwest States as a result of a new research contract with Parsons Brinckerhoff, Inc. The objective of the contract is to support the FHWA LTBP Program by collecting visual inspection data for reference and cluster bridges in the Northwest and Southwest region of the United States, following specific LTBP data collection protocols.
Data will be collected for 12 prestressed concrete girder bridges in Oregon and Washington. Data will also be collected for 12 prestressed concrete box girder bridges in California, Arizona, and Nevada. Bridges were selected in partnership with each State.
Yamayra Rodriguez-Otero recently joined FHWA as the Development and Outreach Engineer of the LTBP Program (figure 7).
Prior to her current role, Ms. Rodriguez-Otero was part of the FHWA Professional Development Program (PDP) in the Structural Engineering discipline in the FHWA New Mexico Division. She completed various bridge-related assignments while going through the FHWA PDP, including a bridge design assignment with the New Mexico Department of Transportation, a bridge construction assignment in Wyoming with the FHWA Central Federal Lands Highway Division, and an assignment with the FHWA Florida Division in Tallahassee and Orlando.
Prior to joining the FHWA PDP, Ms. Rodriguez-Otero worked in the Student Career Experience Program with the FHWA Puerto Rico Division for 11 months. Ms. Rodriguez-Otero received her bachelor’s and master’s degrees in civil engineering from the Polytechnic University of Puerto Rico.

Figure 7. Photo. Yamayra Rodriguez-Otero.
Dr. Hoda Azari recently joined FHWA as the NDE Research Program Manager (figure 8). Her background is in structural engineering, and her expertise is in the area of NDE and structural health monitoring of transportation infrastructure. She received her doctoral degree from the University of Texas at El Paso. During her Ph.D. studies, she was the lead research assistant on several research projects funded by Second Strategic Highway Research Program, Federal Railroad Administration, Texas Department of Transportation, and Electrical Power Research Institute.
Dr. Azari has done extensive research studies for condition assessment and damage detection of transportation infrastructure and performed forensic investigation services for State transportation departments. She has authored and co-authored more than 20 technical papers and reports.
Dr. Azari serves on the Transportation Research Board (TRB) AFF40 Field Testing and Nondestructive Evaluation of Transportation Structures, TRB AHD30 Structure Maintenance, and American Society of Civil Engineers Geophysical Engineering Committees. She has given graduate seminars regarding the role of NDE technologies in transportation infrastructure at several universities.

Figure 8. Photo. Dr. Hoda Azari.
By Jennifer Nicks, FHWA
At the LTBP Workshop to Identify Bridge Substructure Performance Issues, bridge/geotechnical experts from State transportation departments, FHWA, academia, and industry groups came to a consensus that the bump at the end of the bridge is one of the leading geotechnical bridge performance issues. The bump, defined as differential settlement between the approach slab and the bridge resulting in an abrupt change of elevation or slope, has long been studied yet still remains a problem.
The bump is not just an annoyance to the traveling public; the dynamic impact of vehicles after they travel over the bump can cause distress, fatigue, and long-term deterioration of the bridge deck. Furthermore, the bump can also cause damage to the vehicles and potentially create an unsafe condition for drivers if this issue is not mitigated in a timely manner. To ensure the bump is within tolerable limits based on safety, ride ability, and effects to long-term bridge performance, transportation agencies need a tool that can quickly assess the bridge approach transition.
Previous research and current solutions primarily focus on foundation selection, design details, and construction controls to alleviate or mitigate the bump. Examples include using integrated bridge systems with geosynthetic reinforced soil, integral (jointless) abutments, approach slabs/drag plates, drainage details, stringent backfill material and compaction requirements, and ground improvement treatments. However, the effect of these solutions on holistic bridge performance is not fully understood, and there has been no concerted effort to establish a performance measure—until recently.
An increased focus on geotechnical performance management inspired FHWA’s Geotechnical Research Program to partner with the Long-Term Pavement Performance (LTPP) team to quantify the bump at various bridge sites using inertial profilers. Inertial profilers are systems mounted to the front of a vehicle that are equipped with laser height sensors and corresponding accelerometers to collect data, compute the longitudinal profile along each wheel path, and determine the roughness of the road surface (figure 9). Longitudinal distance is measured using an instrument mounted to the rear wheel of the vehicle (figure 9); Global Positioning System receivers are also located on the vehicle to map position. Using a data acquisition system, the vehicle is able to collect data at a speed of 50 mi/h as it is driven along the road. More information about inertial profilers can be found in the 2013 LTPP Manual for Profile Measurements and Processing.
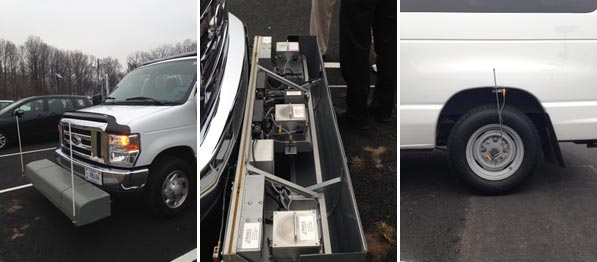
Figure 9. Photo. Inertial profilometer vehicle (left), sensor bar with
cover open (center), and distance measurement instrument (right).
Traditionally, inertial profilers have been used to track pavement assets, but FHWA had not tested bridges using the technology. A pilot study was therefore initiated to develop a draft protocol that outlines the procedures for measuring the profile of bridge approaches. The protocol was then tested at a few bridge sites. The results provide a road profile for different wheel paths in two different directions, with demarcations noted for the bridge ends (figure 10). Focusing at the bridge approaches from this site, the profiler can clearly distinguish the transition (figure 11). Further data processing to correct for grade will allow engineers to quantify the bump at the end of the bridge. This quantification can be used in conjunction with other bridge performance data to better define tolerable service limits.
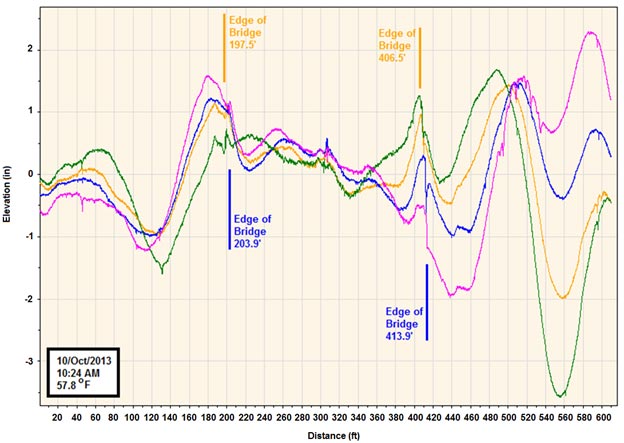
Figure 10. Graph. Measured bridge and approach profiles with bridge locations marked.
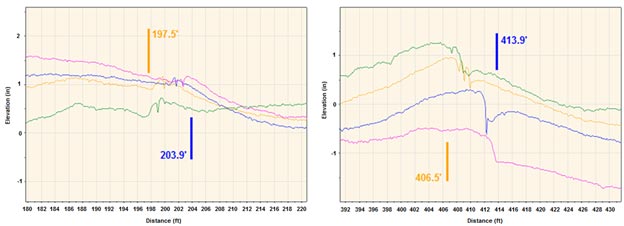
Figure 11. Graph. Bridge transition profiles with bridge end locations marked.
Additional testing across a wide variety of bridges, including the Every Day Counts Geosynthetic Reinforced Soil Integrated Bridge Systems and the LTBP bridges, will help correlate the bump with long-term bridge performance and develop a performance measure based on the inertial profiler. The tool can then ultimately be used to further help transportation agencies manage and preserve their bridge inventory.
DeWayne Wilson, Washington State Department of Transportation
This article is reproduced from Issue 75 (Mar/Apr 2014) of Concrete Bridge Views with permission from the Washington State Department of Transportation and National Concrete Bridge Council.
Background
WSDOT has a comprehensive Bridge Deck Program with the primary goal of economically repairing and overlaying concrete bridge decks to prolong their lifespan and avoid expensive deck replacements (sustainability). WSDOT manages 3,109 vehicular bridges over 20 feet in length as part of the state highway system. The majority of these bridges have reinforced concrete decks.
The use of salt in winter deicing practices causes premature deterioration in many concrete bridge decks through corrosion of the reinforcing steel. Once the rebars start to corrode they cause the concrete to spall and deteriorate. Each summer WSDOT Regional Maintenance crews repair any of these spalled areas. These repairs are considered to be temporary and typically last 1-3 years. Once the total areas of repairs and / or patching exceed 2% of the total deck area then the bridge is added to the list of future needs for adding an overlay. When funding becomes available then a contract is developed and advertised for a contractor to perform deck repairs and add a protective overlay (normally a 1.5” thick modified concrete).
WSDOT Modified Concrete overlay types
WSDOT has developed five separate modified concrete overlay mix designs for deck rehabilitation, two of which has been discontinued. The mix designs consist of either Latex or Microsilica (silica fume) or Fly-ash (42 hour cure time). WSDOT also installed a few rapid-set Latex Modified Concrete (LMC) overlays (4 hour cure) but their use has been discontinued. The following modified concrete mix designs provide over 5,000 psi compressive strength and a permeability value of less than 1,000 coulombs:
WSDOT Modified Concrete overlay types
The overlay process begins by setting up traffic control and closing all or part of a bridge. The amount of time a contractor can have to do the project is a very important issue with more emphasis being made toward rapid construction. WSDOT requires a contractor to use a hydromilling machine with at least 7,000psi of water pressure to remove ½” of good concrete and any previous patches. The removal of the top ½” of concrete also removes a high percentage of the salt in the bridge deck. The contractor must do a trial on a portion of the deck with good concrete and then use the hydromill setting for the good concrete on the rest of the bridge. These settings will remove concrete in poor condition up to several inches. The contractor has to properly contain and dispose of the waste water used during the hydromill process. The next step is to fill repair areas below the top mat of reinforcing steel with a standard 4,000 psi concrete (WSDOT does not allow fast curing patching materials). These areas have to be cured for about 24 hours to achieve the strength desired of 2500 psi prior to applying the modified concrete overlay.
The construction process is nearly the same for any of the modified concrete overlay types. The main difference is that LMC is mixed and delivered to the bridge deck with a mobile mixing truck verses MMC and FMC that are mixed at a r plant and then delivered to the site in a ready mix truck. After a hydromill is used to remove ½” of the existing concrete and prepare the surface the contractor uses a finishing machine to place the concrete overlay and to ensure a uniform placement for the desired 1.5 inch thickness. The temperature of the existing bridge deck must be more than 45 degrees and less than 75 degrees prior to placement. WSDOT also sets a criteria for the evaporation rate at the time of placement. The modified concrete overlay is wet cured under burlap for a minimum of 42 hours. The overlay is then checked for strength per ASTM C805, and if the concrete is above 3,000psi then the contractor can remove the curing blankets and open the bridge deck to traffic. More details on the WSDOT modified concrete overlay specifications are available in section 6-09 of the WSDOT 2014 Standard Specifications for Road, Bridge, and Municipal Construction.
Concrete overlay service life
Modified Concrete Overlays are a very effective part of WSDOT’s bridge deck preservation strategies as evident by how few number of total deck replacements have been necessary (only 14 bridges to date). There are 165 bridges with modified concrete overlays that have provided more than 25 years of service. WSDOT has replaced 13 modified concrete overlays to date (0.8 million sq. ft.) and has identified another 30 (1.1 million sq. ft.) that will need to be replaced over the next 8-10 years.
Further Information
For further information about this article, contact the author at wilsond@wsdot.wa.gov.
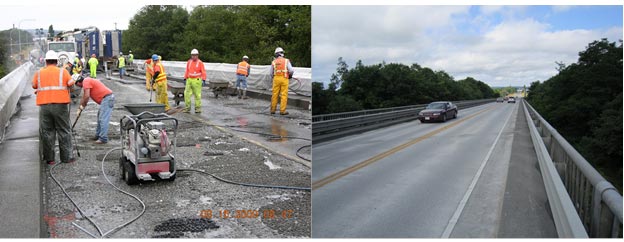
Figure 1. Photo. SR532 near Stanwood, WA during construction.
New Publications: Long-Term Bridge Performance High Priority Bridge Performance Issues Report and Executive Summary
Two new FHWA publications, the Long-Term Bridge Performance High Priority Bridge Performance Issues Report and associated executive summary (known as a TechBrief), are now available. The report (publication no. FHWA-HRT-14-052) can be found online: https://www.fhwa.dot.gov/publications/research/infrastructure/structures/ltbp/14052/index.cfm. The report documents the process used in the LTBP Program for identifying high-priority bridge performance issues.
The TechBrief (publication no. FHWA-HRT-14-043) can be found online: https://www.fhwa.dot.gov/publications/research/infrastructure/structures/ltbp/14043/14043.pdf.
For more information, visit the LTBP website: www.fhwa.dot.gov/research/tfhrc/programs/infrastructure/structures/ltbp/
 |
To join the LTBP mailing list or for more information, contact us at ltbp@dot.gov. Hamid Ghasemi, Ph.D., LTBP Program Manager Turner-Fairbank Highway Research Center 6300 Georgetown Pike McLean, VA 22101 |
 |