U.S. Department of Transportation
Federal Highway Administration
1200 New Jersey Avenue, SE
Washington, DC 20590
202-366-4000
Federal Highway Administration Research and Technology
Coordinating, Developing, and Delivering Highway Transportation Innovations
|
LTBP NEWS This newsletter is an archived publication and may contain dated technical, contact, and link information. |
|
| Publication Number: FHWA-HRT-15-073 Date: Volume 6, September 2016 |
Publication Number: FHWA-HRT-15-073 Date: Volume 6, September 2016 |

FHWA Contact: Yamayra Rodriguez-Otero, HRDI-50 LTBP Team, 202-493-3252, yamayra.rodriguez@dot.gov
By Hoda Azari, Federal Highway Administration (FHWA)
Ground penetrating radar (GPR) is a geophysical nondestructive technique that uses electromagnetic pulses to test, characterize, or detect subsurface anomalies based on changes in electrical conductivity (inverse of resistivity) and relative dielectric properties of the subsurface layers. Traditional GPR systems use electromagnetic pulses of varying duration emitted by an antenna. The GPR system records signals representing electromagnetic waves reflected from interfaces and embedded objects and can analyze and present them in terms of their amplitude, time, and frequency distributions.
As the GPR system travels along the concrete bridge deck, it generates a sequence of waveforms that can be viewed together as an image called a B-scan or line scan (figure 1). These waveforms are digitized and interpreted by computing the amplitude as a function of arrival time. The interpreted waveforms can then be used to identify interfaces and objects within the material, determine the location or depth of these interfaces and buried objects, and determine the properties of material affected by dielectric properties.
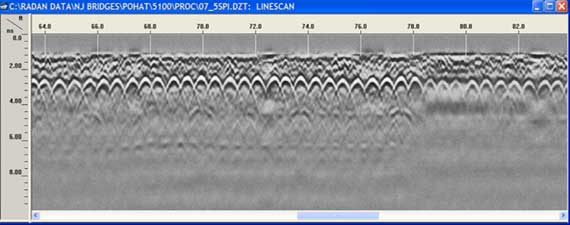
Figure 1. Contour map. Typical GPR line scan.
GPR systems have ground-coupled (figure 2) or air-coupled (figure 3) antennas. Ground-coupled antennas provide data with a higher signal-noise ratio and higher vertical and horizontal resolution. However, its survey speeds are typically limited to 5 mi/h. Air-coupled antennas, on the other hand, have a higher testing speed (up to 65 mi/h) that requires minimal traffic control and covers a larger testing area in a relatively short period of time, but the data produced by air-coupled antennas have lower resolution. In specifying a GPR system for a job, different parameters—including cost, application, and speed—should be considered. The depth of penetration for GPR is dependent on the electrical conductivity of the material being inspected, the frequency output capability of the antenna, and the amount of power being applied. Higher conductivity within the inspected material results in lower penetration depths, which is due to loss of electromagnetic energy that results from heat loss in the material being inspected. While higher frequencies provide better resolution, they also result in a lower depth of penetration of the wave. GPR can be used for a wide range of applications, including but not limited to identifying and mapping areas with a high likelihood of corrosion-based deterioration, locating utilities and other subsurface materials, verifying construction quality, determining unknown structural reinforcement layout, and accurately measuring or estimating thickness of the deck, overlays, or reinforcement cover.
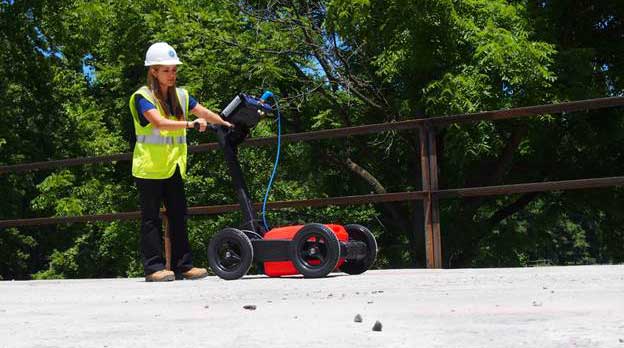
Figure 2. Photo. Data collection on a bridge deck using ground-coupled GPR.
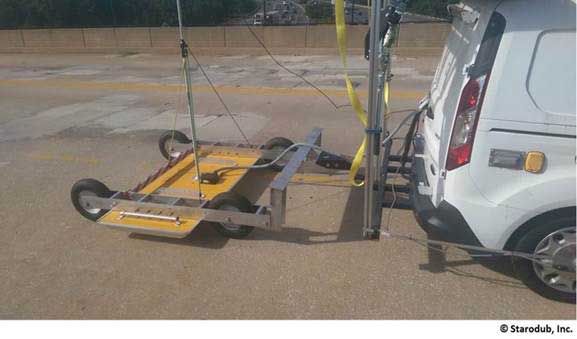
Figure 3. Photo. Data collection on a bridge deck using air-coupled GPR.
The analysis of a GPR survey focuses on determining the signal attenuation caused by rebar reflection. Rebar corrosion and/or section loss, concrete degradation, or the presence of chlorides, salts, and moisture will commonly increase concrete electrical conductivity and dielectric constant, leading to increased signal attenuation. Therefore, the amplitude of reflection from the reflectors in a bridge deck, like rebars, will be highest when the concrete bridge deck is in good condition and lowest when it is deteriorated. Measured signals are then normalized with respect to amplitude of rebar reflections at the least deteriorated or most sound deck locations and corrected for variations due to the rebar cover depth. The variation of rebar cover depth can be due to an actual variation in depth of rebar or changes in the quality of the concrete. A higher value of rebar cover depth is a possible indication of probable deterioration.
The depth-correction analysis is required to correct for attenuation caused by the geometry of wave propagation. After the depth correction analysis is performed, the remaining areas with low amplitudes are considered deteriorated with a higher level of confidence. By creating a contour plot of the signal attenuation of a bridge deck survey, bridge owners can identify areas of probable damage and gain greater understanding of the degree or severity of the deterioration, which can help them make data-driven decisions regarding maintenance, preservation, or rehabilitation.
Figure 4, figure 5, and figure 6 present rebar cover and condition assessment maps of a bridge deck evaluated with GPR ground-coupled antenna as part of the FHWA LTBP Program. Figure 4 depicts the variation of reflected amplitude at the rebar level. The areas with low amplitude indicate the presence of probable deterioration. A contour map of the rebar cover depth is presented in figure 5. The variation of corrected normalized reflected amplitude is shown in figure 6. By conducting the depth-correction analysis, some areas with low amplitude values are removed. The remaining areas with low amplitudes represent areas of severe deterioration. The GPR condition assessment results are validated by extracted cores or ground truths or through comparisons with results from other NDE technologies.
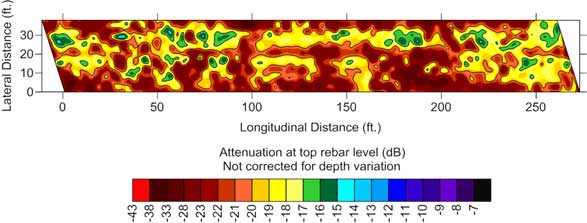
Figure 4. Contour map. GPR condition assessment maps, top rebar amplitude (normalized dB)—not depth corrected.
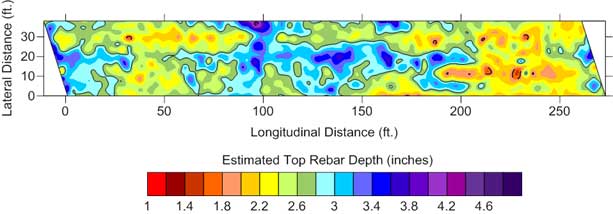
Figure 5. Contour map. GPR condition assessment maps, rebar cover (inches).
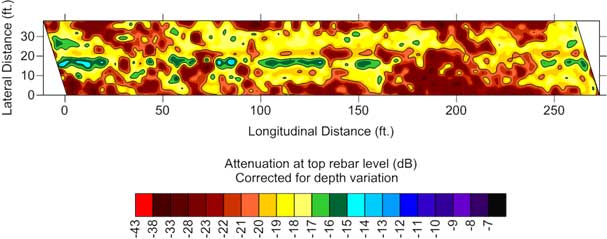
Figure 6. Contour map. GPR condition assessment maps, top rebar amplitude (normalized dB)—depth corrected.
By Hoda Azari, FHWA
The NDE Web Manual is an interactive Web resource that provides concise information about common NDE technologies and assessment tools. NDE can be used to locate, identify, and measure flaws, deterioration, or damage in bridge components that generally cannot be seen during visual inspection.
While several independent product Web sites and generic online guidelines already exist, the “Find Technology” feature in the NDE Web Manual takes that information one step further. It provides unbiased recommendations on the best technologies available to detect and characterize a specific problem or concern.
FHWA developed the NDE Web Manual to fill a critical knowledge gap between highway infrastructure practitioners dealing with performance challenges on a daily basis and researchers developing and refining NDE technologies to support that effort.
Over the last decade, the market has exploded with an abundance of new NDE assessment tools. Unfortunately, accurate, comprehensive documentation that should accompany these new products is not nearly as abundant and rarely includes actual performance data.
The NDE Web Manual’s simple interface allows users to select the type of highway infrastructure (i.e., bridge, pavement, or tunnel), material, structural element, and target of investigation. After selecting these variables, the online tool generates a list of recommended assessment technologies best suited for that particular set of parameters.
From that list, users can choose a technology and learn more about its physical principles, applications, advantages, limitations, best practices, and procedures. The NDE Web Manual offers illustrative photos and diagrams. Users can generate a printer-friendly report of this information with the click of a button.
As an alternative to selecting the type of highway infrastructure, the tool allows users to pick a target of investigation and learn about it and the best technologies for assessing it.
Currently, the NDE Web Manual only covers applications associated with highway bridge assessment. Research conducted under the Second Strategic Highway Research Program (SHRP2) was incorporated, and work is underway to develop content relating to NDE for pavement and tunnels.
The NDE Web Manual also provides a glossary of terms and a list of acronyms and abbreviations commonly used in highway infrastructure NDE.
The NDE Web Manual’s content has been under development for several years. As technologies and materials evolve and change, so will this online resource, offering users the most up-to-date information possible.
The NDE Web Manual is a product of the FHWA Advanced Sensing Technology (FAST) NDE Laboratory at Turner-Fairbank Highway Research Center. The information in this manual was developed and reviewed by experts in the field. Every effort was made to ensure that the information presented is accurate, adequately detailed, and technically sound—with the benefit of making the information easily accessible to users.
The use of NDE technologies for condition assessment of highways, bridges, and other infrastructure assets is increasing. This can be attributed to the fact that NDE technologies have proven effective in quality control and quality assurance of new construction and in condition assessment of existing structures.
The effectiveness and success of NDE has resulted in an upsurge of new products, but not a comparable proliferation of clear and thorough reference material on how and when to use them.
The NDE Web Manual will help practitioners and end users cut through the clutter and select the proper NDE tools to assess the condition of their highway assets.
The NDE Web Manual’s simple interface allows users to select the type of highway infrastructure, material, structural element, and target of investigation and generates recommendations for the best suited assessment technologies.
From these recommendations, users can choose a technology and learn more about its physical principles, applications, advantages, and limitations—plus best practices and procedures, complete with illustrative photos and diagrams.
Figure 7 is a screen capture of the NDE Web Manual homepage. The home page contains information about the motivation for creating the NDE Web Manual, an overview, a shortcut to navigate the manual, and acknowledgments. Figure 8 is a screen capture of the NDE Web Manual “Technology Locator” page, and figure 9 is a screen capture of an NDE Web Manual page giving further information about the selected technology, in this case, Ultrasonic Surface Waves technology. All the technology pages contain the following nine sections: application, description, physical principle, data acquisition, data processing, data interpretation, advantages, limitations, and references.
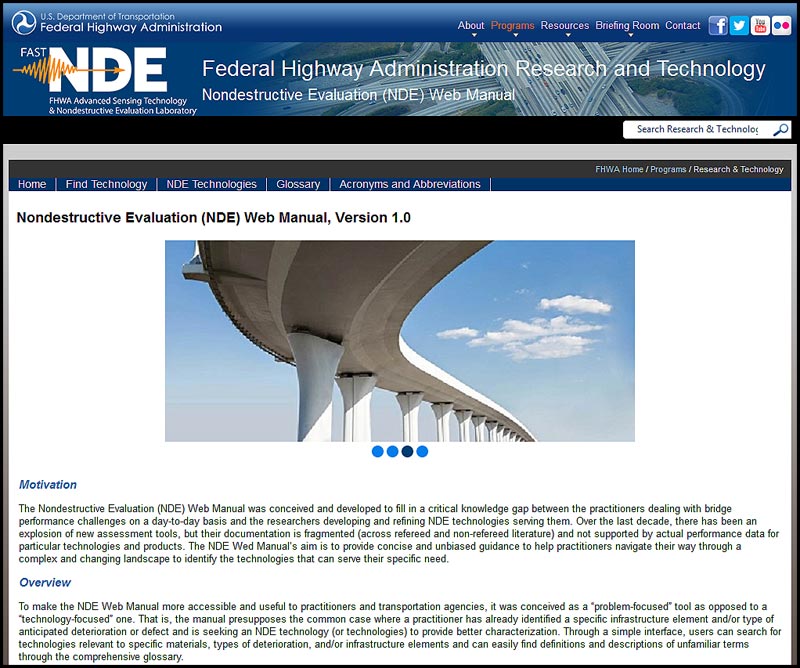
Figure 7. Screen capture. NDE Web Manual homepage.
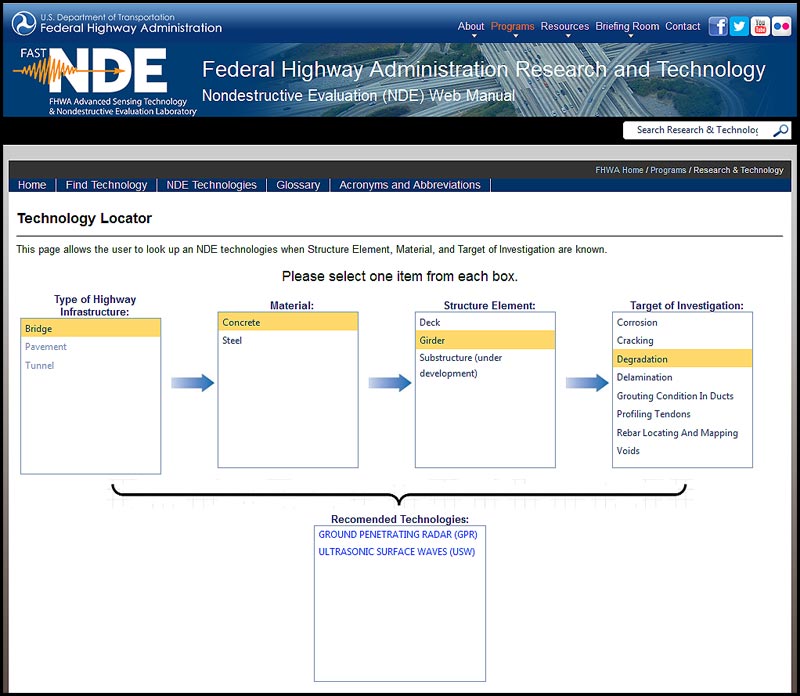
Figure 8. Screen capture. NDE Web Manual “Technology Locator” page.
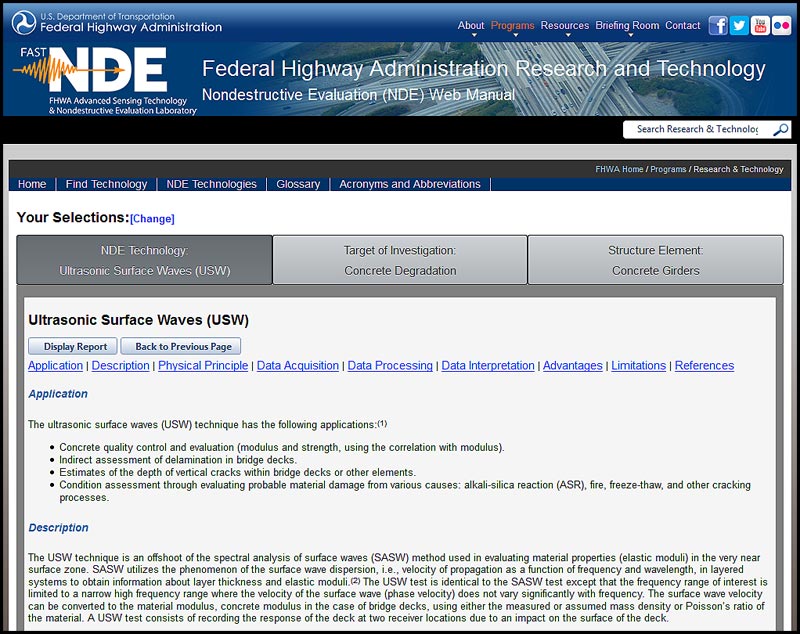
Figure 9. Screen capture. NDE Web Manual page giving further information on Ultrasonic Surface Waves technology.
The NDE Web Manual can be access through the following link: https://fhwaapps.fhwa.dot.gov/ndep/.
For more information about this the NDE Web Manual, please contact Hoda Azari at hoda.azari@dot.gov.
By Hamid Ghasemi, FHWA
Given the large and diverse population of bridges throughout the United States, one of the most significant challenges to the LTBP Program is the selection of a sample of bridges that is large and diverse enough to be representative and small enough to permit data collection efforts within current resource constraints. To meet this challenge, a multitiered sampling approach was designed. As a first step, the program concentrated on a few common bridge types that predominate and are increasingly likely to do so in the future. Specifically, the program focused on the performance of steel multigirder, prestressed concrete multigirder, and concrete box bridges (which are composed of both prestressed adjacent box beam bridges and case-in-place post-tensioned box girders) because they represent a large majority of the existing bridge inventory and continue to be the most commonly constructed bridge types in the United States.
The second step was to identify representative clusters of each primary bridge type within various regions of the United States to allow for: (1) the influences of climate/environmental conditions and regional/State maintenance practices on bridge performance to be assessed; and (2) cost-effectiveness implementation by structuring data collection efforts into concentrated geographic areas. To achieve this clustering, both the climate zones (as defined by the U.S. Department of Energy) and the density of the various primary bridge types were examined. In addition to these geographic clusters, the program also identified a few corridor samples in which the selected bridges were not constrained to be of the same type but constrained to all carry the same major interstate. In all, 14 geographic clusters (figure 10) and 10 corridors (figure 11) were identified. The ten corridors are as follows:
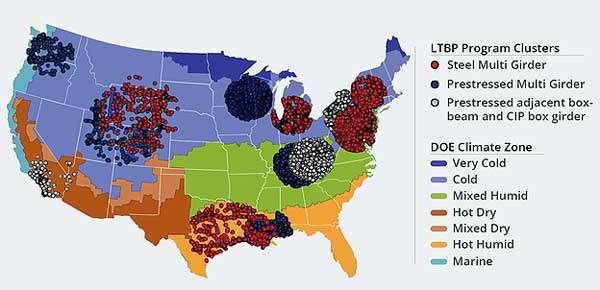
Figure 10. Map. Fourteen clusters identified by the LTBP Program for data collection.
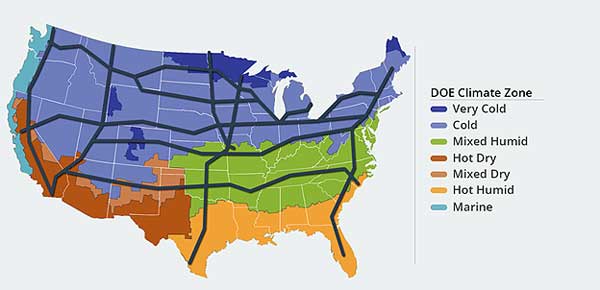
Figure 11. Map. Interstate corridors included in the LTBP Program.
The next step in the bridge selection process was to determine the detail and resolution of data collection efforts for each bridge within geographic clusters and corridors. It is important to recognize that carrying out the most detailed nondestructive evaluation (NDE), structural characterization through field instrumentation, material sampling, visual inspection, etc., for each bridge identified (which number in the thousands) is neither realistic nor cost effective. As a result, the bridges within the geographic clusters and corridors were separated into the following three categories, which defined the resolution and detail associated with the data collection efforts:
The goal of this general framework is to allow the influences of various bridge inputs and attributes on the performance of bridges to be uncoupled and better understood. For example, by comparing the results of geographic clusters/corridors, the influence of climate and environmental conditions may be identified. Within each geographic cluster/corridor, the influence of more detailed attributes (e.g., deck cover, span length, age, skew, and girder spacing) and inputs (e.g., ADT, ADTT, maintenance activities, and winter deicing operations) can be studied and identified. In addition, it is envisioned that this framework will be flexible with the possibility of bridges being moved within the various categories if their performances warrant.
By Haotian Liu, Center for Advanced Infrastructure and Transportation at Rutgers University, and Robert S. Zobel, FHWA
Bridge deterioration models are an important component in decisionmaking with respect to allocation of current and future funding for maintenance and repair (M&R) of bridges. A primary drawback to the current in-service deterioration modeling approach is that it is not data-driven and can result in inaccurate deterioration forecasts. The Long Term Bridge Performance (LTBP) Program endeavors to improve deterioration forecasting by developing a data-driven approach to deterioration modeling that uses both legacy data and field data collected through LTBP Program efforts. The LTBP deterioration-learning algorithm is both data-driven and extremely flexible.
The traditional approach of deterioration modeling first requires the users to select a model functional form (MFF), a mathematical relationship that describes how bridge condition changes with respect to concerned deterioration variables (such as traffic and environmental exposure). The users then fit data to the MFF and obtain its estimate—the estimated deterioration model, which is subsequently used for M&R decisionmaking. This approach has the following inherent issues:
The LTBP deterioration-learning algorithm improves on the traditional approach first by expanding the choices of MFF. Instead of a single MFF, the LTBP learning algorithm allows multiple MFFs, thereby allowing the learning process to “choose” the MFF or combination of MFFs that actually agree with the data. The ability to propose multiple MFFs allows the flexibly to incorporate different opinions. When multiple MFFs are used, each MFF is assigned an initial weight (sum of all weights adds to 100 percent). The individual weights assigned to a particular MFF represent the likelihood of a specific MFF agreeing with the input data. Through the learning process, the individual weights are updated with each new round of data points.
Based how closely a batch of bridge condition data agrees with a particular MFF, the modeling approach assigns an agreement score (AS) for each MFF; a high AS means that the corresponding MFF agrees well with the batch of bridge condition data, and the opposite is true of a low AS. The individual weighting factors are then updated using the AS incorporated into a statistically based approach. Through this learning/updating approach an MFF that agrees with data (having a high AS) should gain weights, and those with a lower AS should lose weight. The updating process can be executed for any batch of condition data (e.g., a biennial inspection of bridges) and can utilize a wide variety of data including but not limited to NDE, material sampling, load testing, National Bridge Inventory condition ratings, and environmental factors to name a few.
As new MFFs are developed, these can be incorporated into an existing model at any time. A new or scaled set of weights can be introduced with the new MFF, and the learning algorithm assesses the data fit using all MFFs including any that have been added. In addition, if an MFF is not contributing to the overall model agreement, it can be removed at any time, the remaining weights adjusted, and the learning algorithm employed.
This deterioration modeling approach proposed by the LTBP Program not only provides the user with tremendous flexibility but also will improve forecasting accuracy through a truly data-driven approach.
This data-driven deterioration modeling methodology will be deployed within the next version of the LTBP Bridge Portal, expected in June 2017. The LTBP Bridge Portal is a centralized, national-level repository for efficiently and quickly accessing and querying bridge performance-related data, information, and data analysis tools. It was developed to provide storage, retrieval, dissemination, analysis, and visualization of data collected through LTBP Program efforts and to provide users with the ability to holistically assess bridge performance on a network or individual project basis. Version 1 of the Bridge Portal was deployed in October 2015 and includes the following:
Future development of the Bridge Portal will incorporate truly data-driven tools to include both advanced deterioration modeling and forecasting as well as cost analysis, all based on both historical and field-collected LTBP Program data.
For more information about this deterioration modeling algorithm, please contact Robert Zobel at robert.zobel@dot.gov.
Bruce Johnson, State Bridge Engineer, Oregon Department of Transportation (ODOT)
At the LTBP Program Workshop conducted during the 2015 Transportation Research Board (TRB) Annual Meeting, Bruce Johnson (figure 12) was recognized for his longtime commitment, contributions, and support of the LTBP Program, including serving as the chair for the LTBP Program State Coordinators.
Mr. Johnson earned his B.S. in engineering from California Polytechnic State University and then an M.S. in structural engineering at Iowa State University. After working for 30 years with FHWA in the Nevada, Indiana, Iowa, and Oregon Division offices, and in the Bridge Design Section at the FHWA’s Central Federal Lands Highway, he accepted a position at ODOT 11 years ago.
Mr. Johnson currently holds the position of State bridge engineer at ODOT. As the manager of the Bridge Section, he directs a team that is responsible for a large array of projects, such as bridge and tunnel management, bridge and tunnel program development, major bridge maintenance project selection and funding management, bridge and tunnel inspection and load rating, cost data tracking, bridge and structure design, bridge specialty design, and bridge design and drafting standards.
Recent projects of note in which he has been involved include the development of A1010 structural steel for bridge use, development of precast deck systems for Oregon, use of stainless steel and glass fiber reinforced polymer rebar for coastal bridges, use of arc-sprayed zinc for structural steel corrosion protection, photo rectification for gusset plate inventory and load rating; development of titanium near-surface mounted strengthening, and development of deterministic seismic design standards for a subduction zone major event (Cascadia).
In addition to serving as chair for the LTBP Program State Coordinators, Mr. Johnson is the chair of the TRB LTBP Program Advisory Committee. He is also the liaison from the American Association of State Highway and Transportation Officials (AASHTO) Special Committee on Joint Development to the AASHTOWare™ Bridge Task Force.

Figure 12. Photo. Bruce Johnson.
By Jeffrey Weidner, Pennoni Associates Inc.
The LTBP Program mission is to foster improved bridge performance and management by establishing a comprehensive database of quantitative information collected over the long term on a large sample of U.S. highway bridges. To achieve this mission, the LTBP Program has adopted the following overarching goals for the program:
To achieve these goals, it is imperative that data collection, inspections, testing, and reporting of results be implemented in a consistent manner, regardless of where, when, and by whom they are conducted. Toward this end, the LTBP Program Protocols provide a set of step-by-step instructions to govern all aspects of data collection. When implemented by the data collection teams, these protocols will ensure the quality and maximize the usefulness of the data collected throughout the life of the LTBP Program.
The LTBP Program Protocols are for research purposes and are intended primarily for use within the LTBP Program. However, State transportation departments and university researchers are encouraged to use these protocols for their research efforts. For example, if a State transportation department specifies the use of these protocols for a State Planning and Research (SP&R) study, then the data/results from that study could be compared with data/results contained within the LTBP Bridge Portal, making the SP&R data/results even more valuable. The first version of the LTBP Protocols, Long-Term Bridge Performance (LTBP) Program Protocols, Version 1 (Publication No. FHWA-HRT-16-007), was published in January 2016.
The LTBP Program Protocols are intended to serve as living documents. They will be issued approximately every 2 years, with updates made to existing protocols and new protocols added. In this way, the LTBP Program can introduce new technologies for data collection and analysis of results and also clarify statements in existing protocols if questions arise.
The LTBP Program Protocols are organized into a hierarchy (figure 13) based on the chronology of a data collection effort for a single bridge. There are two general types of protocols: protocols with very specific step-by-step instructions, and instructional protocols that provide guidance and insight but leave many decisions to the end user.
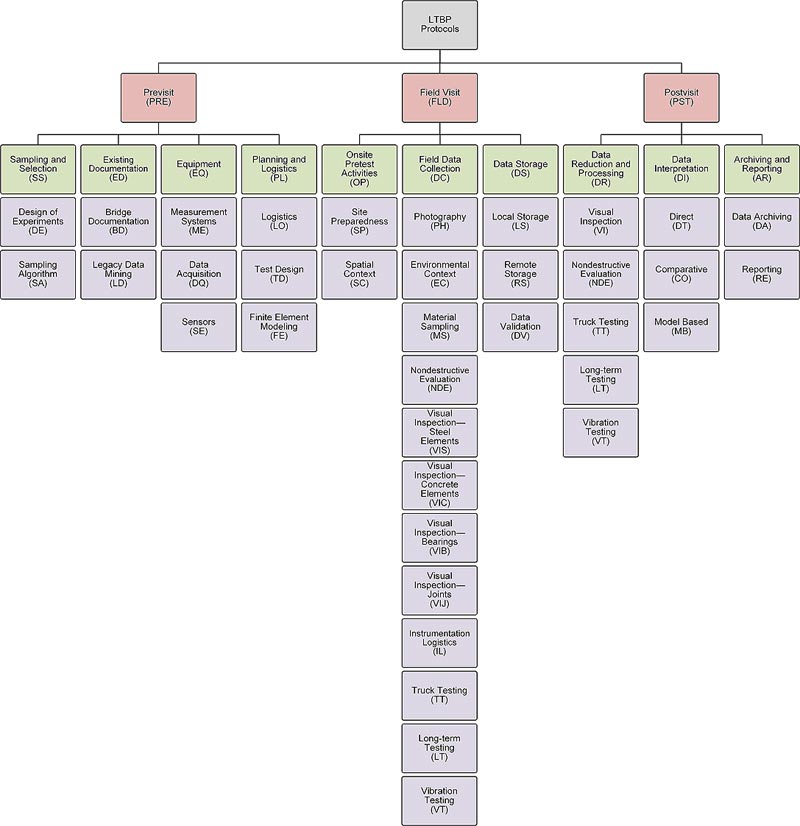
Figure 13. Flow chart. Protocol hierarchy.
The LTBP Program Protocols are divided into three groups.
These protocols focus on preparations and actions that occur prior to collecting data at the bridge. PRE protocols include but are not limited to the following:
These protocols focus on the collection of research data in a consistent manner to facilitate comparative analysis across structures and over time. FLD protocols include but are not limited to the following:
Protocols in this group focus on actions taken after the data is collected at the bridge. “PST” protocols include but are not limited to the following:
To permit ease of identification and future expansion, XXX - YY - ZZ[Z] - ### was adopted as a naming convention. XXX identifies the stage of the data collection effort (PRE, FLD, PST), YY identifies the subcategory under the stage category (data collection - DC), ZZ[Z] identifies the specific group of protocols in a subcategory (nondestructive evaluation - NDE), and ### is the number assigned to that protocol from 001 to 999.
The protocols follow a standard outline form. Each major section serves a specific purpose. A numbered structure provides breaks between paragraphs and a hierarchical structure, as opposed to a bulleted or indented outline. A brief description of each section follows.
A brief description of the data that will be collected by the technique described by the protocol is provided here. In the case where the protocol is instructional or focuses on development of a plan, the data collected are the plan itself.
This section provides a specific list of equipment that is called out in the protocol as required. This section almost always references the protocol covering personal health and safety because this is ubiquitous. Similarly, the personnel section references the protocol that sets out personnel qualifications and lists anything above and beyond those requirements.
This section provides the step-by-step instructions for executing the technique or requirement set forth by the protocol. This section is written in the imperative voice, giving the reader specific instructions to avoid ambiguity. This section is the most important part of the protocol.
This section presents the data collection table that will be used to define exactly how the data described in the methodology section should be recorded and formatted for easy import into the LTBP Bridge Portal. A key for using the data table is provided as well. For protocols that do not need a data table, it is noted as omitted.
When data require specific validation, particularly onsite, this section will include instructions for the data. Often, this section is noted as “None.”
Explanation for the purpose of the protocol is provided here. Specific details about the goals for these data, and other general information that is not part of the methodology, are included here.
This section includes a list of protocols that are referenced within this protocol as well as a list of external references that may be required.
FLD-DC-NDE-002 (Field/Data Collection/Nondestructive Evaluation) is the protocol for Ground Penetrating Radar (GPR) Testing for Bridge Decks, referred to herein as the GPR protocol. This protocol provides step-by-step instruction for collection of GPR data and metadata.
A critical section for FLD-DC-NDE-002 is the equipment requirements. For GPR, the operational capabilities, such as scan rate and spatial sampling, are critical. Not just any GPR system will suffice. Selection of equipment, scan rate and spatial sampling, and data collection methods are interconnected. The protocol specifies a minimum spatial sampling of 60 scans/ft and a minimum scan rate of 120 scans/s to maintain a stable and steady-state GPR signal. They are functions of both the antenna sampling frequency and the speed at which the scanning equipment is moved along the bridge deck. The protocol focuses on single-antenna, ground-coupled systems because they are the most commonly used types on bridge decks.
The methodology section covers everything from determination of direction for scanning to data storage requirements. It describes how to properly ensure that the signal remains within the measurement window during data collection.
This protocol is just one in a comprehensive structure of protocols that provides instructions for consistent and accurate data collection and analysis techniques. The LTBP Program Protocols, and the data and results from the use of these protocols, will assist in answering important questions concerning the performance of the Nation’s bridges.
The LTBP Bridge Portal Version 1 is now available for use. The LTBP Bridge Portal is a Web-based application interface capable of providing storage, access, analysis, and visualization of various data sources related to bridge performance on a network or individual basis. It is also capable of providing mapping of bridges by region, corridor, or system and the ability to export data for reporting or further evaluation.
Employees of FHWA, State transportation departments, and local agencies can access the LTBP Bridge Portal through FHWA’s User Profile Access Control System (UPACS). Access to UPACS as well as instructions for State transportation department and local agency employees on obtaining Operational Research Consultants credentials can be found at the following link: https://fhwaapps.fhwa.dot.gov/upacsp/. Other users will need to request access to and register for the Portal through the following link: https://fhwaapps.fhwa.dot.gov/ltbpp/.
For more information about the LTBP Bridge Portal, please contact Robert Zobel, FHWA LTBP Program Coordinator, robert.zobel@dot.gov.
This report presents 51 of the protocols that will be used throughout the LTBP Program for data collection, mining of bridge legacy data, visual assessment, sampling and testing of concrete materials, and NDE of bridges, as well as data management and storage. Publication No. FHWA-HRT-16-007 can be found online at the following link: https://www.fhwa.dot.gov/publications/research/infrastructure/structures/ltbp/16007/index.cfm.
This technical summary describes the advancement and changes in reinforcing bars and corrosion-resistant reinforcement from 1910 to the present. Publication No. FHWA-HRT-16-012 can be found online at the following link: https://www.fhwa.dot.gov/publications/research/infrastructure/structures/ltbp/16012/index.cfm.
This report reviews the state-of-the-art with respect to bridge condition indices being used to assess performance of bridges in the United States and other countries. Publication No. FHWA-HRT-15-081 can be found online at the following link: https://www.fhwa.dot.gov/publications/research/infrastructure/structures/bridge/15081/index.cfm.
This report presents a review of the literature related to regulations on truck weight limits, weigh-in-motion (WIM) technologies for pavements and bridges, WIM system specifications and accuracy, and experience from the Long-Term Pavement Performance Program with WIM systems relevant to the traffic load data collection goals for the LTBP Program. Publication No. FHWA-HRT-16-024 can be found online at the following link: https://www.fhwa.dot.gov/publications/research/infrastructure/structures/ltbp/16024/index.cfm.
This technical summary will describe the findings from the visual inspection, NDE, and material sampling of the New Jersey pilot bridge deck.
This technical summary will focus on the current use (as of August 2013) of overlays and sealers by the State transportation departments.
For more information, visit the LTBP website: www.fhwa.dot.gov/research/tfhrc/programs/infrastructure/structures/ltbp/
 |
To join the LTBP mailing list or for more information, contact us at ltbp@dot.gov. Hamid Ghasemi, Ph.D., LTBP Program Manager Turner-Fairbank Highway Research Center 6300 Georgetown Pike McLean, VA 22101 |
 |