U.S. Department of Transportation
Federal Highway Administration
1200 New Jersey Avenue, SE
Washington, DC 20590
202-366-4000
Federal Highway Administration Research and Technology
Coordinating, Developing, and Delivering Highway Transportation Innovations
 |
| This report is an archived publication and may contain dated technical, contact, and link information |
|
Publication Number: FHWA-HRT-05-083
Date: August 2007 |
|
Previous | Table of Contents | Next Appendix I. Study of User ComfortOVERVIEWIn addition to the concerns regarding fatigue and other stress related issues due to cable vibration, it may also be important that the users of the bridge feel comfortable with any visible cable movements. A design criterion set forth by these factors would be independent of those required by the structural effects involved, similar in nature to existing codes limiting deflection in bridges or drift in tall buildings. A survey was performed to determine at what limits users will no longer feel comfortable crossing a bridge either as a pedestrian or as a driver. Video models were created using 3D Studio® to simulate various cable vibration scenarios. These videos were shown to 50 users who were asked to indicate their comfort level with crossing the bridge under these circumstances. The parameters varied in the models were mode of vibration, amplitude, and velocity of oscillations. The following charts will demonstrate the results of the survey. User comfort was rated from 1 to 5, with 1 being the most comfortable and 5 being the least comfortable. The breakdown of the ratings was described to the users as follows:
Mode ShapeFigure 177 shows the effect of mode shape on user comfort. Users were shown videos with constant amplitude and frequency, with the mode shape varying from first to third. It was largely determined that mode shape does not play a significant role in affecting the user´s comfort level. Figure 177. Graph. Effect of mode (constant amplitude and velocity). 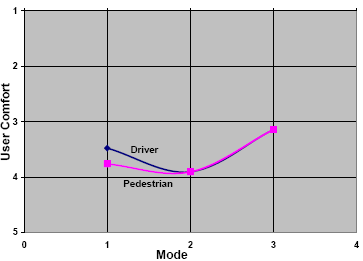 VelocityThe next parameter tested was velocity (figure 178). The amplitude and mode shape of the vibrations were held constant while the frequency was varied from 0.5 to 2.0 Hz. The results indicate that users had strong reservations when frequencies were higher than 1 Hz, but they quickly became more comfortable when the frequency dropped below 1 Hz. It should be noted that the high level of concern demonstrated across all the simulations for this parameter is most likely due to the fact that too high of an amplitude was chosen as the constant. Nevertheless, this should have little effect on the shape of the distribution, just where it is located on the Y-axis. Figure 178. Graph. Effect of velocity (constant amplitude). 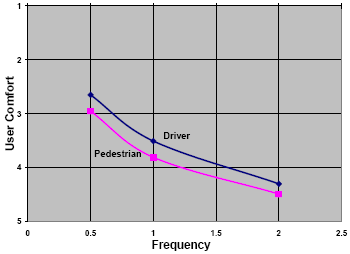 AmplitudeThe final parameter tested was amplitude (figure 179). Videos were shown that simulated vibrations with a constant velocity and constant mode shape, while amplitude was varied from 0.5 diameters to 2 diameters. The results indicate that at a point near 1 diameter vibration amplitude, the user begins to feel uncomfortable crossing the bridge. Below 1 diameter, this concern trails off quickly. The graph below does indicate that users were more comfortable with oscillations of 2 diameters than those of 1 diameter. This was dismissed as an anomaly caused by the number of videos that had been shown at this point in the survey, and the order in which the videos were shown. Figure 179. Graph. Effect of amplitude (constant velocity). 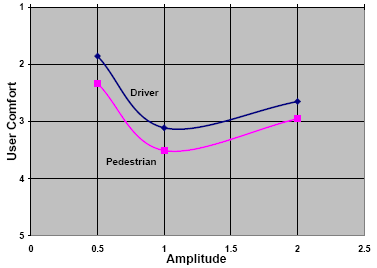 ConclusionThe two most important factors affecting user comfort are the amplitude of the vibration and the velocity. As the frequency range is somewhat limited, it would stand to reason that the comfort criteria could be based on the amplitude. According to this study, a reasonable recommendation of a limit on vibration amplitude would be 1 cable diameter. Ideally, further reducing this to 0.5 diameters or below has the effect of making the vibrations virtually unnoticeable. This study is preliminary and based on a relatively small sample size, therefore further investigation should be performed to refine any design criteria based on user comfort. Also, while the above charts indicate that there is no significant difference in the perception of safety for a pedestrian and for a driver, this is probably inaccurate and the difference could be established by producing a driver video that includes a moving viewpoint and other roadway distractions. This difference is important in that it would establish tighter criteria for bridges in urban areas or with pedestrian walkways compared with a more liberal criteria for rural locations with no pedestrians. |

