U.S. Department of Transportation
Federal Highway Administration
1200 New Jersey Avenue, SE
Washington, DC 20590
202-366-4000
Federal Highway Administration Research and Technology
Coordinating, Developing, and Delivering Highway Transportation Innovations
 |
| This report is an archived publication and may contain dated technical, contact, and link information |
|
Publication Number: FHWA-HRT-07-039
Date: July 2007 |
|||||||||||||||||||||||||||||||||||||||||||||||||||||||||||||||||||||||||||||||||||||||||||||||||||||||||||||||||||||||||||||||||||||||||||||||||||||||||||||||||||||||||||||||||||||||||||||||||||||||||||||||||||||||||||||||||||||||||||||||||||||||||||||||||||||||||||||||||||||||||||||||||||||||||||||||||||||||||||||||||||||||||||||||||||||||||||||||||||||||||||||||||||||||||||||||||||||||||||||||||||||||||||||||||||||||||||||||||||||||||||||||||||||||||||||||||||||||||||||||||||||||||||||||||||||||||||||||||||||||||||||||||||||||||||||||||||||||||||||||||||||||||||||||||||||||||||||||||||||||||||||||||||||||||||||||||||||||||||||||||||||||||||||||||||||||||||||||||||||||||||||||||||||||||||||||||||||||||||||||||||||||||||||||||||||||||||||||||||||||||||||||||||||||||||||||||||||||||||||||||||||||||||||||||||||||||||||||||||||||||||||||||||||||||||||||||||||||||||||||||||||||||||||||||||||||||||||||||||||||||||||||||||||||||||||||||||||||||||||||||||||||||||||||||||||||||||||||||||||||
Chapter 3 - Corrosion Resistant Alloys for Reinforced Concrete3. EXPERIMENTAL PROCEDUREACCELERATED SCREENING TESTSGeneralThree categories of accelerated screening tests (ASTs)—wet-dry cycling (AST-1), chloride (Cl-) threshold determinations (AST-2A), and pitting potential determinations (AST-2B)—were performed. The first of these, AST-1, was modeled after an earlier program15 and focused upon measurement of corrosion rate of rebar specimens upon exposure to repetitive 1.75 hours wet— 4.25 hours dry cycles for a total of 84 days. The test solution was 0.30N potassium hydroxide (KOH)—0.05N sodium hydroxide (NaOH) (pH ~ 13.40) simulated pore water that contained 3.00 weight percent (w/o) sodium chloride (NaCl) (1.82 w/o chloride (Cl-)) during the initial 28 days exposure, 9.00 w/o NaCl (5.46 w/o Cl-) for the next 28 days, and 15.00 w/o NaCl (9.10 w/o Cl-) for the last 28 days. Corrosion rate of the different rebar specimens was determined by both weight loss and polarization resistance measurements. The second test method, AST-2A, consisted of continuous immersion of specimens in simulated pore solution of the same composition as for AST-1. In this case, however, no chlorides were present initially but were subsequently introduced incrementally as NaCl at time intervals ranging from one to several days. Also, AST-2A specimens were anodically polarized potentiostatically to +0.100 VSCE. For both AST-1 and AST-2A experiments, the test solution was periodically titrated for hydroxide (OH-); and pH was then calculated using the equation,
where The AST-2B experiments, on the other hand, involved anodic potentiodynamic polarization scans upon individual specimens in deaerated, saturated calcium hydroxide (Ca(OH)2) with different chloride ion concentrations ([Cl-]). The objective in this case was to determine the critical pitting potential for the different types of rebar. In effect, the AST-2B experiments are a sequel to the AST-2A, in that the former determined the potential for pitting at a given [Cl-] and the latter the critical [Cl-] at a specific potential (+0.100 VSCE in this case). MaterialsTable 3.1 lists the various steels that were acquired based upon a review of the literature and bar availability. The fact that Type 316L stainless steel (SS) was acquired from two sources resulted because Type 304SS was requested from one of these, but chemical analysis of the received material indicated that it qualified as Type 316LSS instead. Composition for all bars is shown in table 3.2. Bar size in all cases was number 5 (16 mm diameter). The two types of clad bars (Stelax and SMI) were fabricated by two distinct processes, the former by packing a stainless steel tube with steel scrap followed by rolling, and the latter by plasma applying stainless steel to a carbon steel billet and then rolling. Unless noted otherwise, bars were tested in the as-received surface condition subsequent to acetone cleaning.
AST-1: Wet-Dry ExposuresSpecimensBoth straight and bent rebar specimens were tested in this phase of the program. The former were sectioned directly from the as-received rebars to a length of 152 mm. In the latter case (bent bar specimens), the rebar was bent 180° to a radius that was four times the bar diameter. Specimens were acquired by then sectioning the bent portion of the rebar such that the circumferential length was approximately 200 mm. An electrical lead was mechanically attached to one end of each specimen via a screw and drilled and tapped hole. Specimens were then cleaned and the ends encapsulated with West System Brand marine epoxy type 105 and hardener type 207, a commercially available slow cure epoxy. Figures 3.1 and 3.2 show photographs of these two specimen types. In addition, MMFX-II™ and clad bars were prepared in surface abraded (A) and surface damaged (D) conditions. For clad bars, the intention in testing specimens with the A and D surface preparations was to evaluate possible effects of two degrees Figure 3.1. Photo. Straight, as-received, Stelax bar with epoxy-mounted ends and electrical lead. 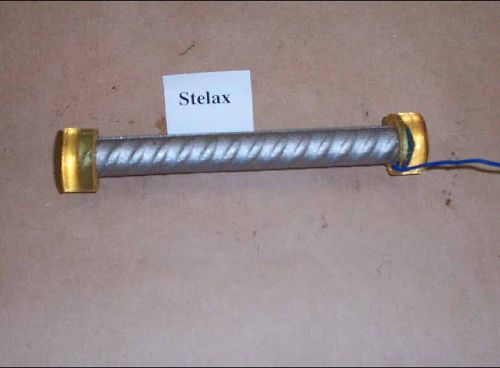 Figure 3.2. Photo. Three bent, as-received Type 2201 stainless steel bars with electrical leads. 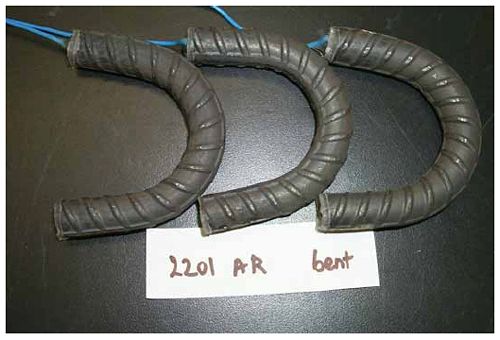 of clad disruption on corrosion performance. The A condition did not penetrate the cladding, whereas the D condition did. Also, because MMFX-II™ is a relatively new alloy that involves proprietary thermo-mechanical processing, the possibility was considered that corrosion properties of the near surface might differ from the bulk. Abrasion (condition A) involved pressing the side surface of a rebar specimen for 30 seconds against a rotating round steel wire brush that was mounted in a drill press. This resulted in two, approximately two cm diameter abraded areas on each rebar specimen, as shown in figure 3.3. The D condition, on the other hand, involved drilling a 4.8 mm diameter hole to a depth of three mm on a bar side. Figure 3.4 shows a photograph of a specimen prepared in this manner. Type 2201 stainless steel specimens were tested as-rolled (unpickled) and in addition with surface blasting using (1) steel shot, (2) stainless steel shot, and (3) silica sand. Test ProcedureFigure 3.5 shows a photograph of this test system, which consisted of two polyethylene chambers, an elevated one in which rebar specimens were suspended and a lower one which served as a reservoir for the solution during the nonsubmerged period of each cycle. A timer and solenoid valve controlled the solution exchange between chambers. Figure 3.6 is a photograph of specimens under test. The exposure chamber was covered such that a high relative humidity was maintained during the dry period in order to maximize test severity during this Figure 3.3. Photo. Abraded MMFX-II™ specimen. 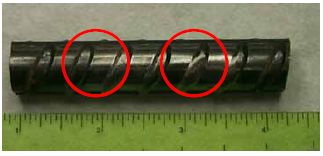 Figure 3.4. Photo. Damaged MMFX-II™ specimen. 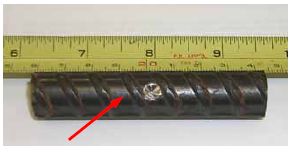 Figure 3.5. Photo. AST-1 wet-dry exposure setup. 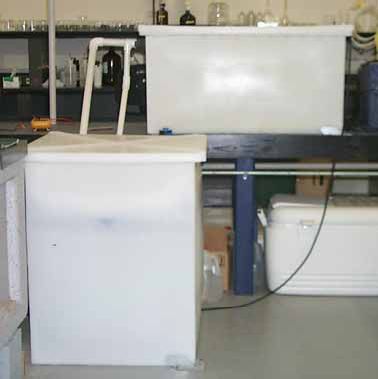 Figure 3.6. Photo. AST-1 specimens under test in the upper hold tank (figure 3.5). 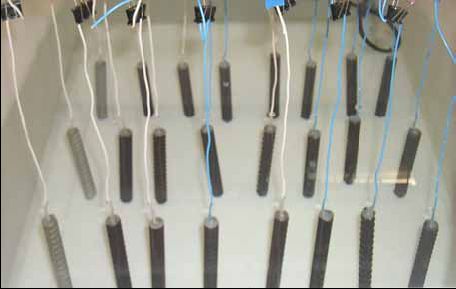 phase. Triplicate specimens of a given material and specimen type were tested in a particular run. Polarization resistance (PR) measurements were made periodically on the rebar specimens during the submerged phase of the exposures using a Gamry CMS100 potentiostat with a scan rate of 0.33 mV/sec and polarizations of ±0.020 V referenced to the free corrosion potential. Prior to scanning, rebar potential was monitored for 300 seconds or until any potential variations were less than 0.1 mV/sec. From the measured PR, corrosion rate, CR, was calculated using a modified form of the Stern-Geary equation,
where Z is atomic weight, n is the number of electrical equivalents, F is Faraday’s constant, ρ is alloy density, and B is a constant that depends on the Tafel constants. In the present determinations, B was taken as 0.052 V for the metals that were assumed to be corroding passively (316, 2205, 2201, and 3Cr12) and 0.026 V for the actively corroding ones (MMFX-II™ and black bar). An example calculation is provided in Appendix B. In addition, one rebar specimen of each material was removed at the completion of each 28-day period for weight loss determination. The average CR over the exposure duration was determined from before and after specimen weight measurements using the expression,
where W is weigh loss, ρ is metal density, A is exposed rebar specimen surface area, and T is exposure time. An example calculation is provided in Appendix C. Overall, there were five separate AST-1 runs with the rebar and specimen type for each being as listed in table 3.3. This indicates that a total of 267 specimens were tested, with anywhere from 24 to 69 specimens being exposed in a particular run. Multiple runs on the same rebar type were performed to confirm run-to-run PR and corrosion rate reproducibility. Also, for a given run there were triplicate specimens of the alloys tested. The lack of a pattern with regard to what rebars were exposed in a particular run was due, in part, to delays in acquiring some of the materials.
AST-2A: Chloride Threshold DeterminationsThe specimen type in this case was the same straight 152 mm long number 5 rebar employed in AST-1. The test procedure involved concurrent exposure of 20 rebar specimens which were potentiostatically polarized using a single, locally designed and constructed potentiostat. Current to each rebar specimen was calculated from the voltage drop across an individual 10-ohm resistor that was in series with each specimen. Chloride as NaCl was incrementally added to the simulated pore solution at time intervals of from one to several days. Figure 3.7 shows a schematic representation of this test system, and figure 3.8 provides a photograph. Figure 3.9 is a photograph of specimens under test. The rationale behind this approach considers that the polarized potential (+0.100 VSCE) is about 100 mV more positive than the upper value of the free corrosion (half-cell) potential that is likely to occur for rebar in concrete under outdoor atmospheric or splash zone exposure. As such, the critical chloride concentration (threshold) to cause loss of rebar passivity and onset of active corrosion, [Clth- ] , should be less at this potential (+0.100 VSCE) than in actual service, thereby providing a conservative determination of this parameter. A current density of 10 μA/cm2 was defined as indicative of corrosion initiation; and the corresponding [Cl-] was taken as [Clth-]. While this current density is somewhat arbitrary, it is the same as has been employed by others in similar experiments.17 The chloride threshold oncentration is an important parameter for projection of time-to-corrosion, maintenance planning, and life-cycle cost analysis for reinforced concrete structures. Figure 3.7. Schematic illustration. AST-2A experimentation. 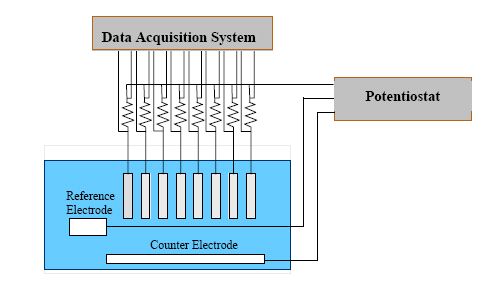 Figure 3.8. Photo. AST-2A test system. 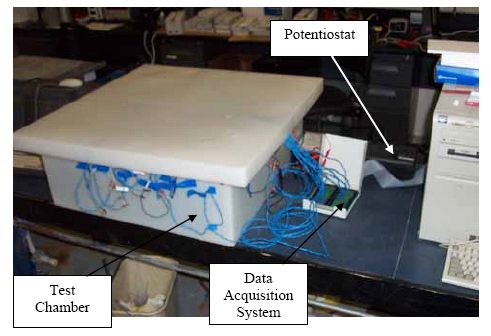 Figure 3.9. Photo. Test chamber with specimens. 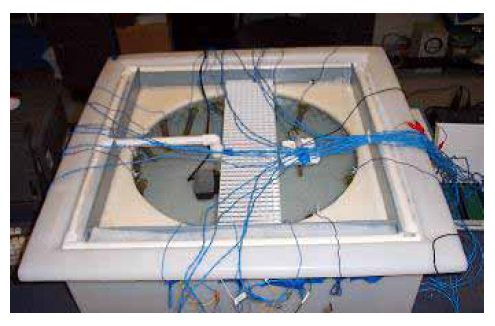 An initial, trial AST-2A run employed either one or two rebar specimens for six of the alloys. Subsequent runs employed 10 identical specimens of two rebar types. Table 3.4 provides a listing of these for the three runs that have been completed (total of 52 specimens). The relatively large number of specimens of each alloy in the latter two runs serves as a basis for statistical treatment of the resulting [Clth-] data. Thus, considering that [Clth-] is a statistically distributed parameter and that the results from this study can be related to actual service in concrete, then it should be possible to project the percentage of rebar for which corrosion initiates at a given [Cl-]. This is directly related to practice in the sense that repairs and rehabilitations are often initiated in response to a certain percentage of substructure spalling or deck delamination.
AST-2B: Pitting Potential DeterminationsSpecimensThree types of specimens, defined according to orientation and preparation of the exposed surface, were tested in order to determine the respective pitting potentials. These included (1) longitudinally oriented rebar specimens that were similar to the AST-1 and AST-2A ones except that length was 30 mm with (a) the as-received surface condition and (b) a machined and 600 grit polished surface condition and (2) sectioned rebar specimens where the cross-section (machined and 600 grit polished) was exposed. The objective of employing multiple specimen orientations and surface conditions was to determine any effect these might have upon corrosion properties. Figures 3.10 through 3.13 show schematic illustrations and photographs of these three specimen types. Four rebar types, 316.16, 2201, MMFX-II™, and 3Cr12, were tested using this protocol. Test ProcedureThese experiments utilized a one liter glass container with a threaded Teflon-lined lid. Five holes were drilled in the lid for insertion of electrical leads and tubing for nitrogen gas purging. Each of the leads and the tubing were mounted in a sealed rubber stopper which was fitted into the lid. The immersion solution for the rebar specimens was saturated Ca(OH)2 containing 0 to 10 w/o NaCl (0-6.07 w/o Cl-). The rebar specimen potential normally stabilized after about 20 minutes of high purity nitrogen gas purging of the solution. Purging continued throughout the experiments. Figure 3.14 provides a photograph of the test cell. The same Gamry system as for the AST-1 experiments (see above) was employed to perform the scans. These were initiated at a potential of –0.600 VSCE in order to reduce surface oxides and reduce any effect of these on electrochemical response. The scans proceeded positively to +1.000 VSCE or 2.00 mA/cm2, whichever occurred first. This assured that a relatively broad potential range was covered. The scan was then reversed and terminated at –0.500 VSCE. The forward and reverse scan rates were both 0.50 mV/s, but a limited number of experiments were performed at 0.33 and 1.00 mV/s. A minimum of three replicate experiments was performed for each set of variables with each scan using a newly prepared specimen. Table 3.5 lists the number of tests for each rebar and specimen type and surface condition. A total of 116 scans were performed. Figure 3.10. Illustration and photo. Schematic illustration (a) and photograph (b) of the as-received, circumferential AST-2B test specimen. 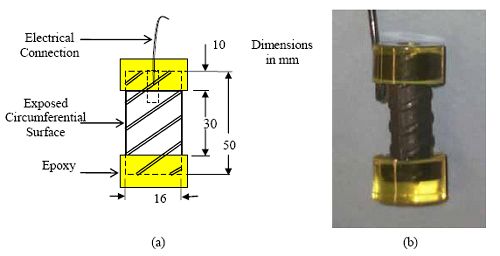 Figure 3.11. Photo. Polished circumferential specimen. 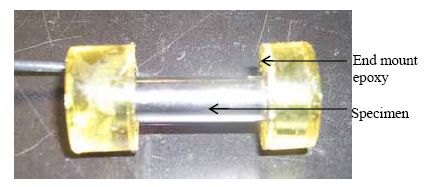 Figure 3.12. Schematic illustration. Polished cross section surface specimen. 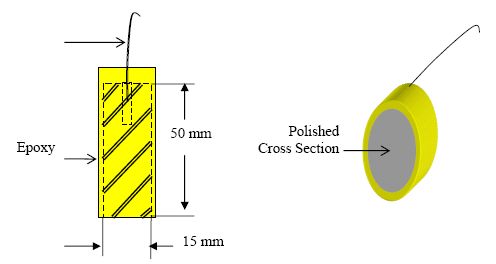 Figure 3.13. Photo. Two polished cross section specimens. 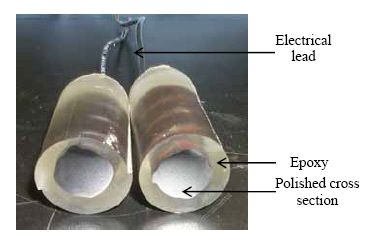 Figure 3.14. Photo. Test cell for potentiodynamic polarization measurements. 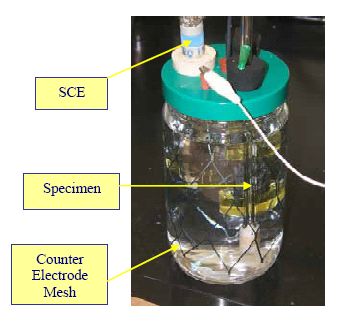
LONG-TERM TESTSSpecimen DesignGeneralFour different types of reinforced concrete specimens, designated (1) simulated deck slabs (SDS), (2) two different types of three bar column specimens (designations S3BC and 3BTC),1 (3) macro-cell slabs (MS), and (4) field columns (FC), were fabricated by the Florida Department of Transportation State Materials Office (FDOT-SMO) in Gainesville. Three concrete mix designs, designated (1) STD1 (5 bags cement and 0.5 w/c) which yields a high permeability concrete, (2) STD2 (7 bags of cement and 0.41 w/c) which results in moderate permeability, and (3) STD3 (7 bags of cement and 0.50 w/c) which is of intermediate permeability, were employed. Target mix designs are listed in table 3.6. The various corrosion resistant alloy types in addition to black bar (table 3.1) were used as reinforcement. Table 3.7 provides a listing of the different specimen types and bar configurations that were prepared, each of which is discussed in detail below. The clad bars were placed in the as-received condition with and without intentional damage (3 mm diameter clad penetrations spaced 25 mm apart). Specimens were cured subsequent to casting and prior to exposure for a minimum of 6 months in a warehouse with no temperature or humidity control. All bars were nominally 16 mm in diameter (number 5) and, unless noted otherwise, had the as-received surface finish (table 3.1). 1 The S3BC designation signifies a square column specimen with three rebars, and 3BTC indicates a tombstone column (rectangular cross section) specimen with three rebars. Each is described subsequently in detail.
Simulated Deck SlabsThe simulated deck slab (SDS) specimens were fabricated with six bars; three of which comprised a top mat and three the bottom mat, as illustrated schematically in figure 3.15. Concrete cover for all bars was 25 mm; and triplicate specimens were prepared for each bar type and specimen variable, as described below. Concrete mix designs STD1 and STD2 were employed but with most specimens being prepared using the former. Because of material inventory limitations, no Stelax bars with intentional clad damage were included in this phase of the study. Five different modifications to the above standard slab configuration have been prepared to date and are under test, as listed and described below.
Figure 3.15. Schematic illustration. Standard simulated deck slab specimens.  Figure 3.16. Schematic illustration. CREV type simulated deck slab specimens.  Because the specimens were fabricated over a period of time, they were delivered to FAU on three separate occasions. The following example illustrates the nomenclature that was adapted to identify a standard specimen: Figure 3.17. Graphic. Standard specimen nomenclature.  There were three Specimen Lot Numbers corresponding to one of the three groups of specimens that were delivered to FAU by FDOT at different times. Likewise, designation of specimens that were nonstandard (BCAT, CCON, …) is illustrated by the following example: Figure 3.18. Graphic. Nonstandard specimen nomenclature.  Thus, the latter identifies this as simulated deck slab specimen number 2 with 3Cr12 reinforcement in the crevice configuration from lot 3. The default mix design (no indication) was STD1. Once slabs were delivered to FAU, their condition between the different lots was normalized by placement in air conditioned space for 2 months. During this time, a hard electrical connection was established between bars in each of the two mats of each slab using a stainless steel wire in conjunction with a screw and drilled and tapped hole in each bar end. The wires from each mat were normally connected; but the circuit was periodically interrupted during the exposures and a 10 Ω resistor temporarily inserted. This allowed measurement of the voltage drop between the mats from which macro-cell current was calculated. This current was then divided by the surface area of the three top bars to obtain current density. The specimen sides were epoxy coated, and a plastic bath with a vented lid was attached to the top concrete surface in preparation for ponding with a salt water solution. Exposure for the three sets of specimens commenced on June 9, August 5, and October 30, 2003, respectively. Salt water ponding consisted of a 1-week wet— 1-week dry cycle with 15 w/o NaCl (9.10 w/o Cl-). Figure 3.17 shows a single specimen under test, and figure 3.18 is a perspective view of the test site. Three Bar ColumnsTwo different versions of this type specimen, the square 3-bar column (S3BC) and the 3-bar tombstone column (3BTC), were prepared. Each of these has three bar geometries: normal, bent, and elevated. The two configurations (S3BC and 3BTC) are illustrated schematically in figures 3.19 and 3.20, respectively, where the S3BC specimens were fabricated using concrete mixes STD1 and STD2 and the 3BTC using STD2 and STD3 (table 3.6). Initially, the square geometry only (S3BC) was to be employed; but subsequent to these being prepared, the 3BTC was developed, considering the fact that chlorides can reach the reinforcement from three sides rather than one which provides a more severe exposure. The normal reinforcement configuration has been employed by the FDOT for more than 10 years and was intended to provide baseline data that can be compared to results from previous studies. On the other hand, the bend bar configuration was considered particularly relevant in the case of the stainless clad and possibly the MMFX-II™ reinforcements. The elevated bar geometries were intended to provide different anode-cathode area ratio of bars and, possibly, enhance macro-cell activity. Six specimens of each rebar type were prepared and exposed for each test condition. Subsequent to curing, these were partially submerged in a 3.5 w/o NaCl solution to a depth of 152 mm for the purpose of facilitating formation of an electrochemical macro-cell on each of the long bars. Figure 3.21 shows the outside screen room at the FDOT-SMO facility (north central Florida) where the specimens are exposed. Figure 3.19. Photo. Ponded deck slab specimen under test. 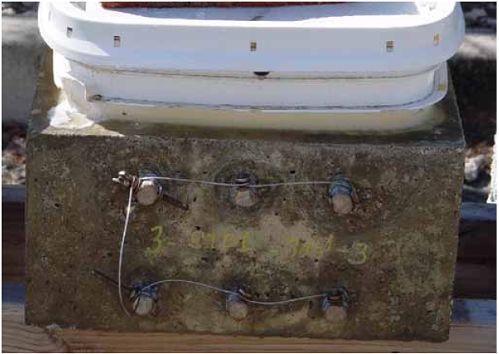 Figure 3.20. Photo. Perspective view of exposure site and specimens. 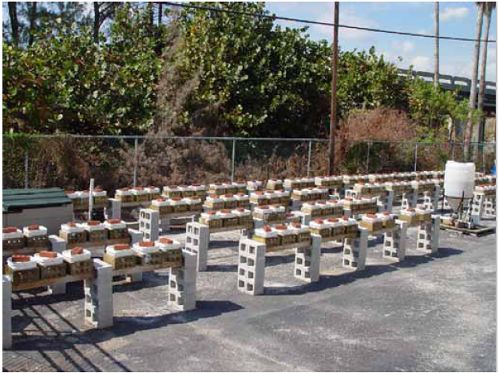 Figure 3.21. Schematic illustration. Square three bar column specimen for each of the three bar configurations.  Figure 3.22. Schematic illustration. Tombstone type three bar column specimen for each of the three bar configurations.  Figure 3.23. Photo. Three bar column specimens under exposure. 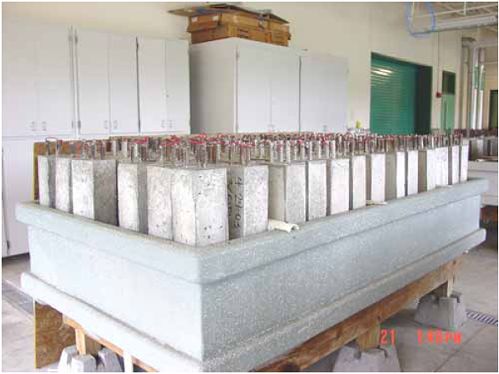 Once exposure was initiated, the individual bar potentials in each of the two specimen types (S3BC and 3BTC) were measured monthly. In addition, for the 3-bar tombstone columns (3BTC) macro-cell current between the two long bars (anode) in each specimen and the short bar (cathode) was measured. The potential of all three bars coupled together was also measured. These readings were acquired daily using a custom designed data acquisition system. Specimen exposure was terminated upon concrete cracking or visible corrosion product bleed-out. Macro-Cell Slab SpecimensSpecimens of this type were fabricated with the reinforcement having been wire brushed, although one set was prepared using the bars as-received. Two bar configurations, straight and bent, were employed, as illustrated by figure 3.22. The macro-cell slab STD1 specimens were made with and without a simulated crack, but specimens based upon the STD2 concrete mix were standard (no crack). Subsequent to curing, the specimens were inverted; and a 76 x 152 mm pond was attached to what had been the bottom cast face. Specimens were exposed to 14 days wet—14 days dry cyclic ponding with 3.0 w/o NaCl solution until corrosion induced cracking occurred. Figure 3.23 shows the exposure arrangement, which was similar to the one for the 3- bar columns. As was done for the 3-bar columns, macro-cell current between the top single bar (anode) and lower four electrically connected bars (cathode) was recorded daily via a data acquisition system, whereas potential measurements were only made manually on a monthly basis. Figure 3.24. Schematic illustration. Geometry of the macro-cell slab type specimen with both bent and straight bars.  Figure 3.25. Photo. Macro-cell slab specimens under exposure. 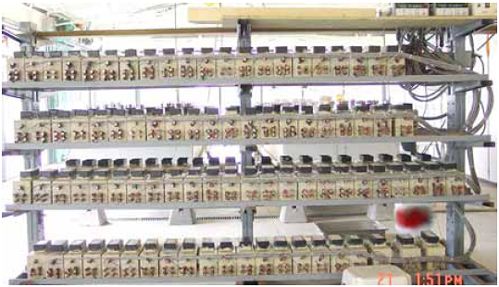 Field ColumnsThese specimens were made using the STD1 concrete mix design only and with all bars in the as-received condition. Figure 3.24 is a schematic drawing that illustrates the specimen geometry. Each bar is electrically isolated from the others. The columns have been exposed in the intercoastal waterway at Crescent Beach, FL by burying the bottom 1.2 m in bottom soil such that mean high water is 1.8 m from the specimen bottom; however, placement was delayed because of environmental permitting issues and only commenced in September 2005. Figure 3.25 is a photograph of the specimens and exposure site. Polarization resistance and potential of each individual bar was measured at the time of initial exposure. These measurements are to be obtained every 6 months until corrosion cracking or visible corrosion product bleed out is observed. Tables 3.8 through 3.13 list the number of specimens for each specimen configuration and type of reinforcement (316.18 and 3Cr12, 2201, MMFX-IITM, Stelax, SMI, and black bar). Figure 3.26. Schematic illustration. Geometry of the field column type specimen.  Figure 3.27. Photo. Field column specimens under exposure at the Intracoastal Waterway site in Crescent Beach, FL 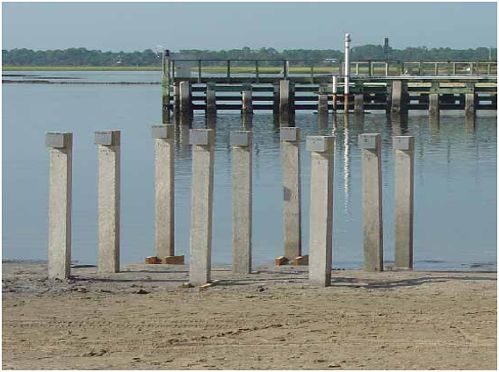
|
|||||||||||||||||||||||||||||||||||||||||||||||||||||||||||||||||||||||||||||||||||||||||||||||||||||||||||||||||||||||||||||||||||||||||||||||||||||||||||||||||||||||||||||||||||||||||||||||||||||||||||||||||||||||||||||||||||||||||||||||||||||||||||||||||||||||||||||||||||||||||||||||||||||||||||||||||||||||||||||||||||||||||||||||||||||||||||||||||||||||||||||||||||||||||||||||||||||||||||||||||||||||||||||||||||||||||||||||||||||||||||||||||||||||||||||||||||||||||||||||||||||||||||||||||||||||||||||||||||||||||||||||||||||||||||||||||||||||||||||||||||||||||||||||||||||||||||||||||||||||||||||||||||||||||||||||||||||||||||||||||||||||||||||||||||||||||||||||||||||||||||||||||||||||||||||||||||||||||||||||||||||||||||||||||||||||||||||||||||||||||||||||||||||||||||||||||||||||||||||||||||||||||||||||||||||||||||||||||||||||||||||||||||||||||||||||||||||||||||||||||||||||||||||||||||||||||||||||||||||||||||||||||||||||||||||||||||||||||||||||||||||||||||||||||||||||||||||||||||||||