U.S. Department of Transportation
Federal Highway Administration
1200 New Jersey Avenue, SE
Washington, DC 20590
202-366-4000
Federal Highway Administration Research and Technology
Coordinating, Developing, and Delivering Highway Transportation Innovations
 |
| This report is an archived publication and may contain dated technical, contact, and link information |
|
Publication Number: FHWA-HRT-07-043
Date: July 2007 |
|||||||||||||||||||||||||||||||||||||||||||||||||||||||||||||||||||||||||||||||||||||||||||||||||||||||||||||||||||||||||||||||||||||||||||||||||||||||||||||||||||||||||||||||||||||||||||||||||||||||||||||||||||||||||||||||||||||||||||||||||||||||||||||||||||||||||||||||||||||||||||||||||||||||||||||||||||||||||||||||||||||||||||||||||||||||||||||||||||||||||||||||||||||||||||||||||||||||||||||||||||||||||||||||||||||||||||||||||||||||||||||||||||||||||||||||||||||||||||||||||||||||||||||||||||||||||||||||||||||||||||||||||||||||||||||||||||||||||||||||||||||||||||||||||||||||||||||||||||||||||||||||||||||||||||||||||||||||||||||||||||||||||||||||||||||||||||||||||||||||||||||||||||||||||||||||||||||||||||||||||||||||||||||||||||||||||||||||||||||||||||||||||||||||||||||||||||||||||||||||||||||||||||||||||||||||||||||||||||||||||||||||||||||||||||||||||||||||||||||||||||||||||||||||||||||||||||||||||||||||||||||||||||||||||||||||||||||||||||||||||||||||||||||||||||||||||||||||||||||||
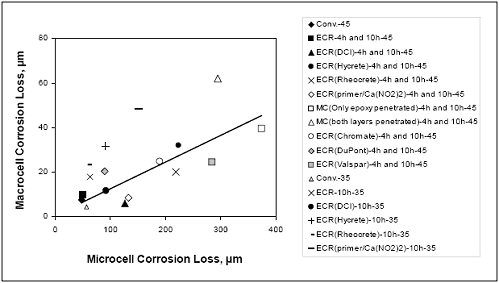
Cahpter 3. Test ResultsThe test results presented in this chapter demonstrate that conventional fusion-bonded epoxy coating significantly reduces the corrosion of reinforcing steel. Using concrete with a reduced w/c ratio lowers the corrosion rate for both conventional and epoxy-coated reinforcement under all conditions in intact concrete, but provides limited corrosion protection, at best, when cracks allow direct access of chlorides to reinforcing bars. Corrosion inhibitors consistently provide improved corrosion protection when used in conjunction with epoxy-coated reinforcement in intact concrete, but not in cracked concrete. Finally, the results demonstrate that a multiple coating, consisting of 98 percent zinc–2 percent aluminum and conventional epoxy appears to provide some additional protection; the results in this case, however, are not conclusive. Specific findings, discussed next, are presented in terms of average values at 15 weeks for the rapid macrocell tests and at a minimum of 56 weeks for the bench-scale tests. RAPID MACROCELL TESTSAll systems were evaluated using rapid macrocell tests. The bare bar test, however, was not used to evaluate corrosion inhibitors. The results presented in this section represent the average of six specimens. The epoxy on all bars was penetrated with four 3.2 mm (1/8-inch) diameter holes, as described earlier. Corrosion losses (total thickness of metal lost due to corrosion – calculated by integrating the corrosion rate) for the individual specimens in the rapid macrocell test are summarized in tables 7a and b, which, respectively, express the results based on the total area of the bars in contact with the test solutions and the area of steel exposed by the four holes through the coating on each epoxy-coated bar. Bare Bar TestsThe average corrosion rates for the systems evaluated using bare bars are shown in figures 7a and b. The two figures differ in the scale of the vertical axis. The corrosion rate represents the average based on the total area exposed to the test solution. The results indicate that conventional steel corrodes at a much higher rate then any of the epoxycoated bars in the test, with a rate that ranges between 7 and 40 µm/yr during the 15-week test. Based on corrosion rate, the epoxy-coated bars fall into two groups (figure 7b), with conventional ECR, ECR(DuPont) and ECR(Valspar) corroding at an average rate between 0.5 and 1.7 µm/yr and ECR(Chromate) and the multiple coated bars [MC(both layers penetrated) and MC(only epoxy penetrated) corroding at an average rate between −0.1 and 0.6 µm/yr. The negative corrosion rate, which indicates more corrosion at the cathode than at the anode, can be explained by the amphoteric nature of zinc, as describe in the next paragraph. As demonstrated in the figures, corrosion rates vary significantly from week to week. Conventional reinforcement (Conv.) exhibits significant increases in corrosion between weeks 5 and 6 and between weeks 10 and 11 when the solutions are changed, as described in chapter 2.
Figure 7a. Graph. Macrocell test—average corrosion rate. Bare conventional, epoxycoated, increased adhesion ECR, and multiple coated steel in simulated pore solution with 1.6 m ion NaCl. 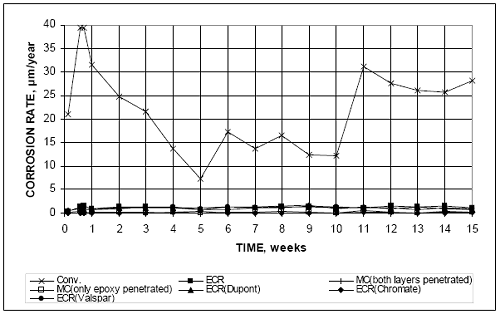 Figure 7b. Graph. Macrocell test—average corrosion rate. Bare conventional, epoxycoated, increased adhesion ECR, and multiple coated steel in simulated pore solution with 1.6 m ion NaCl. 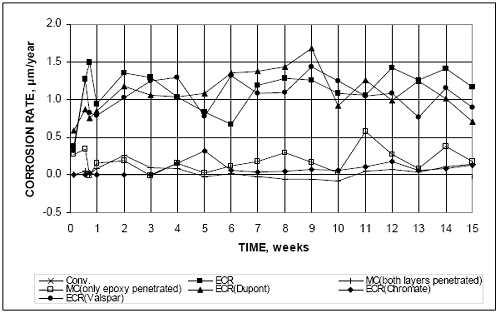 Total corrosion losses which are calculated by integrating the corrosion rate over the test period, are shown in figures 8a and b and tables 7a and b. Figure 8a expresses the losses based on the total area of the bars in contact with the text solutions, while figure 8b expresses the losses in terms of the area of steel exposed by the holes through the epoxy coating, which for macrocell specimens equals the values based on total bar surface multiplied by a factor of 100. Over the 15-week period, total losses equal approximately 6 µm for conventional steel, between 0.31 and 0.34 µm based on total area, and between 31 and 34 µm based on exposed area for conventional ECR, ECR(DuPont) and ECR(Valspar), and below 0.057 µm based on total area and 5.7 µm based on exposed area for the ECR(Chromate) and MC bars. The low macrocell corrosion rates for the MC bars, with both layers penetrated and with only the epoxy penetrated, result because the test measures macrocell, not microcell corrosion and because, as an amphoteric material, zinc is attacked by the alkaline solution at the cathode as well as by the combined alkaline and salt solution at the anode, reducing the net macrocell current. The corrosion potentials, shown in figures 9a and b (top and bottom bars disconnected for two hours), provide additional information on the behavior of the specimens. With the exception of ECR(Chromate), all specimens exhibit corrosion potentials at the anode more negative then –0.275 V with respect to a saturated calomel electrode (SCE) [approximately equivalent to –0.350 V for a copper-copper sulfate electrode (CSE)], indicating that the bars are undergoing active corrosion. In contrast to bars with only steel exposed to the test solutions, the MC bars initially exhibit corrosion potentials at both anode and cathode of approximately of –1.200 V, indicating Figure 8a. Graph. Macrocell test—average corrosion loss. Bare conventional, epoxy-coated, increased adhesion ECR, and multiple coated steel in simulated pore solution with 1.6 m ion NaCl. 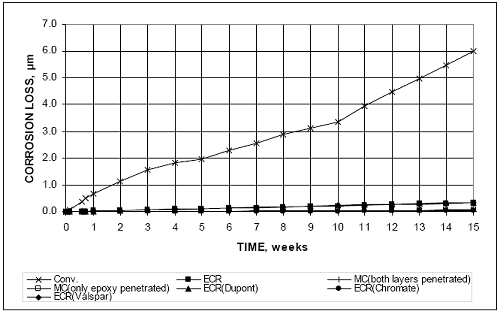 Figure 8b. Graph. Macrocell test—average corrosion loss based on area exposed at holes through coating. Bare epoxy-coated, increased adhesion ECR, and multiple coated steel in simulated pore solution with 1.6 m ion NaCl. 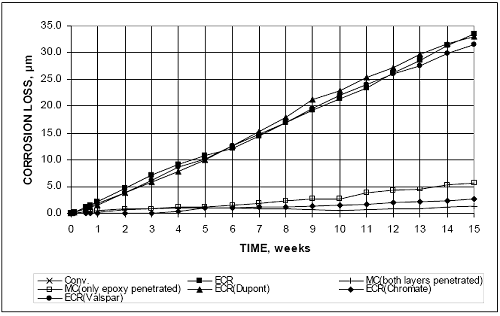 Figure 9a. Graph. Macrocell test—average corrosion potential, anode. Bare conventional,epoxy-coated, increased adhesion ECR, and multiple coated steel in simulated pore solution with 1.6 m ion NaCl. 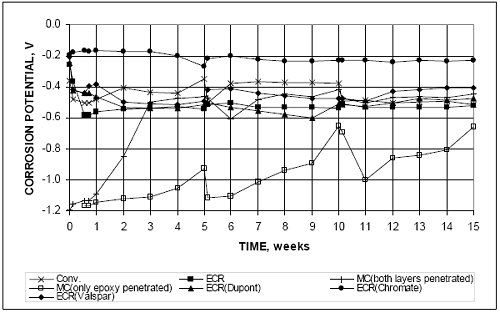 Figure 9b. Graph. Macrocell test—average corrosion potential, cathode. Bare conventional, epoxy-coated, increased adhesion ECR, and multiple coated steel in simulated pore solution with 1.6 m ion NaCl. 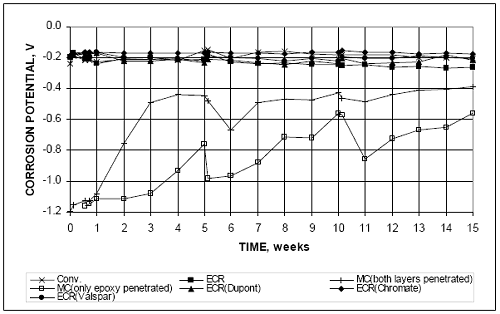 active corrosion of the zinc layer. The MC bars with both layers of coating penetrated reach a corrosion potential of about –0.500 V after three weeks, indicating that the effect of the zinc surrounding the holes has been largely reduced and that the exposed area of steel is governing the corrosion process. In contrast, the MC bars with only the epoxy penetrated maintain a significantly more negative corrosion potential than the other anode bars, indicating that the zinc was still providing some protection for the underlying steel for a significant portion of the test period. Interestingly, the MC cathode bars (figure 9b) exhibit corrosion potentials that are quite similar to those at the anode throughout the test period. The fact that the MC cathode bars never reach a corrosion potential more positive then –0.275 V, exhibited by all of the other bars, indicates that the zinc is likely contributing to the performance of the system. With the exception of ECR(Chromate), the corrosion potentials exhibited by the other corrosion protection systems show a strong similarity to that of uncoated conventional reinforcement, indicating that the differences in observed corrosion rates (figures 7a and b) are primarily based on the role of the epoxy coating in limiting the exposed bar surface at both the anode and the cathode. In terms of total metal loss (tables 7a and b and figures 8a and b), that effect is significant. As a general rule in the bare bar tests, the corrosion rates for epoxy-coated reinforcement based on the area exposed at the holes through the coating (table 7b) are significantly higher than they are for conventional reinforcement based on the total area of the bar (table 7a). This behavior, however, does not necessarily mean that corrosion losses on damaged regions of epoxy-coated reinforcement are higher than local metal losses due to corrosion on uncoated conventional reinforcement because the losses recorded for uncoated conventional steel represent values that are averaged over the full contact surface. In practice, corrosion losses on uncoated bars are not uniformly distributed over the bar surface but, rather, may be much greater in some areas than others. In addition, the losses calculated for the coated bars may include losses that occur under the coating, not just on the exposed regions. The test specimens were evaluated visually following the tests, and all specimens in the group were found to exhibit significant corrosion, as shown in figures 10, 11, and 12 for conventional reinforcement, conventional ECR, and MC with only the epoxy layer penetrated, respectively. Figure 12 shows that the zinc has been fully consumed on the MC bars, in spite of the fact that the total corrosion loss on the exposed area based on the macrocell current (figure 8b) amounts to less than 6 µm for a coating that is 50 µm thick. This observation demonstrates the impact of microcell corrosion, which is not measured in this test, on the loss of the zinc, and indicates that macrocell measurements may underestimate total corrosion losses. Figure 10. Photo. Bare conventional anode bar, at 15 weeks, showing corrosion products that formed below the surface of the solution. 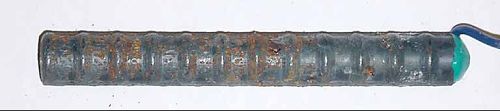 Figure 11. Photo. Bare ECR anode bar, at 15 weeks, showing corrosion products that formed at holes though the epoxy. 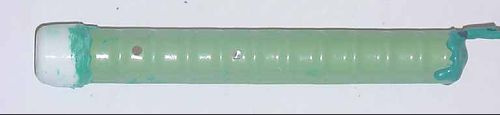 Figure 12. Photo. Bare MC anode bar with only epoxy penetrated, at 15 weeks, showing corrosion products that formed at holes though the epoxy. 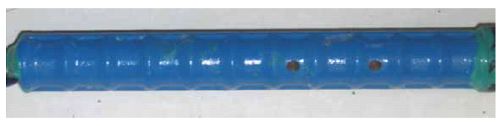 Mortar-Wrapped Bar TestsThe corrosion rates using mortar-wrapped specimens for conventional steel, conventional ECR, ECR(primer/Ca(NO2)2), and MC bars with both layers penetrated and only the epoxy penetrated are shown in figures 13a and b. In figure 13b, the corrosion rate is based on the exposed area at the holes through the coating. Figure 13a. Graph. Macrocell test—average corrosion rate. Mortar-wrapped conventional, epoxy-coated, ECR with calcium nitrite primer, and multiple coated steel in simulated pore solution with 1.6 m ion NaCl. 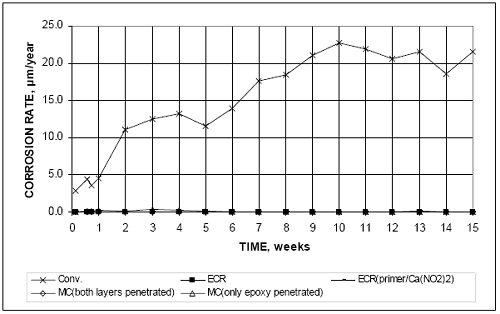 Figure 13b. Graph. Macrocell test—average corrosion rate based on area exposed at holes through coating. Mortar-wrapped conventional epoxy-coated, ECR with calcium nitrite primer, and multiple coated steel in simulated pore solution with 1.6 m ion NaCl. 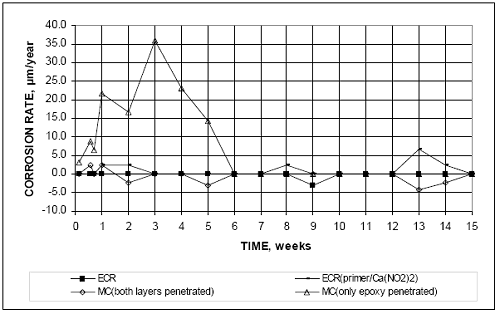 The corrosion rate based on total area for conventional steel starts at approximately 2.5 µm/yr, increasing to about 21 µm/yr at week 9, and remaining between 18 and 23 µm/yr thereafter. As shown in figure 13b, conventional ECR exhibits essentially no corrosion during the test, while the corrosion current exhibited by the other test specimens shown in the figure is relatively minor. The other systems tested, including ECR with improved adhesion [ECR(Chromate), ECR(DuPont), and ECR(Valspar)], ECR in mortar with a corrosion inhibitor (calcium nitrite, Rheocrete 222+ or Hycrete) and the three epoxies with improved adhesion in mortar with calcium nitrite, exhibited no corrosion in the test. Corrosion losses based on total and exposed area for the systems that did exhibit corrosion are shown in figures 14a and b, respectively. Corrosion losses at 15 weeks for all specimens are presented in table 7. Total losses for conventional steel amount to 4.8 µm at 15 weeks, compared to values of less than 0.02 µm based on total area for other systems and a value of less than 2 µm for the MC bars with only the epoxy penetrated and less than 0.5 µm for the other systems based on exposed area. Figure 14a. Graph. Macrocell test—average corrosion loss. Mortar-wrapped conventional, epoxy-coated, ECR with calcium nitrite, and multiple coated steel in simulated pore solution with 1.6 m ion NaCl. 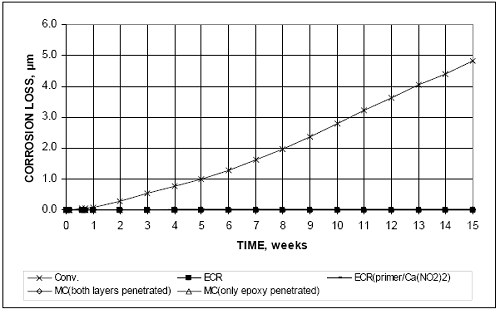 Figure 14b. Graph. Macrocell test—average corrosion loss based on area exposed at holes through coating. Mortar-wrapped conventional, epoxy-coated, ECR with calcium nitrite, and multiple coated steel in simulated pore solution with 1.6 m ion NaCl. 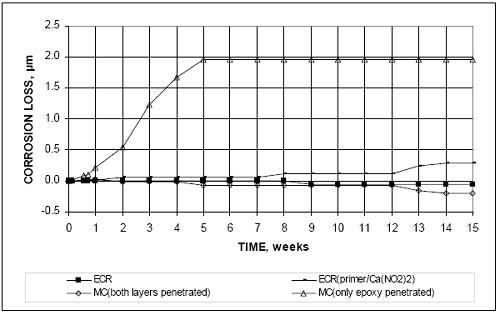 The average corrosion potentials during the tests, shown in figures 15 and 16, demonstrate that at the anode, only those steels that exhibited some corrosion loss (tables 7a and b) had corrosion potentials more negative than –0.275 V, with the exception of ECR(Chromate) in mortar containing calcium nitrite [ECR(Chromate)-DCI], which dropped below –0.275 V after week 12. The potential of the ECR(primer/Ca(NO2)2) bars, which did exhibit corrosion, dropped to approximately −0.400 V at 7 weeks, maintaining that value thereafter. The MC specimens with both layers penetrated and with only epoxy penetrated (figure 16), exhibited progressively more negative potentials as the test progressed. For MC bars with both layers penetrated, the corrosion potential started at approximately –0.400 V, dropping to a value somewhat more negative then −0.700 V at 15 weeks at both the anode and the cathode. The MC bars with only epoxy penetrated started at approximately −0.600 V, ending at a value equal to that for the same bars with both layers penetrated. The corrosion potentials of the cathodes for the MC bar tests started at only slightly more positive values than exhibited by the anodes, dropping to values between −0.600 and −0.800 V at 15 weeks. These results suggest that the MC bars started the tests in a passive condition, becoming relatively more active as the simulated pore solutions, both with and without NaCl, penetrated the mortar. The zinc provided protection during the test for both types of damage to the coating. Figure 15a. Graph. Macrocell test—average corrosion potential, anode. Mortar-wrapped conventional, epoxy-coated reinforcement, epoxy-coated reinforcement with increased adhesion, epoxy-coated reinforcement cast with corrosion inhibitor, and ECR with calcium nitrite in simulated pore solution with 1.6 m ion NaCl. 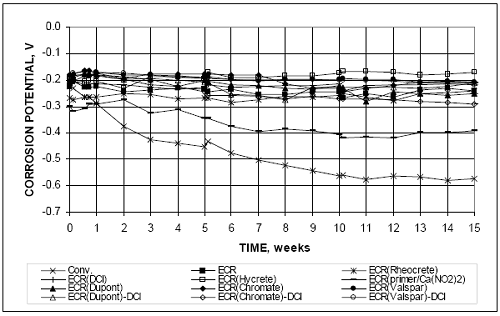 Figure 15b. Graph. Macrocell test—average corrosion potential, cathode. Mortar-wrapped conventional, epoxy-coated reinforcement, epoxy-coated reinforcement with increased adhesion, epoxy-coated reinforcement cast with corrosion inhibitor, and ECR with calcium nitrite in simulated pore solution with 1.6 m ion NaCl. 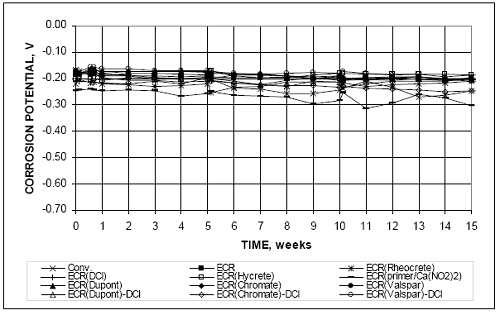 Figure 16a. Graph. Macrocell test—average corrosion potential, anode. Mortar-wrapped multiple coated steel in simulated pore solution with 1.6 m ion NaCl. 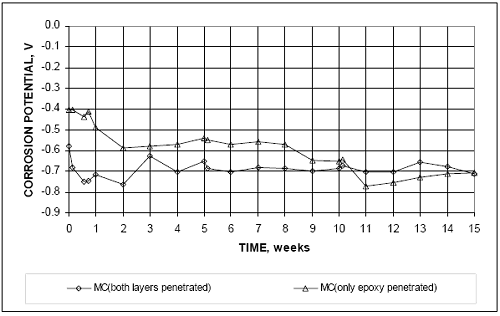 Figure 16b. Graph. Macrocell test—average corrosion potential, cathode. Mortar-wrapped multiple coated steel in simulated pore solution with 1.6 m ion NaCl. 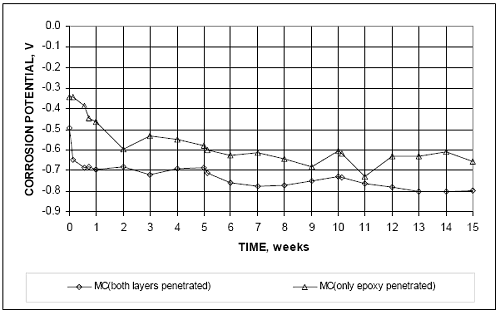 At the conclusion of the tests, the mortar was removed and the bars were inspected for evidence of corrosion. The uncoated conventional steel bars exhibited corrosion, as shown in figure 17, while none of the epoxy-coated bars exhibited any corrosion products. Figure 17. Photo. Conventional anode bar after removal of mortar, at 15 weeks. 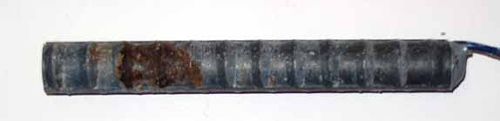 The results shown table 7 and figures 13 through 17 indicate several things about the corrosion process for steel with a damaged epoxy coating. As mentioned for the bare bar tests, the epoxy coating significantly reduces total corrosion losses. But more than that, the tests demonstrate that, even with a relatively homogenous material like the mortar used in these tests, the chloride concentrations at the surface of the bar are likely to vary, providing concentrations high enough to initiate corrosion at some locations but not high enough at all locations. This is clearly the case for mortar-wrapped conventional steel, as shown in figure 17, where the corrosion products are distributed nonuniformly across the bar surface. The exposed steel at locations where epoxy is damaged should begin to corrode at the same chloride concentration as uncoated conventional steel. When this does not occur, as demonstrated in these tests, it is likely that the chloride concentration at the location of the damaged epoxy has not reached the critical chloride threshold. Thus, even damaged epoxy-coated reinforcement will have an advantage over conventional steel because all locations that are damaged may not be subjected to chloride concentrations high enough to cause corrosion, while under the same conditions for uncoated steel, the chloride concentration would be high enough to initiate corrosion somewhere on the bars. The test results also suggest that if this test is to be used to evaluate the corrosion protection provided by damaged epoxy coating (as opposed to systems used with uncoated bars for which it provides a consistent measure of corrosion resistance(25)), the severity of the exposure conditions should be increased, such as would be provided by an increase in the number of penetrations in the epoxy or by an increase in the concentration of chloride in the solution at the anode. In the end, the test results for the mortar-wrapped rapid macrocell tests provide a general comparison of the performance of the systems under test. BENCH-SCALE TESTSThe results of the Southern Exposure (SE) and cracked beam (CB) tests provide additional insight into the performance of the corrosion protection systems that are under evaluation in this study. The tests have not been completed, but all of the bench-scale tests have been underway for at least 56 weeks, a time period that is adequate to provide a useful comparison of the systems. The systems, as reported in the following sections, are compared based on average values for three specimens for each corrosion protection system. Six specimens are used for conventional reinforcing steel and conventional ECR cast in concrete with a w/c ratio of 0.45. Southern Exposure TestsThe test results, expressed in terms of corrosion loss based on the total area of the bar in contact with concrete and on the exposed area at holes in the epoxy are presented in tables 8a and b, respectively. For these tests, the corrosion rates based on the exposed area for bars with four and 10 penetrations through the epoxy on each bar are, respectively, 480 and 192 times the corrosion rates based on total bar area. As noted in the tables, four of six specimens with conventional steel cast in concrete with w/c ratios of 0.45 (Conv.-45) and two of six specimens with conventional epoxy-coated reinforcement cast in concrete with w/c = 0.45 with four holes through the epoxy (ECR-4h-45) have not been included in the averages because the specimens have abnormally low chloride contents [below 7 kg/m3 (12 pounds per cubic yard (lb/yd3)) at 96 weeks] for the SE test. Further, even the corrosion rates exhibited by the remaining Conv.-45 specimens are only about half those exhibited by similar specimens in earlier investigations.(20,21) The difference in performance may be due to unplanned variations in concrete quality – in this case higher quality in the subject specimens. As a result, the Conv.-45 and ECR-4h-45 Southern Exposure tests are being repeated for use in the final report; the analyses that follow are based on the remaining two and four SE specimens, respectively, for Conv.-45 and ECR-4h-45. Chloride contents taken at 48 weeks and after indicate that all of the other specimens are on track to have chloride contents above 7 kg/m3 (12 lb/yd3) at 96 weeks. Full details of the chloride analyses will be presented in the final report. The variation in chloride contents and corrosion performance observed in these tests provides some insight into the variability in corrosion performance observed in the field, where bridge decks reinforced with uncoated bars have provided service lives that range from 4 to 40 years for bridges in the same environment. That variability may be due to differences in concrete quality which can significantly affect the rate of chloride penetration.
Control Tests The control tests for this study consist of conventional steel cast in concrete with w/c ratios of 0.45 (Conv.-45) and 0.35 (Conv.-35), conventional epoxy–coated reinforcement cast in concrete with w/c = 0.45 with four holes through the epoxy (ECR-4h-45) or 10 holes through the epoxy (ECR-10h-45), and conventional ECR cast in concrete with w/c = 0.35 and 10 holes through the epoxy (ECR-10h-35). The corrosion rates based on the total area of steel in contact with the concrete are shown in figure 18. The figure demonstrates that, as seen in the rapid macrocell tests, corrosion proceeds at a much higher rate for uncoated than for coated reinforcement, with the latter corroding at about one percent of the rate of the former, a rate that is equal to about twice the ratio of the area exposed at the holes to the total area of the bars. The lower w/c ratio provides additional protection for the uncoated steel, with significant corrosion starting at about 48 weeks for the concrete with a w/c ratio of 0.35, compared to 25 weeks for the concrete with a w/c ratio of 0.45. The corrosion rate for the Conv.-45 specimens reaches a maximum of 4.2 µm/yr, dropping to a value of about 2 µm/yr at 96 weeks. Over time, the corrosion rate of the Conv.-35 specimens reaches the same order of magnitude as that of the Conv.-45 specimens, and by week 72, the Conv.-35 specimens are actually corroding at a higher rate than the higher w/c ratio specimens, reaching a value of 3.8 µm/yr at 84 weeks. The average total corrosion losses for the systems are shown in figures 19a and b, which, like figure 18, shows the effect of the lower w/c ratio in delaying corrosion initiation and lowering corrosion losses. Average total losses at 84 weeks equal 2.1 and 1.25 µm for the Conv.-45 and Conv.-35 specimens, respectively. Figure 18. Graph. Southern Exposure test—average corrosion rates based on the total area for conventional and epoxy-coated reinforcement, w/c = 0.35 or 0.45, ponded with 15 percent NaCl solution. Bars with coatings contain four or 10 holes. 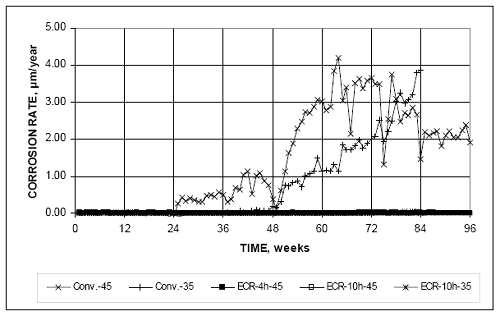 Figure 19a. Graph. Southern Exposure test—average corrosion loss based on total area for conventional and epoxy-coated reinforcement, w/c = 0.35 or 0.45, ponded with 15 percent NaCl solution. Bars with coatings contain four or 10 holes. 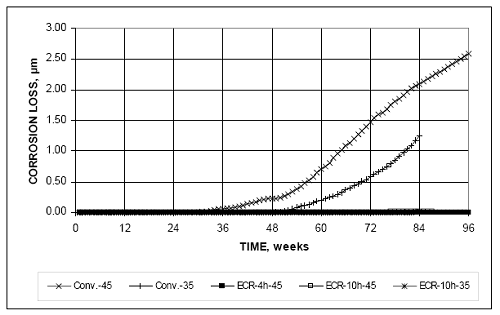 Figure 19b. Graph. Southern Exposure test—average corrosion loss based on area exposed at holes through coating for epoxy-coated reinforcement, w/c = 0.35 or 0.45, ponded with 15percent NaCl solution. Bars with coatings contain four or 10 holes. 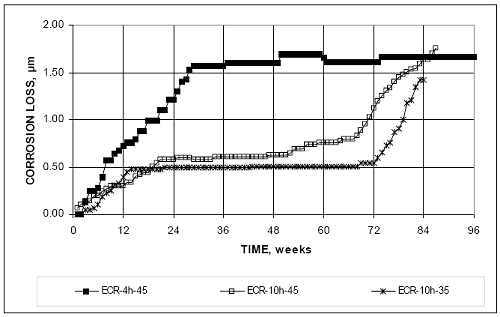 The corrosion losses for the epoxy-coated bars based on area exposed at hole through the coating (referred to in the following as the “exposed area”) are shown in figure 19b. As for conventional steel, the lower w/c ratio provides additional corrosion protection, with losses at 56 weeks for ECR-10h-35 equal to about 70 percent of the value at 56 weeks for ECR-10h-45. The corrosion of the epoxy-coated bars appears to start earlier than it does on the uncoated bars. This may be a function of the very low corrosion currents and the precision of the microvoltmeter used in the tests. After the initiation of significant corrosion in the uncoated bar specimens, however, total losses on the exposed area of the epoxy-coated bars, 0.5 to 1.7 µm, are similar to total losses on the uncoated bars, as can be seen by comparing losses at 84 weeks in figures 19a and b. For the ECR bars, the average corrosion loss based on exposed area for epoxy-coated reinforcement with four holes in the concrete with a w/c of 0.45 (ECR-4h-45) is equal to about twice that of the same bars with 10 holes at 56 weeks. As demonstrated in tables 8a and b, however, the scatter in the test results for conventional ECR is quite high (as it is for a number of other systems). As a result, the difference in corrosion rate between ECR-4h-45 and ECR-10h-45 is not statistically significant. The difference is, however, statistically significant between ECR-10h-45 and ECR-10h-35. The flat regions on corrosion loss curves shown in figure 19b may be the result of corrosion products temporarily blocking the small exposed areas on the bars. The corrosion potentials for the top and bottom mats of steel are shown in figures 20a and b. For the top mat, the average corrosion potential for ECR-10h-35 remains more positive than –0.350 V with respect to a copper-copper sulfate electrode (CSE) to date (84 weeks), indicating a low probability of corrosion. The corrosion potentials drop below –0.350 V at weeks 38, 51, 52, and 92 for Conv.-45, Conv.-35, ECR-10h-45, and ECR-4h-45, respectively. The corrosion potentials for the bottom mats of reinforcement remain more positive than –0.350 V with respect to a copper-copper sulfate electrode (CSE) throughout the tests for Conv.-35, ECR-4h-45, and ECR-10h-35. The potential drops below –0.350 V at weeks 43 and 56 for Conv.-45 and ECR-10h-45, respectively, indicating that chlorides had penetrated to the level of the bottom mat for those specimens. Figure 20a. Graph. Southern Exposure test—corrosion potential, top mat, for conventional and epoxy-coated reinforcement, w/c = 0.35 or 0.45, ponded with 15 percent NaCl solution.Bars with coatings contain four or 10 holes. 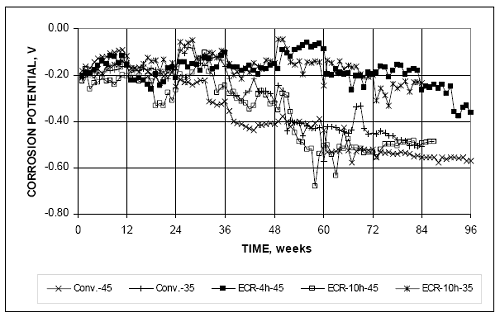 Figure 20b. Graph. Southern Exposure test—corrosion potential, bottom mat, for conventional and epoxy-coated reinforcement, w/c = 0.35 or 0.45, ponded with 15 percent NaCl solution. Bars with coatings contain four or 10 holes. 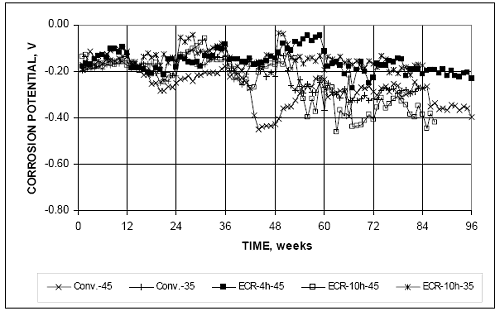 Epoxies With Improved Adhesion The corrosion losses for conventional ECR-4h-45 and ECR-10h-45 are compared with the corresponding specimens of ECR(Chromate), ECR(DuPont), and ECR(Valspar) based on total and exposed area in figures 21a and b, respectively. The figures demonstrate that increased adhesion between the epoxy and reinforcing steel provides no benefits under the exposure conditions provided by these tests. In fact, by week 64, all of the bars with the higher adhesion epoxies exhibit greater average corrosion losses on the exposed area than the conventional ECR specimens, as losses reach values above 1 µm. The higher corrosion losses, most notably for the ECR(Valspar)-4h-45 and ECR(Chromate)-10h-45 specimens, may be due to variations in chloride content along the surface of the reinforcing bars. As shown in tables 8a and b, the variability in the test results can often be explained by very high readings on a single specimen. This is true in the two cases cited. As shown in the plot of corrosion potential for the top mats of steel (figure 22), the systems exhibit average corrosion potentials below–0.350 V by 45 weeks, with the exception of conventional ECR (ECR-4h-45), which, as noted earlier, remained above this value until week 92. Figure 21a. Graph. Southern Exposure test—corrosion losses based on area exposed at holes through coating for conventional epoxy-coated and increased adhesion epoxy-coated reinforcement, w/c = 0.45, ponded with 15 percent NaCl solution. Bars with coatings contain four holes.  Figure 21b. Graph. Southern Exposure test—corrosion losses based on area exposed at holes through coating for conventional epoxy-coated and increased adhesion epoxy-coated reinforcement, w/c = 0.45, ponded with 15 percent NaCl solution. Bars with coatings contain 10 holes.  Figure 22. Graph. Southern Exposure test—corrosion potential, top mat, for conventional epoxy-coated and increased adhesion epoxy-coated reinforcement, w/c = 0.45, ponded with 15 percent NaCl solution. Bars with coatings contain four holes.  Epoxy-Coated Reinforcement Used in Conjunction With Corrosion Inhibitors The corrosion losses based on exposed area for conventional epoxy-coated reinforcement cast in concrete without a corrosion inhibitor (ECR) and cast in concrete with calcium nitrite [ECR(DCI)], Rheocrete 222+ [ECR(RH)], and Hycrete [ECR(HY)] are shown in figures 23a, b, and c for bars with four holes in the epoxy in concrete with w/c = 0.45, bars with 10 holes through the epoxy in concrete with w/c = 0.45, and bars with 10 holes cast in concrete with w/c = 0.35, respectively. The figures also include the results for conventional epoxy reinforcement with the primer containing microencapsulated calcium nitrite ECR(primer/Ca(NO2)2). The figures 23a, b, and c show that the presence of a corrosion inhibitor delays the onset of corrosion and, in most of the cases shown, results in lower corrosion losses at 56 weeks. As can be seen in table 8 and by comparing figures 21a and b with figures 23a, b, and c, the corrosion losses in the presence of corrosion inhibitors are lower than those observed for the epoxies with the improved adhesion by a factor of at least 2. The variability in the test results, as represented by the standard deviation, is similar for the two sets of data. With the exception of ECR(primer/Ca(NO2)2), the corrosion losses, whether negative or positive, for the specimens with corrosion inhibitors, are less than 1 µm at the end of 56 weeks. Negative corrosion losses in this test are due to variability in test readings and should be viewed as zero corrosion. Figures 23a, b, and c also show that a lower w/c ratio, which presumably results in a lower chloride level in the concrete due to reduced permeability, enhances the performance of the corrosion inhibitors. This observation is especially apparent for ECR(primer/Ca(NO2)2), as can be seen by comparing the corrosion losses shown in figures 23a and b (w/c = 0.45) with those Figure 23a. Graph. Southern Exposure test—corrosion losses based on area exposed at holes through coating for conventional epoxy-coated reinforcement and with inhibitors, w/c = 0.45, ponded with 15 percent NaCl solution. Bars with coatings contain four holes.  Figure 23b. Graph. Southern Exposure test—corrosion losses based on area exposed at holes through coating for conventional epoxy-coated reinforcement and with inhibitors,w/c = 0.45, ponded with 15 percent NaCl solution. Bars with coatings contain 10 holes. 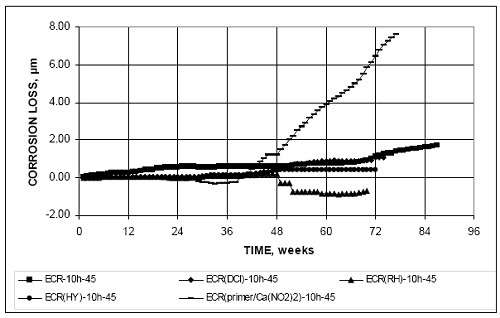 Figure 23c. Graph. Southern Exposure test—corrosion losses based on area exposed at holes through coating for conventional epoxy-coated reinforcement and with inhibitors, w/c = 0.35, ponded with 15 percent NaCl solution. Bars with coatings contain 10 holes. 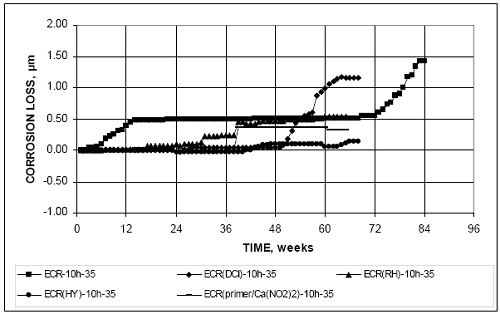 shown in figure 23c (w/c = 0.35). The differences observed in this case are likely due to the limited quantity of nitrite, which is available only from the exposed primer where the epoxy is penetrated. For w/c = 0.45, this limited quantity of nitrite is consumed in a shorter period of time than for w/c =0.35 due to the higher chloride concentration at the bar surface for the higher water-cement ratio concrete. In contrast, the quantity of available nitrite is considerably higher for all of the ECR(DCI) specimens because the calcium nitrite is added to the concrete. The corrosion potentials exhibited by the top mats in the test specimens are shown in figures 24a, b, and c. They indicate that most of the specimens experience corrosion potentials more negative than –0.350 V with respect to a CSE. The exceptions are ECR-10h-35, ECR(HY)-10h-45, and ECR(primer/Ca(NO2)2)-10h-35. Epoxy Coating With Improved Adhesion Cast in Concrete Containing Calcium Nitrite A limited number of specimens (four holes in the epoxy and concrete with w/c = 0.45) were tested for each of the three epoxies with improved adhesion cast in concrete containing calcium nitrite. As observed for the other tests with concrete containing a corrosion inhibitor, the bars with improved adhesion exhibit improved corrosion resistance in the presence of Ca(NO2)2, as shown in figure 25, and over the test periods shown, exhibit improved corrosion performance compared to conventional ECR in concrete with calcium nitrite. At 56 weeks, all losses are below 1 µm, although the losses for ECR(Valspar) appear to be increasing rapidly. The scatter in the data shown in table 8 indicates that these values do not differ in a statistically meaningful way from each other. Figure 24a. Graph. Southern Exposure test—corrosion potential, top mat, for conventional epoxy-coated reinforcement with and without corrosion inhibitor, w/c = 0.45, ponded with 15 percent NaCl solution. Bars with coatings contain four holes. 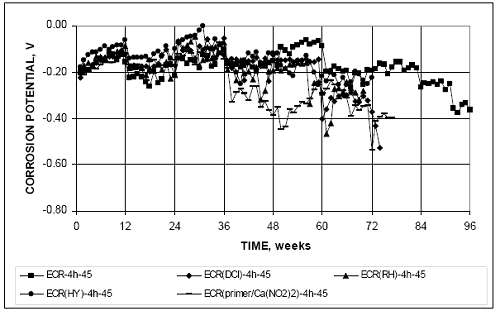 Figure 24b. Graph. Southern Exposure test—corrosion potential, top mat, for conventional epoxy-coated reinforcement with and without corrosion inhibitor, w/c = 0.45, ponded with 15 percent NaCl solution. Bars with coatings contain 10 holes. 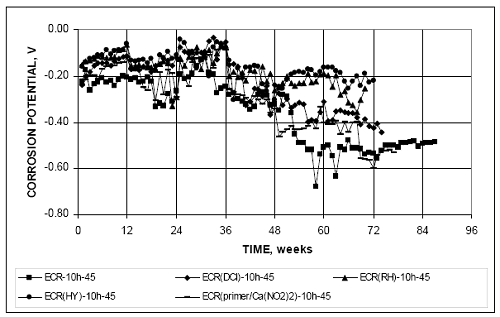 Figure 24c. Graph. Southern Exposure test—corrosion potential, top mat, for conventional epoxy-coated reinforcement with and without corrosion inhibitor, w/c = 0.35, ponded with 15 percent NaCl solution. Bars with coatings contain 10 holes.  Figure 25. Graph. Southern Exposure test—average corrosion losses based on area exposed at holes through coating for conventional epoxy-coated and epoxy-coated rebar with and without increased adhesion and DCI-S corrosion inhibitor, w/c = 0.45, ponded with 15 percent NaCl solution. Bars with coatings contain four drilled holes.  Figure 26. Graph. Southern Exposure test—corrosion potential, top mat, for conventional epoxy-coated reinforcement with and without DCI-S corrosion inhibitor and increased epoxy-coated reinforcement with DCI-S corrosion inhibitor, w/c = 0.45, ponded with 15 percent NaCl solution. Bars with coatings contain four holes.  The corrosion potentials for the top mats in these tests are shown in figure 26. The average corrosion potential of the ECR(DCI)-4h-45 specimens drops below –0.350 V at 60 weeks. The potential of the other bars remain above that value to date (56 weeks). Bars with Multiple Coatings The corrosion losses for the multiple coated (MC) bars are compared with those for conventional ECR in figures 27a and b for bars with four and 10 holes, respectively. The specimens with the MC bars consistently exhibit greater corrosion losses than those with conventional ECR. The multiple coated bars with both layers penetrated exhibit average corrosion losses on the exposed area of 9.4 µm (for four holes) and 23.7 µm (for 10 holes) at 56 weeks compared to values of 1.45 and 0.74 µm for conventional ECR. The respective values with only the epoxy penetrated are 2.9 and 3.1 µm, as shown in figures 27a and b and table 8b. The average corrosion potentials for the top and bottom mats are shown in figures 28 and 29 for bars with 4 and 10 holes to the epoxy, respectively. The top mat corrosion potentials (figures 28a and 29a) are similar for the cases in which both layers are penetrated and only the epoxy penetrated, differing most widely during the first 10 to 20 weeks of the test. For the top mats, the values are, in general, more negative than those for conventional ECR, which appears to remain passive (more positive than–0.350 V with respect to a CSE until week 92). The values for the MC bars range between –0.200 and –0.500 V between the beginning of the test and week 10, stabilizing between –0.500 and –0.600 V after week 20. It is not clear at this point if this means that the steel is actively corroding or if the zinc is providing protection. A better evaluation will be possible following the conclusion of the tests to determine if the zinc is intact. Figure 27a. Graph. Southern Exposure test—corrosion loss based on area exposed at holes through coating for conventional epoxy-coated and multiple-coated reinforcement, w/c = 0.45, ponded with 15 percent NaCl solution. Bars with coatings contain four holes.  Figure 27b. Graph. Southern Exposure test—corrosion loss based on area exposed at holes through coating for conventional epoxy-coated and multiple-coated reinforcement, w/c = 0.45, ponded with 15 percent NaCl solution. Bars with coatings contain 10 holes. 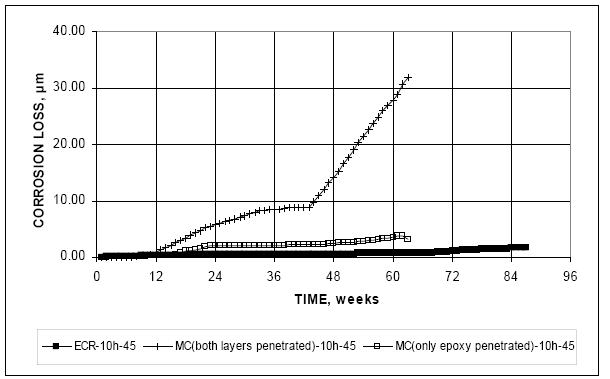 Figure 28a. Graph. Southern Exposure test—corrosion potential, top mat, for conventional epoxy-coated and multiple-coated reinforcement, w/c = 0.45, ponded with 15 percent NaCl solution. Bars with coatings contain four holes. 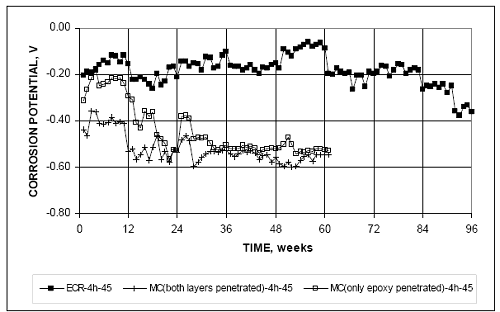 Figure 28b. Graph. Southern Exposure test—corrosion potential, bottom mat, for conventional epoxy-coated and multiple-coated reinforcement, w/c = 0.45, ponded with 15 percent NaCl solution. Bars with coatings contain four holes. 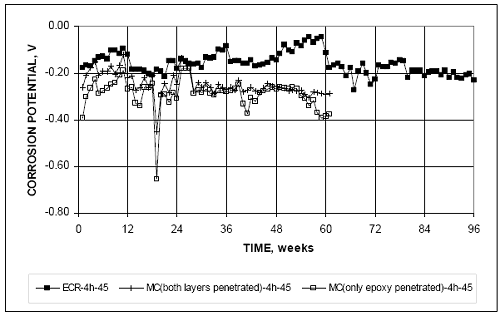 Figure 29a. Graph. Southern Exposure test—corrosion potential, top mat, for conventional epoxy-coated and multiple-coated reinforcement, w/c = 0.45, ponded with 15 percent NaCl solution. Bars with coatings contain 10 holes. 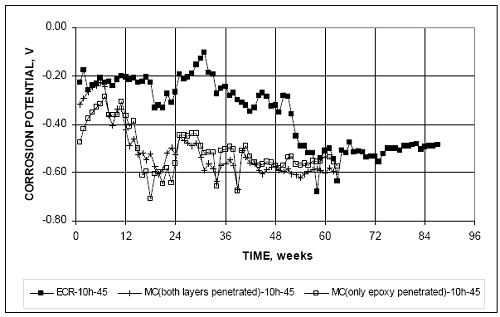 Figure 29b. Graph. Southern Exposure test—corrosion potential, bottom mat, for conventional epoxy-coated and multiple-coated reinforcement, w/c = 0.45, ponded with 15 percent NaCl solution. Bars with coatings contain 10 holes. 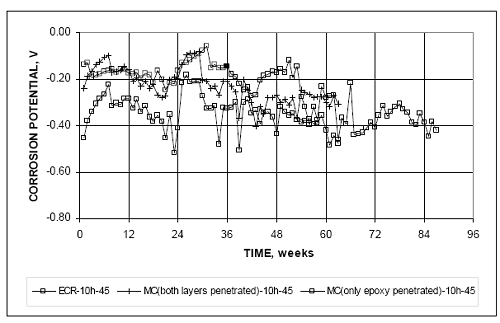 Cracked Beam TestsThe performance of the corrosion protection systems based on the cracked beam test is presented in this section. The losses at 56 weeks based on total area and exposed area on the ECR bars are summarized in tables 9a and b. Control Tests The corrosion rates and corrosion losses based on the total area of the reinforcing bars are shown in figures 30 and 31a, respectively, for cracked beam specimens with conventional reinforcing steel and conventional epoxy-coated reinforcement steel. The specimens with epoxy-coated reinforcement have four or 10 holes through the epoxy for concrete with a w/c ratio of 0.45 and 10 holes through the epoxy for concrete with a w/c ratio of 0.35. Because the simulated crack provides direct access of the 15 percent NaCl solution to the top reinforcing bars, significant corrosion rates, on the order of 10 µm/yr, are observed early in the test for specimens containing conventional steel at both w/c ratios. Throughout the test period, the lower w/c ratio appears to provide some protection, likely the result of lower concrete permeability, which reduces access of oxygen and moisture to the cathode. At both w/c ratios, however, the corrosion rate is significant, with average rates on the order of 6 to 9 µm/yr for the w/c = 0.45 specimens and 2 to 5 µm/yr for the w/c = 0.35 specimens after week 10. The corrosion rates decrease from the high initial values as a result of the accumulation of corrosion products within the crack. Occasionally, individual specimens exhibit large increases in corrosion rate. This increase is due to the accumulated corrosion products exerting enough stress on the concrete to again open the crack, providing direct access of the NaCl solution to the top reinforcing bar. Overall, figures 30 and 31a indicate some advantage of a lower w/c ratio, even for cracked concrete, and a significant reduction in corrosion loss provided by epoxy coating. Corrosion losses as a function of exposed area are plotted versus time for the epoxy-coated specimens in figure 31b. The bars with 10 holes cast in concrete with a w/c of 0.35 (ECR-10h-35) exhibit two to three times the losses of the same bars cast in concrete with a w/c ratio of 0.45 (ECR-10h-45). The bars with four holes in concrete with a w/c of 0.45 (ECR-4h-45) exhibit corrosion losses between those of the other two specimen types. The results represent the average of six specimens for ECR-4h-45 and three specimens for the others. For the epoxycoated bars, there does not appear to be an advantage based on a reduced w/c ratio. The corrosion losses for the ECR bars based on exposed area are one to four times the average values observed for the uncoated conventional bars.
Figure 30. Graph. Cracked beam test—average corrosion rates based on the total area of control specimens for conventional and epoxy-coated reinforcement, w/c = 0.35 or 0.45, ponded with 15 percent NaCl solution. Bars with coatings contain four or 10 holes. 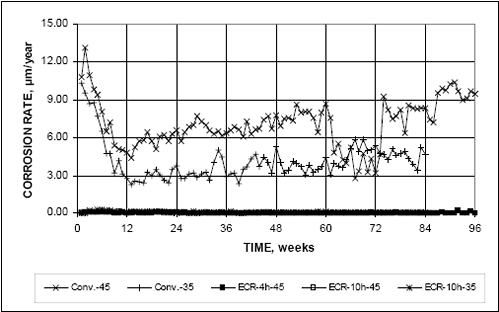 Figure 31a. Graph. Cracked Beam test—average corrosion loss based on total area of control specimens for conventional and epoxy-coated reinforcement, w/c = 0.35 or 0.45, ponded with 15 percent NaCl solution. Bars with coatings contain four or 10 holes. 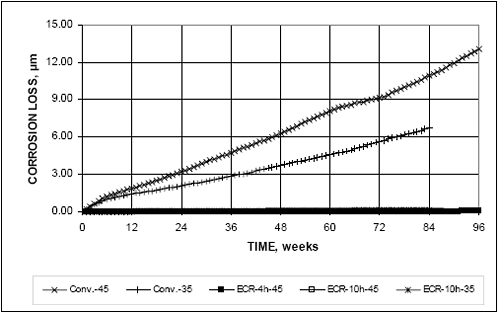 Figure 31b. Graph. Cracked Beam test—average corrosion loss based on area exposed at holes through coating for epoxy-coated reinforcement, w/c = 0.35 or 0.45, ponded with 15 percent NaCl solution. Bars with coatings contain four or 10 holes. 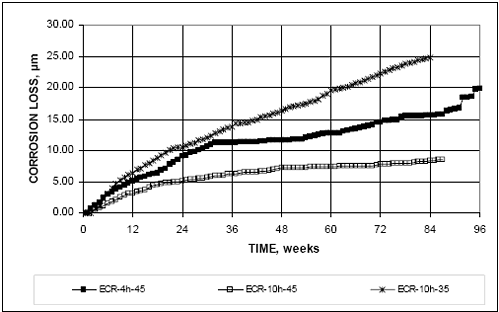 Epoxies With Improved Adhesion The total corrosion losses based on exposed area for the bars coated with the improved adhesion epoxies are compared with losses for conventional ECR in figures 32a and b for bars with four and 10 holes, respectively. As observed in the Southern Exposure test, these results indicate that the improved adhesion epoxies provide no advantage with respect to conventional ECR under these severe exposure conditions. In fact, the corrosion losses for the bars with the improved adhesion epoxy are at least twice those for the bars with conventional epoxy with both four (24.0 to 33.7 µm versus 12.4 µm) and 10 holes (15.4 to 22.6 µm versus 7.3 µm). Figure 32a. Graph. Cracked Beam test—average corrosion loss based on area exposed at holes through coating for conventional epoxy-coated and increased adhesion epoxy-coated reinforcement, w/c = 0.45, ponded with 15 percent NaCl solution. Bars with coatings contain four holes. 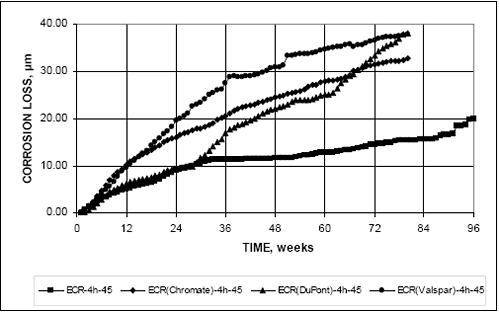 Figure 32b. Graph. Cracked Beam test—average corrosion loss based on area exposed at holes through coating for conventional epoxy-coated and increased adhesion epoxy-coated reinforcement, w/c = 0.45, ponded with 15 percent NaCl solution. Bars with coatings contain 10 holes. 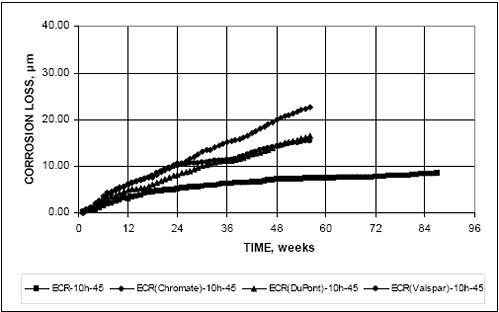 Epoxy-Coated Reinforcement Used in Conjunction With Corrosion Inhibitors Corrosion losses for cracked beam specimens with conventional ECR cast in concrete with corrosion inhibitors or for ECR bars with the primer containing microencapsulated calcium nitrite are shown in figures 33a, b, and c for specimens with four and 10 holes through the epoxy on bars cast in concrete with w/c = 0.45 and bars with 10 holes through the epoxy cast in concrete with w/c = 0.35, respectively. Unlike the results for intact concrete in the Southern Exposure tests, the presence of a corrosion inhibitor does not provide an advantage in cracked concrete, where chlorides have direct access to the reinforcing steel. Except for the ECR (DCI)- 4h-45 and ECR (primer/Ca(NO2)2)-4h-45), at 56 weeks, the corrosion losses are the same or greater for the specimens with a corrosion inhibitor in the concrete than for the conventional ECR specimens. Figure 33a. Graph. Cracked Beam test—average corrosion loss based on area exposed at holes through coating for conventional epoxy-coated reinforcement with and without corrosion inhibitor, w/c = 0.45, ponded with 15 percent NaCl solution. Bars with coatings contain four holes. 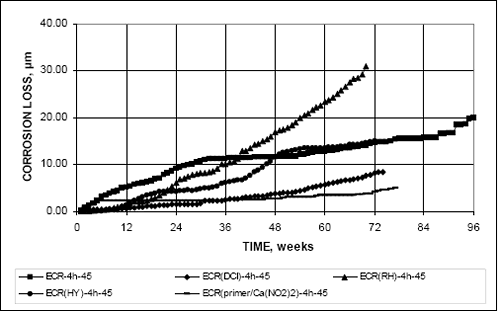 Figure 33b. Graph. Cracked Beam test—average corrosion loss based on area exposed at holes through coating for conventional epoxy-coated reinforcement with and without corrosion inhibitor, w/c = 0.45, ponded with 15 percent NaCl solution. Bars with coatings contain 10 holes. 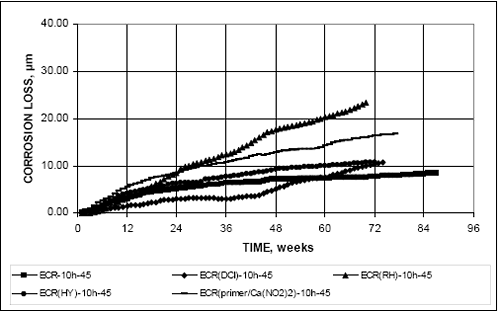 Figure 33c. Graph. Cracked Beam test—average corrosion loss based on area exposed at holes through coating for conventional epoxy-coated reinforcement with and without corrosion inhibitor, w/c = 0.35, ponded with 15 percent NaCl solution. Bars with coatings contain 10 holes.  Bars With Multiple Coatings The corrosion losses for the bars with multiple coatings are compared with those for conventional ECR in figures 34a and b for bars with 4 and 10 penetrations, respectively. Both figures show that the highest corrosion losses were attained by the MC bars with both layers penetrated followed by those with only the epoxy layer penetrated and, in turn, by conventional ECR. For the specimens with four holes in the epoxy coating, the respective losses based on exposed area are 72, 55, and 12 µm at 56 weeks. For specimens with ten holes, the respective values are 52, 24, and 7 µm at 56 weeks. Corrosion losses less than 50 µm, the thickness of the zinc coating, may indicate that the coating has not been penetrated, but as observed for the rapid macrocell specimens, the values shown here may not reflect the effects of microcell corrosion which could increase the metal loss. Losses greater than 50 µm, may indicate that the coating has been penetrated, but may also be indicative of zinc corrosion under the epoxy layer. Actual behavior will become apparent only after the tests have been completed and the specimens are autopsied. Under any circumstances, it is clear that the total losses for the MC bars exceed those observed for ECR and for most of the combinations of ECR with the other corrosion protection systems evaluated in this study. The corrosion potentials for these specimens are shown in figures 35 and 36 for bars with four and 10 holes through the epoxy coating, respectively. In both cases, the top bars reach a potential of approximately –0.600 V and sustain that value throughout most of the test period, while the corrosion potential of the bottom bars remains between –0.200 and –0.400 V for most of the test (generally more positive than observed for the SE tests). The similarity in the potentials of the top bars seems to indicate that the zinc layer is consumed relatively rapidly and that the performance of the exposed regions of the MC bars is being dominated by exposed steel. Figure 34a. Graph. Cracked Beam test—average corrosion loss based on area exposed at holes through coating for conventional epoxy-coated and multiple-coated reinforcement, w/c = 0.45, ponded with 15 percent NaCl solution. Bars with coatings contain four holes.  Figure 34b. Graph. Cracked Beam test—average corrosion loss based on area exposed at holes through coating for conventional epoxy-coated and multiple-coated reinforcement, w/c = 0.45, ponded with 15 percent NaCl solution. Bars with coatings contain 10 holes.  Figure 35a. Graph. Cracked beam test—corrosion potential, top mat, for conventional epoxy-coated and multiple-coated reinforcement, w/c = 0.45, ponded with 15 percent NaCl solution. Bars with coatings contain four holes.  Figure 35b. Graph. Cracked beam test—corrosion potential, bottom mat, for conventional epoxy-coated and multiple-coated reinforcement, w/c = 0.45, ponded with 15 percent NaCl solution. Bars with coatings contain four holes. 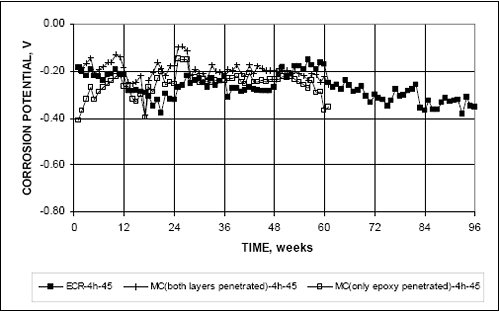 Figure 36a. Graph. Cracked beam test—corrosion potential, top mat, for conventional epoxy-coated and multiple-coated reinforcement, w/c = 0.45, ponded with 15 percent NaCl solution. Bars with coatings contain 10 holes. 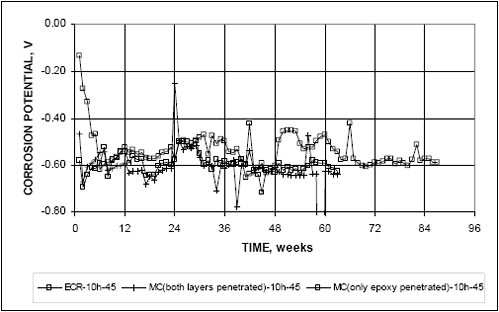 Figure 36b. Graph. Cracked beam test—corrosion potential, bottom mat, for conventional epoxy-coated and multiple-coated reinforcement, w/c = 0.45, ponded with 15 percent NaCl solution. Bars with coatings contain 10 holes. 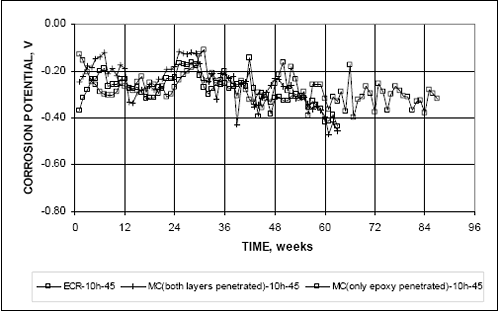 Figure 37a. Graph. Linear polarization test results for Southern Exposure specimens— average corrosion loss based on total area for conventional reinforcement and conventional epoxy-coated reinforcement, w/c = 0.35 or 0.45, ponded with 15 percent NaCl solution. Bars with coatings contain four or 10 holes. 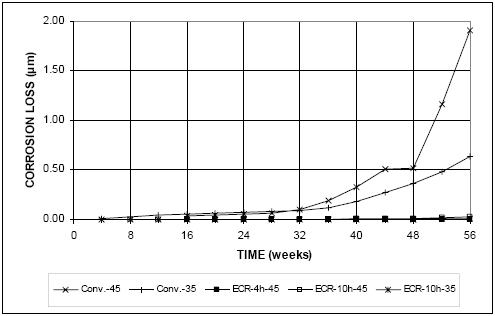 LINEAR POLARIZATION RESISTANCE TESTSLinear polarization resistance tests provide values of microcell corrosion rates, usually expressed as microcell corrosion current density. For ease of comparison with the macrocell results presented earlier in this chapter, the corrosion current densities are converted to corrosion rates using Eq. (1) or (2) and integrated to obtain corrosion losses. As an example, the microcell corrosion losses for conventional steel (Conv.-45 and Conv.-35) and conventional epoxy-coated reinforcement (ECR-4h-45, ECR-10h-45, and ECR-10h-35) in the Southern Exposure tests are shown in figure 37a and b. The macrocell losses at 56 weeks for the Southern Exposure and cracked beam tests are summarized in table 10 based on both total and exposed area. For comparison, the average macrocell losses at 56 weeks presented in tables 8 and 9 are shown side by side with the microcell losses. As would be expected, the losses based on the linear polarization results are, in most cases, higher than those obtained based on macrocell current. This is true in 23 out of 30 cases for the Southern Exposure test and in 26 out of 27 cases for the cracked beam test. As observed for macrocell losses, corrosion losses are noticeably higher for the cracked beam test than for the Southern Exposure test. The combined results for microcell and macrocell corrosion are shown for the Southern Exposure tests in figures 38a and b (w/c = 0.45) and for the cracked beam tests in figure 39 (w/c = 0.45 and 0.35). Losses for conventional steel are based on total area, while the losses for Figure 37b. Graph. Linear polarization test results for Southern Exposure specimens—average corrosion loss based on total area for conventional reinforcement and conventional epoxy-coated reinforcement, w/c = 0.35 or 0.45, ponded with 15 percent NaCl solution. Bars with coatings contain four or 10 holes.  epoxy-coated reinforcement are based on the area exposed at holes through the coating and represent the average of specimens with four and 10 holes. The figures demonstrate that the corrosion losses for conventional reinforcement based on total area are of the same order of magnitude as those for ECR based on exposed area, but as discussed for the bare bar rapid macrocell tests, the average corrosion losses based on total area for uncoated steel bars are generally lower than those based on exposed area for epoxy-coated bars. figures 38a and b and 39 also demonstrate that, overall, the relative performance of the systems is similar whether based on the microcell or macrocell corrosion current. Total losses are highest for the multiple coated (MC) bars and significantly lower for the other systems in intact concrete, as shown in figures 38a and b. These figures do not show the results at 56 weeks for the Southern Exposure specimens with concrete with a w/c ratio of 0.35; if plotted, those results would appear in a tight grouping with macrocell losses between 0.0 and 0.6 µm and microcell losses between 0.2 and 2.2 µm. Figures 38 and 39 illustrate the relative performance of the systems – with the more effective systems exhibiting data points closer to the origin. Based on corrosion losses, all of the systems under test appear to perform well in intact concrete, with the exception of the MC bars. The same statement cannot be made based on losses in cracked concrete, as demonstrated by wide scatter in both microcell and macrocell corrosion exhibited by the systems, as shown in figure 39. For the MC bars, a final judgment must await visual inspection of the bars at the conclusion of the 96-week test period. As will be discussed in chapter 4, however, the tests demonstrate that most of the systems under evaluation will serve well in practice.
Figure 38a. Graph. Southern Exposure specimens—microcell versus macrocell corrosion loss based on total area for conventional reinforcement and area exposed at holes through coating for epoxy-coated reinforcement, w/c = 0.45, ponded with 15 percent NaCl solution. Results for epoxy-coated bar specimens based on average results for bars with coatings containing four and 10 holes.  Figure 38b. Graph. Southern Exposure specimens—microcell versus macrocell corrosion loss based on total area for conventional reinforcement and area exposed at holes through coating for epoxy-coated reinforcement, w/c = 0.45, ponded with 15 percent NaCl solution.  Results for epoxy-coated bar specimens based on average results for bars with coatings containing four and 10 holes. Figure 39. Graph. Cracked beam specimens—microcell versus macrocell corrosion loss based on total area for conventional reinforcement and area exposed at holes through coating for epoxy-coated reinforcement, w/c = 0.45 or 0.35, ponded with 15 percent NaCl solution. Results for epoxy-coated bar specimens with w/c = 0.45 based on average results for bars with coatings containing four and 10 holes. |
|||||||||||||||||||||||||||||||||||||||||||||||||||||||||||||||||||||||||||||||||||||||||||||||||||||||||||||||||||||||||||||||||||||||||||||||||||||||||||||||||||||||||||||||||||||||||||||||||||||||||||||||||||||||||||||||||||||||||||||||||||||||||||||||||||||||||||||||||||||||||||||||||||||||||||||||||||||||||||||||||||||||||||||||||||||||||||||||||||||||||||||||||||||||||||||||||||||||||||||||||||||||||||||||||||||||||||||||||||||||||||||||||||||||||||||||||||||||||||||||||||||||||||||||||||||||||||||||||||||||||||||||||||||||||||||||||||||||||||||||||||||||||||||||||||||||||||||||||||||||||||||||||||||||||||||||||||||||||||||||||||||||||||||||||||||||||||||||||||||||||||||||||||||||||||||||||||||||||||||||||||||||||||||||||||||||||||||||||||||||||||||||||||||||||||||||||||||||||||||||||||||||||||||||||||||||||||||||||||||||||||||||||||||||||||||||||||||||||||||||||||||||||||||||||||||||||||||||||||||||||||||||||||||||||||||||||||||||||||||||||||||||||||||||||||||||||||||||||||||||