Performance Evaluation of One-Coat Systems for New Steel Bridges
CHAPTER 3. RESULTS AND DISSCUSION
3.1 CHARACTERIZATION OF COATING SYSTEMS
All coating systems before ALT and outdoor exposure tests were characterized for the
following properties:
-
Volatile and pigment contents.
- Major elemental content (wt percent of extracted pigment).
- FTIR and AR/AL.
- Sag resistance.
- Drying time.
- DFT
Volatile and Pigment Contents
Table 4 lists the volatile, solid, pigment, and binder contents by wt percentage for all one-coat systems. Five one- coat systems, SLX, EM, HRCSA, ASP, and UM, contained solids greater
than 70 wt percent, while the remaining three, HBAC, GFP, and WBEP, had solid content in the range of 56-67 wt percent. The pigment content ranged between 27 and 39 wt percent except for GFP, which had a pigment content of 19 wt percent.
Table 4. Volatile, solid, pigment, and binder contents.
Parameter
(wt percentage) |
ASP |
EM |
HRCSA |
GFP |
HBAC |
WBEP |
SLX |
UM |
| Volatile |
23 |
11 |
23 |
35 |
33 |
43 |
8 |
24 |
| Solid |
77 |
89 |
77 |
65 |
67 |
57 |
92 |
76 |
| Pigment |
38 |
39 |
27 |
19 |
27 |
31 |
30 |
29 |
| Binder |
39 |
50 |
50 |
46 |
40 |
26 |
62 |
47 |
Pigment volume concentration is an important parameter in coating formulation because it affects the coating film properties such as gloss, permeability, and blistering resistance.(34)
Table 4 lists the pigment and binder contents in weight percentage. These data can be used as references when selecting coating systems.
Major Elemental Compositions of Pigment Fractions
Table 5 lists the major elemental contents obtained from SEM/EDS analysis. Zinc, iron, aluminum, phosphorus, titanium, silicon, and calcium were present in almost every one-coat system. Pigments in coatings can usually be divided into three categories.(34) The prime pigments represented by titanium oxide and iron oxide provide opacity, color, and protection of the resin against UV light. Additionally, functional pigments, such as anticorrosive inhibitors, provide corrosion resistance. Zinc, aluminum, ferrous, and calcium in the forms of phosphates, borates, and molybdates are common nontoxic anticorrosive pigments. Metallic pigments, such as aluminum and zinc, are also used as inhibitive pigments. Extender pigments, such as calcium carbonate and silica, are used to build the pigment volume and control the physical properties of the coating film.
Table 5. Major elemental contents in one-coat systems of extracted pigments.
| Coating System |
Element Content (wt percentage) |
| Aluminum |
Silicon |
Phosphorus |
Calcium |
Titanium |
Iron |
Zinc |
| ASP |
6 |
13 |
2 |
0 |
5 |
0 |
38 |
| EM |
57 |
16 |
0 |
0 |
0 |
1 |
0 |
| HRCSA |
5 |
4 |
4 |
11 |
11 |
1 |
14 |
| GFP |
5 |
37 |
0 |
4 |
21 |
7 |
0 |
| HBAC |
3 |
2 |
3 |
8 |
15 |
1 |
23 |
| WBEP |
4 |
21 |
2 |
5 |
10 |
3 |
13 |
| SLX |
5 |
2 |
3 |
0 |
44 |
0 |
17 |
| UM |
7 |
2 |
5 |
0 |
35 |
2 |
15 |
All one-coat systems, except for EM, have demonstrated presence of titanium as the prime pigment. ASP, HRCSA, HBAC, WBEP, SLX, and UM contained a significant amount of zinc
(13-38 wt percent), phosphorus (2-5 wt percent), and aluminum (3-7 wt percent). Based on the elemental content, it is reasonable to assume that some forms of zinc phosphate and/or aluminum zinc phosphate were the major inhibitive pigments present in these one-coat systems. There was
no zinc or phosphorus detected in EM and GFP. Aluminum (57 wt percent) was the major anticorrosive element in EM. GFP had a certain amount of aluminum and iron, both of which are anticorrosive elements. Silicon, as an extender pigment, was present in all of the one-coat systems in various weight percentages (4-37 wt percent). GFP contained the largest amount of silicon (37 wt percent), which was assumed to be from the glass flake used to reinforce the coating. Several one-coat systems contained calcium, which acts as an anticorrosive pigment or
extender pigment.
FTIR
Figure 11 shows a typical FTIR spectrum of the three-coat system with characterization peaks before ALT. FTIR spectra of all one-coat systems before and after ALT were recorded for chemical analysis.
Aromaticity, or presence of AR compounds in a coating system, is indicated by the ratio of FTIR peak area of AR (wave number range of 3,100 to 3,000 cm-1) to AL (wave number range of 3,000 to 2,800 cm-1). This ratio is denoted by (AR/alophaticity (AP)) x 100 in table 6. Presence of AR compounds can result in reduced weathering performance in outdoor exposure conditions since UV light causes modified surface appearance of aromatic coatings due to yellowing and/or chalking. The binder of several coating systems (three-coat, EM, GFP, HBAC, WBEP, SLX, and UM) consisted of some degrees of aromaticity, which typically reduces the weatherability of these coating systems. The AR/AP ratio of all one-coat systems in table 6, when correlated with gloss reduction, demonstrated that higher AR/AP resulted in higher gloss reduction
(see figure 78).
Figure 11. Graph. FTIR spectrum of three-coat system (top coat) before ALT.
Table 6. FTIR AR/AP peak ratio of coating systems.
| Coating System |
AR/AP x 100 |
| Three-coat |
2.3 |
| Two-coat |
0 |
| ASP |
0 |
| EM |
5.2 |
| HRCSA |
0 |
| GFP |
4.5 |
| HBAC |
2.5 |
| WBEP |
4.5 |
| SLX |
1.5 |
| UM |
1.5 |
No AR peaks were detected in the two-coat control system, ASP, or HRCSA. The epoxy coating systems (EM and WBEP) and GFP had the largest amounts of aromaticity indicated by AR/AP greater than 4.5. UM, SLX, the three-coat system, and HBAC were more AL in nature, as indicated by their AR/AP ratios between 1.5 and 2.5.
There were no significant differences between the FTIR spectra obtained before and after ALT. Several spectra of tested panels indicated a few small peaks and some degrees of resolution at certain wave numbers, which may be attributed to possible coating deterioration. The differences in spectra before and after ALT were predominant for the two epoxy coating systems (EM and WBEP) in comparison to the others.
Sag Resistance
SLX sagged at a thickness of 10 mil (254 μm), while UM sagged at 7 mil (177.8 μm). Wet film thickness values for the coating systems were calculated based on DFTs and solid content. The highest wet film thicknesses recommended by the manufacturers were 7.8 mil (198.12 μm) for SLX and 7.9 mil (200.66 μm) for UM, respectively. SLX did not sag at the specified wet film thickness; however, UM sagged at the high end of the manufacturer-recommended wet film thickness. The horizontal antisag indexes of these two systems are shown in table 7. All other coating systems did not sag even at 24 mil (609.6 μm), indicating that these systems had good sag resistance.
Table 7. Horizontal antisag index of SLX and UM
| Antisag Parameter |
Coating System |
| SLX |
UM |
| Index-stripe number |
8 |
6 |
| Post-index stripe |
10 |
7 |
| Addendum fraction |
0 |
0.6 |
| Index addendum |
0 |
0.6 |
| Antisag index |
8 |
6.6 |
Drying Time
Drying time is an important coating property because slow drying coatings lower the productivity in shop applications. In the field, slow drying coatings delay inspections. Table 8 lists the mean dry-to-touch time and the dry-through (dry-to-handle) time of one-coat systems obtained at 77 ±35.6 °F (25 ±2 °C) and 50 ±2 percent relative humidity. Except for HRCSA, all
one-coat systems are considered fast drying systems. The two waterborne coating systems, HBAC and WBEP, were the fastest drying one-coat systems with dry-to-touch times of 0.7 h or less and a dry-through time of 3.6 h or less.
Table 8. Mean drying time.
| Coating System |
Dry-to-touch Time (hours) |
Dry-through Time (hours) |
| ASP |
2.5 |
5 |
| EM |
2.8 |
5 |
| HRCSA |
48 |
>240 |
| GFP |
1.7 |
3.2 |
| HBAC |
0.7 |
3.5 |
| WBEP |
0.5 |
3.6 |
| SLX |
3.8 |
6.3 |
| UM |
3.8 |
9 |
HRCSA had the longest dry-to-touch time of 48 h, and it had not reached the status of dry-to-handle even after 240 h of testing. The long set-to-touch time and the long dry-through time can be a serious field drawback, and such slow drying time should be considered prior to application.
DFT
The initial DFT of the one-coat systems and the two controls are listed in table 9. The standard deviation and CV are also listed. The measured DFTs were within the range of the manufacturer-recommended target DFTs except for HBAC, which was about 3 mil (76.2 μm) thicker than the manufacturer-recommend DFT. Figure 12 shows the plot of the DFT data.
Table 9. Mean DFT.
| Coating System |
Mean (mil) |
Standard Deviation (mil) |
CV
(percent) |
| Three-coat |
13.7 |
0.5 |
3.6 |
| Two-coat |
12.8 |
1.5 |
11.7 |
| ASP |
21.5 |
1.5 |
7.0 |
| EM |
9.3 |
0.7 |
7.5 |
| HRCSA |
10.6 |
0.5 |
4.7 |
| GFP |
20.2 |
1.3 |
6.4 |
| HBAC |
10.4 |
1.7 |
16.3 |
| WBEP |
11.8 |
1.9 |
16.1 |
| SLX |
6.7 |
0.9 |
13.4 |
| UM |
5.6 |
0.7 |
12.5 |
Figure 12. Graph. DFT data for the 10 coating systems.
The three-coat system had a DFT of 13.7 mil (347.98 μm), and the two-coat control had a DFT of 12.8 mil (325.12 μm). The DFT of the one-coat systems varied significantly: ASP and GFP had the highest DFTs with an average around 20 mil (508). UM had the lowest DFT of 5.6 mil (142.24 μm), followed by SLX with a DFT of 6.7 mil (170.18 μm). The other one-coat systems had DFTs near 10 mil (254 μm). It should be noted that even though UM had the thinnest DFT, as specified in its product data sheet, this coating system developed many surface blisters and rust pits after 4,320 h of ALT in addition to significant rust creepage at the scribe. These poor performance indicators could be attributed to the insufficient DFT value.
3.2 ALT AND OUTDOOR EXPOSURE TESTING
Performance of the test coating systems in ALT, ME, NW, and NWS was evaluated using the following parameters:
- Gloss reduction.
- Change of color.
- Change of pencil scratch hardness.
- Change of adhesion strength.
- Development of surface defects and holidays.
- Growth of rust creepage at the scribe.
Gloss Reduction
Overall gloss reduction values are summarized in table 10 and shown in the graph in figure 13.
Table 10. Summary of mean gloss reduction data.
| Coating System |
Exposure Condition (percent) |
| ALT |
ME |
NW |
NWS |
| Three-coat |
50.9 |
28.9 |
29.5 |
14.2 |
| Two-coat |
60.3 |
91.5 |
39.0 |
34.5 |
| ASP |
27.6 |
52.7 |
10.1 |
15.0 |
| EM |
99.0 |
97.7 |
96.9 |
97.3 |
| HRCSA |
66.7 |
30.6 |
81.9 |
74.1 |
| GFP |
41.6 |
|
|
|
| HBAC |
79.5 |
29.2 |
24.4 |
16.5 |
| WBEP |
77.8 |
66.9 |
59.3 |
63.8 |
| SLX |
18.5 |
32.8 |
20.6 |
12.4 |
| UM |
23.8 |
4.3 |
1.5 |
0.5 |
Figure 13. Graph. Mean gloss reduction data.
The initial measurements before exposure exhibited a broad range of gloss values. GFP was a flat coating with a low gloss of 4.6; EM, SLX, and UM were highly glossy (78-93), and the rest of the coatings were semi-glossy (12-60).
ALT
All coatings demonstrated gloss reduction at varying levels after ALT. SLX, UM, and ASP had a gloss reduction less than 30 percent. SLX had the least gloss reduction of 19 percent. The strong oxidation resistance of silicon resin gave this organic-inorganic hybrid coating excellent UV radiation resistance, resulting in high-quality gloss retention properties. The AR/AL of these three coatings was very low (zero for ASP and 1.5 for SLX and UM). Good gloss retention of UM and ASP can be attributed to their AL nature.
Outdoor Exposure Testing
After 24 months of exposure in ME, 18 months of exposure in NW, and 18 months of exposure in NWS, all coating systems displayed gloss reduction. UM had the least gloss reduction of
4 percent in ME. The same coating system had almost zero gloss reduction in NW and NWS. SLX, HBAC, and the three-coat system had about 30 percent gloss reduction in ME. ASP had less than 20 percent gloss retention in NW and NWS; however, it had about 50 percent gloss reduction in ME. The two-coat system that had the ASP top coat had similar behavior as that of the one-coat ASP. The two-coat system had relatively low gloss reduction of less than 39 percent in NW and NWS but had 91 percent gloss reduction in ME. HRCSA, on the other hand, had
31 percent gloss reduction in ME, which was much lower than the 74 and 82 percent reduction obtained in NW and NWS.
In summary, UM, SLX, the three-coat system, and HBAC performed best in terms of gloss retention in outdoor exposures. ASP and the two-coat system had a large loss of gloss in ME exposure. HRCSA had a large gloss reduction in NW and NWS. EM and WBEP had large gloss reductions in all test environments.
Change of Color
In addition to gloss, color is an important parameter in evaluating the weatherability of coating systems. Table 11 summarizes ΔE, and figure 14 shows the corresponding graph.
Table 11. Summary of Δ E data.
| Coating System |
Exposure Condition |
| ALT |
ME |
NW |
NWS |
| Three-coat |
1.2 |
1.0 |
1.0 |
1.0 |
| Two-coat |
1.4 |
3.5 |
0.5 |
0.3 |
| ASP |
1.4 |
1.6 |
0.3 |
0.4 |
| EM |
8.6 |
9.6 |
14.4 |
15.3 |
| HRCSA |
6.3 |
9.8 |
6.3 |
8.2 |
| GFP |
8.2 |
|
|
|
| HBAC |
10.9 |
2.2 |
3.3 |
3.3 |
| WBEP |
4.7 |
1.9 |
1.5 |
1.7 |
| SLX |
3.1 |
0.4 |
0.8 |
0.4 |
| UM |
3.7 |
0.4 |
0.2 |
0.2 |
Figure 14. Graph. Δ E after exposure tests.
ALT
After ALT, the three-coat and two-coat systems had the best color retention, as indicated by low E values of 1.2 and 1.4, respectively. The color retention of the tested panels compared to the nontested panels of these two coating systems was clearly noticeable by visual examination. Although ASP had a small Δ E of 1.4, some white color stains were observed on the panel surface at end of the ALT. SLX and UM also had low Δ E values of 3.1 and 3.7, respectively, indicating good color retention. On the other hand, HBAC, GFP, and EM had large Δ E values between 8.2 and 10.9. EM showed noticeable color change after the first test cycle. Panel surfaces gradually changed color from a shiny grey to a yellowish dark green. WBEP and HRCSA had moderate Δ E of 4.7 and 6.3, respectively.
Outdoor Exposure Testing
Most coating systems had similar color retention characteristics in the outdoor exposures. However, the two-coat system and ASP had good color retention in NW and NWS but had a noticable color change after exposure in ME. Visual observation revealed that the color on the overall surface of the panels faded in ME.
Most coating systems exhibited good color retention except for HRCSA and EM. The E of HBAC after outdoor exposure was much smaller compared to the changes after ALT. As mentioned earlier, due to the softness and stickiness of HBAC, the surface of the test panels picked up some dirt, so the panel surfaces looked dirty and dark after ALT. This phenomenon was not observed in outdoor exposures. The surface darkness of laboratory tested panels may have affected the color and gloss value.
Change of Pencil Scratch Hardness
Pencil scratch hardness data before and after the exposure tests are summarized in table 12. Figure 15 shows the bar graph of pencil scratch hardness data. In this table, "H" represents hardness, "B" represents blackness, and "HB" represents hard and black pencils. The different grades of hardness are as follows:
9H (hardest) > 8H > 7H > 6H > 5H > 4H > 3H > 2H > H > HB > B > 2B > 3B > 4B > 5B > 6B > 7B > 8B > 9B (softest)
Table 12. Pencil scratch hardness data.
| Coating System |
Initial |
Final |
| ALT |
ME |
NW |
NWS |
| Three-coat |
HB |
HB |
HB |
HB |
HB |
| Two-coat |
HB |
HB |
2H |
2H |
2H |
| ASP |
6B |
4B |
4B |
4B |
4B |
| EM |
HB |
HB |
HB |
HB |
HB |
| HRCSA |
<6B |
<6B |
<6B |
<6B |
<6B |
| GFP |
2H |
2H |
|
|
|
| HBAC |
<6B |
<6B |
<6B |
<6B |
<6B |
| WBEP |
HB |
HB |
HB |
HB |
HB |
| SLX |
HB |
2H |
2H |
2H |
2H |
| UM |
2B |
HB |
HB |
HB |
HB |
Figure 15. Graph. Pencil scratch hardness before and after exposure tests.
ALT
GFP was the hardest coating system, with an initial pencil scratch hardness of 2H. EM, WBEP, and SLX had initial pencil scratch hardness of HB, similar to that of the two controls. UM and ASP, with scratch hardness of 2B and 6B, respectively, were relatively softer. HRCSA and HBAC were the softest coating systems, as the top coat of these two coatings scratched easily when a 6B pencil was applied. Several damaged areas were created on the surface of a few HRCSA test panels even after careful handling. Both HRCSA and HBAC were very soft and sticky. As a result, they exhibited the tendency to collect dust and external airborne material that resulted in an unclean appearance. Most of the coating systems had no hardness changes after ALT except for ASP, SLX, and UM, which became harder.
Outdoor Exposure Testing
The two-coat system, ASP, SLX, and UM had the same degree of hardness increase after
the three outdoor exposures. Hardness of the other systems remained unchanged after the outdoor exposures.
Adhesion Strength
Table 13 lists the initial adhesion strength of the 10 coating systems obtained with a hydraulic tester and a pneumatic tester. Figure 16 shows the comparison of test results by these two methods. Both methods resulted in similar data for all coating systems except for the two-coat system and GFP with CVs of 28 and 22 percent, respectively. The three-coat system, EM, WBEP, SLX, and UM had initial adhesion strength greater than 1,500 psi (10,335 kPa),
while the two-coat system, ASP, HRCSA, GFP, and HBAC had initial adhesion strength
lower than 1,000 psi (6,890 kPa). HRCSA exhibited the weakest adhesion strength of 366 psi (2,521.74 kPa).
Table 13. Initial adhesion strength from hydraulic and pneumatic test methods.
| Coating System |
Pneumatic Tester (psi) |
Hydraulic Tester (psi) |
Mean (psi) |
Standard Deviation (psi) |
CV (percent) |
| Three-coat |
1,192 |
1,948 |
1,970 |
31.3 |
1.6 |
| Two-coat |
968 |
646 |
807 |
227.8 |
28.2 |
| ASP |
592 |
664 |
628 |
51.3 |
8.2 |
| EM |
1,1571 |
1,676 |
1,624 |
73.9 |
4.6 |
| HRCSA |
276 |
366 |
321 |
63.8 |
19.9 |
| GFP |
1,226 |
886 |
1,056 |
240.3 |
22.8 |
| HBAC |
635 |
700 |
668 |
45.6 |
6.8 |
| WBEP |
2,061 |
2,168 |
2,114 |
76.0 |
3.6 |
| SLX |
2,332 |
2,057 |
2,194 |
194.7 |
8.9 |
| UM |
3,160 |
2,492 |
2,826 |
472.5 |
16.7 |
Figure 16. Graph. Comparison of initial adhesion strength data using pneumatic and hydraulic methods.
Table 14 summarizes the mean adhesion strength changes of the test panels after the accelerated and outdoor exposures, while figure 17 shows the plot of these adhesion strength changes.
Table 14. Mean adhesion strength changes after ALT and outdoor exposure tests.
| Coating System |
Exposure Condition (percent) |
| ALT |
ME |
NW |
NWS |
| Unscribed |
Scribed |
Unscribed |
Scribed |
Unscribed |
Scribed |
Unscribed |
Scribed |
| Three-coat |
-12 |
-37 |
-3 |
-4 |
3 |
-10 |
18 |
5 |
| Two-coat |
107 |
60 |
10 |
10 |
46 |
35 |
23 |
31 |
| ASP |
4 |
|
-8 |
-6 |
34 |
39 |
20 |
23 |
| EM |
-23 |
-34 |
-17 |
-2 |
3 |
5 |
-2 |
-3 |
| HRCSA |
13 |
11 |
17 |
9 |
20 |
16 |
29 |
24 |
| GFP |
30 |
20 |
|
|
|
|
|
|
| HBAC |
-12 |
75 |
8 |
53 |
85 |
25 |
36 |
87 |
| WBEP |
-32 |
-46 |
-2 |
1 |
-21 |
-3 |
-18 |
8 |
| SLX |
-22 |
-44 |
-18 |
-50 |
4 |
-17 |
-15 |
3 |
| UM |
-22 |
|
-10 |
-19 |
-5 |
-11 |
-6 |
7 |
Figure 17. Graph. Changes in mean adhesion strength after ALT and outdoor tests.
ALT
Adhesion strength data for scribed test panels of ASP and UM could not be obtained after ALT because the panel surface had too many blisters and other surface defects to find a flat surface to glue the dollies.
The three-coat system demonstrated a cohesive failure mode with failure occurring within the epoxy zinc-rich primer, while the two-coat system exhibited an adhesive failure mode at the interface between the zinc-rich primer and the ASP top coat. All one-coat systems had a cohesive failure mode except for SLX, which had a partially cohesive failure and partially adhesive failure between the coating and the substrate.
The three-coat system, EM, and WBEP had a shallow cohesive failure mode where residual
DFT were close to their initial DFT, and the failure mode was observed close to the panel surface. Figure 18 shows the cohesive failure mode of the ASP and EM test panels. ASP had an initial DFT of 20 mil (508 μm), leaving 4 mil (101.6 μm) of DFT on the adhesion spot after testing. EM coating system had an initial DFT of 9 mil (228.6 μm) and had 8 mil (203.2 μm) of DFT remaining on the pull-off spot after the test.
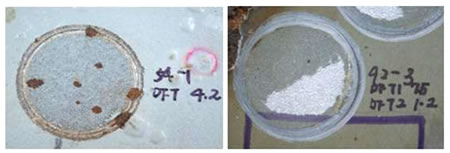
Figure 18. Photo. Simple grinding tool and hand press kit.
Adhesion strengths varied with either an increase or decrease after ALT. ASP had the lowest adhesion strength increase (4 percent), while the two-coat system had the highest adhesion strength increase (>100 percent) among unscribed panels. The three-coat system (12 percent) and WBEP (32 percent) had the lowest and highest decrease in adhesion strength variation among unscribed panels. HRCSA (11 percent) and HBAC (75 percent) had the lowest and highest increase in adhesion strength, while EM (34 percent) and WBEP (46 percent) had the lowest and highest decrease in adhesion strength among scribed panels. CV of the adhesion test data ranged from 3 to 36 percent with a median value of 16 percent.
Outdoor Exposure Testing
Most coating systems did not show significant adhesion strength changes but had cohesive failure modes after outdoor exposures. The three-coat system failed cohesively within the primer. The two-coat system exhibited an adhesion failure mode between the top coat and the primer.
Scribed SLX test panels lost 50 percent adhesion strength after 24 months in ME due to severe rust creepage. HBAC had an obvious increase in adhesion strength after all three types of outdoor testing. This was probably due to additional long-term curing of the resin in the
exposure environments.
Surface Defects, Rusting, and Blistering
Representative progressive changes of test surface condition with time of coating systems tested in this study are shown in figure 19 through figure 55. Table 15 summarizes the surface blisters, rusting, and defects developed in the laboratory and outdoor exposures. Figure 56 through
figure 59 show the cumulative number of surface defects identified by the holiday detector for each coating system after ALT, ME, NW, and NWS, respectively. The acronyms used in
table 15 are based on ASTM D714-02, "Standard Test Method for Evaluating Degree of Blistering of Paints" and ASTM D610-08, "Standard Test Method for Evaluating Degree of Rusting on Painted Steel Surfaces." (31,32)
The blister and rusting abbreviations have been specified in these standards, which have been used to categorize the coating surface degradation. In this grading, "F" denotes few,
"M" denotes medium, and "D" denotes dense. Size 2 is the largest while size 8 is the smallest.
The blister grading is as follows:
F8 = Few blister size 8, 4M = Medium blister size 4, 2 MD = Medium dense blister size 2,
F6 = Few blister size 6, F2 = Few blister size 2, 4 MD = Medium dense blister size 4, and 2D = Dense blister size 2.
The rusting grades have been progressively assigned 9 through 1. G9, G8, G6, G5, G4, and G1 denote rusting grades 9, 8, 6, 5, 4, and 1, respectively. G9 covers less than 0.03 percent of the area, while G2 covers half of the panel.
ALT
The three-coat system (see figure 19) and GFP (see figure 39) retained the best surface physical properties after completion of ALT. One rust pit was observed on one of the GFP panels. Additionally, one rusted blister (size 8) was observed, and one defect was detected in one of the three-coat test panels after 6,840 h of testing.
HRCSA (see figure 35) developed a few size 6 blisters on several test panels, and two holidays were detected after 2,160 and 4,320 h, respectively. Because HRCSA was soft in surface nature, there were a few damaged spots on almost every HRCSA test panel, although they were handled carefully. The panel surfaces looked dirty because they picked up a lot of dust and dirt due to the soft and sticky nature of the system.
HBAC, WBEP, and SLX had moderate surface failures. HBAC developed one size 6 rusted blister on panel surface. A few defects were detected by the holiday detector during the test period. Although this system was soft, there were no damaged spots. These panels also looked dirty due to the stickiness of the coating system. WBEP developed a few size 6 and size 2 blisters, as well as a few defects.
Table 15. Development of blistering, rusting, and surface defects in ALT and outdoor exposure tests.
| Coating System |
ALT |
ME Exposure |
Mild NW Exposure |
Mild NWS Exposure |
Overall Defects |
| Blister |
Rusting |
Defect |
Blister |
Rusting |
Defect |
Blister |
Rusting |
Defect |
Blister |
Rusting |
Defect |
| Three-coat |
F8 (1P) |
G9 |
1 |
0 |
0 |
1 |
0 |
0 |
1 |
0 |
0 |
0 |
3 |
| Two-coat |
0 |
0 |
>100 |
0 |
0 |
0 |
0 |
0 |
1 |
0 |
0 |
0 |
>100 |
| ASP |
4M, 2MD (all) |
0 |
>100 |
0 |
G9 |
0 |
0 |
0 |
4 |
0 |
0 |
0 |
>100 |
| EM |
0 |
0 |
>100 |
0 |
0 |
35 |
0 |
0 |
12 |
0 |
0 |
12 |
>100 |
| HRCSA |
F6 (3P) |
0 |
2 |
F8, F6 (3P) |
0 |
0 |
0 |
0 |
1 |
0 |
0 |
0 |
3 |
| GFP |
0 |
1 |
0 |
|
|
|
|
|
|
|
|
|
0 |
| HBAC |
F6 (IP) |
G9 |
7 |
0 |
0 |
0 |
0 |
0 |
1 |
0 |
0 |
0 |
8 |
| WBEP |
F6 (2P), F2 (1P) |
0 |
5 |
F6 (3P) |
G9 |
13 |
F6 (4P) |
0 |
39 |
F6 (all) |
G6 |
>100 |
>100 |
| SLX |
0 |
G9 |
32 |
F2 (1P) |
G9 |
11 |
0 |
0 |
68 |
0 |
G9 |
28 |
>100 |
| UM |
4MD, 2D (all) |
G4, G1 |
>100 |
F8, M8 (all) |
G8, G5 |
>100 |
0 |
0 |
67 |
0 |
0 |
30 |
>100 |
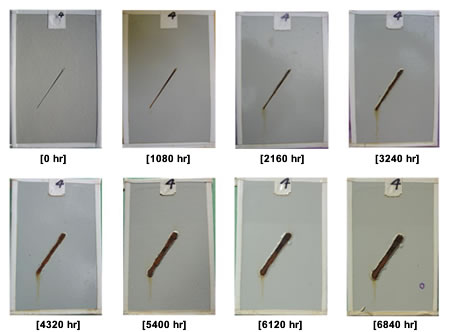
Figure 19. Photo. Progressive changes of panel 4 (three-coat: ALT).
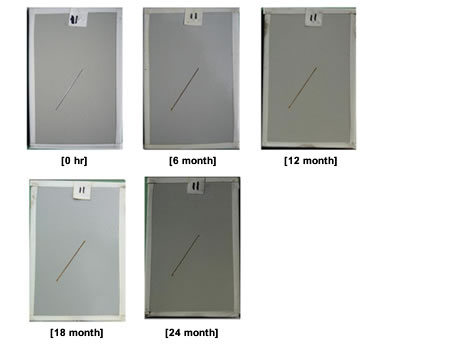
Figure 20. Photo. Progressive changes of panel 11 (three-coat: ME).
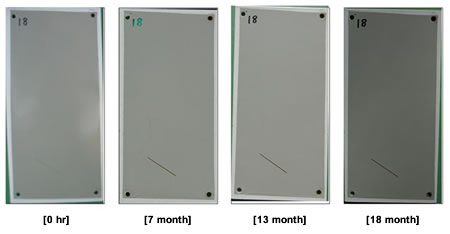
Figure 21. Photo. Progressive changes of panel 18 (three-coat: NW).
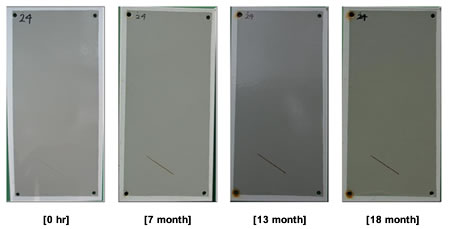
Figure 22. Photo. Progressive changes of panel 24 (three-coat: NWS).
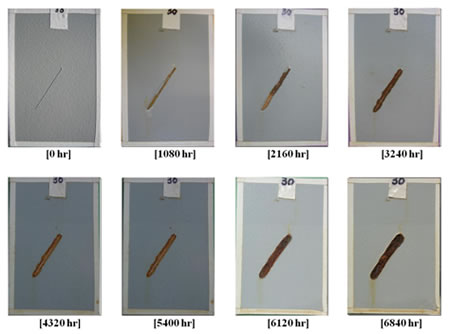
Figure 23. Photo. Progressive changes of panel 30 (two-coat: ALT).
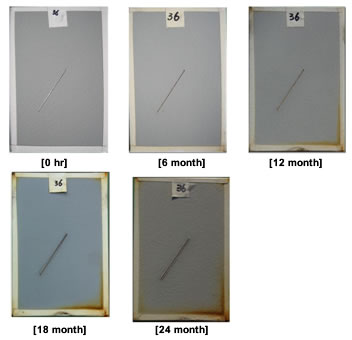
Figure 24. Photo. Progressive changes of panel 36 (two-coat: ME).
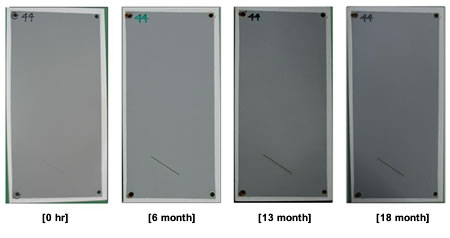
Figure 25. Photo. Progressive changes of panel 44 (two-coat: NW).
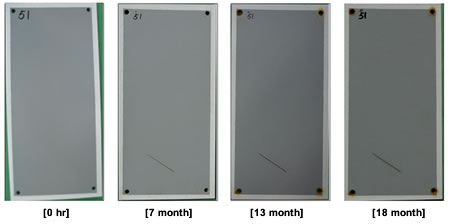
Figure 26. Photo. Progressive changes of panel 51 (two-coat: NWS).
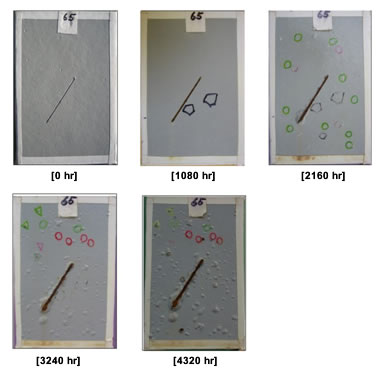
Figure 27. Photo. Progressive changes of panel 65 (ASP: ALT).
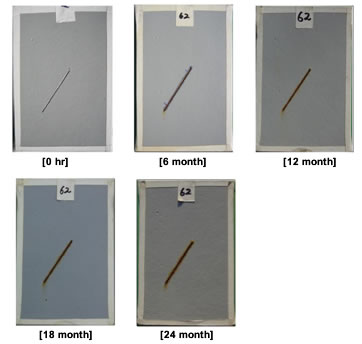
Figure 28. Photo. Progressive changes of panel 62 (ASP: ME).
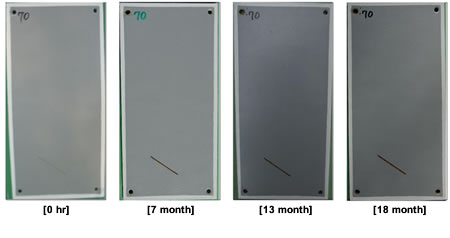
Figure 29. Photo. Progressive changes of panel 70 (ASP: NW).
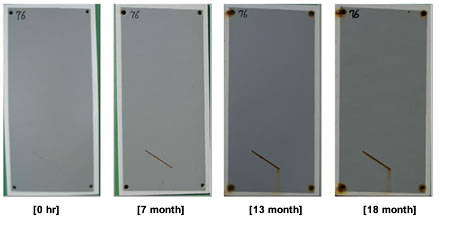
Figure 30. Photo. Progressive changes of panel 76 (ASP: NWS).
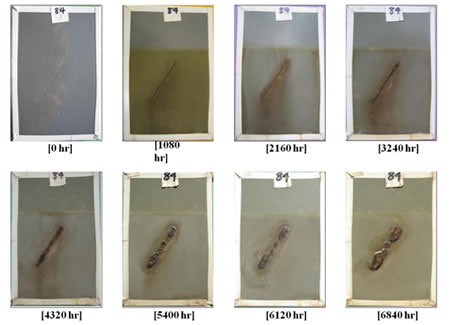
Figure 31. Photo. Progressive changes of panel 84 (EM: ALT).
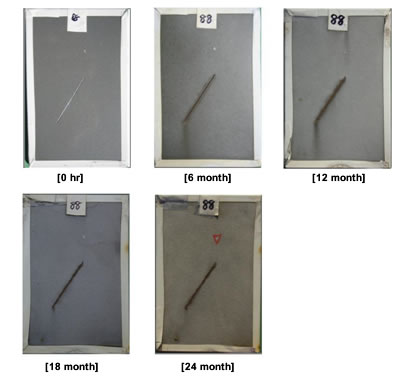
Figure 32. Photo. Progressive changes of panel 88 (EM: ME).
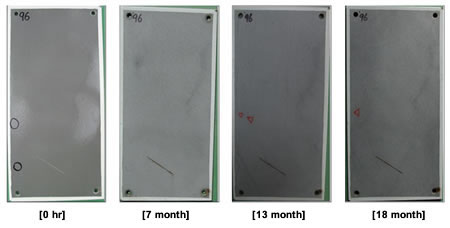
Figure 33. Photo. Progressive changes of panel 96 (EM: NW).
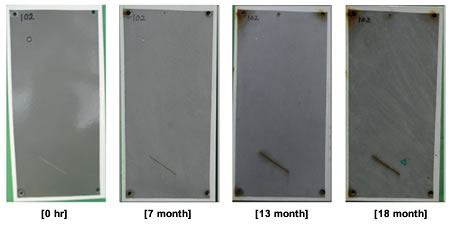
Figure 34. Photo. Progressive changes of panel 102 (EM: NWS).
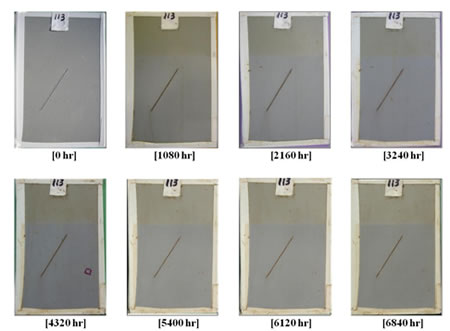
Figure 35. Photo. Progressive changes of panel 113 (HRCSA: ALT).
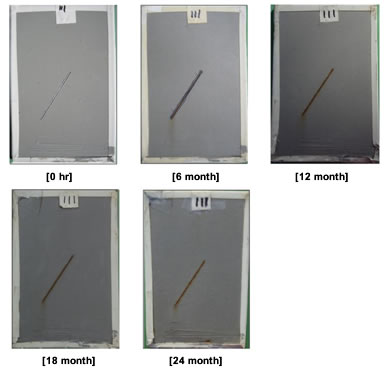
Figure 36. Photo. Progressive changes of panel 111 (HRCSA: ME).
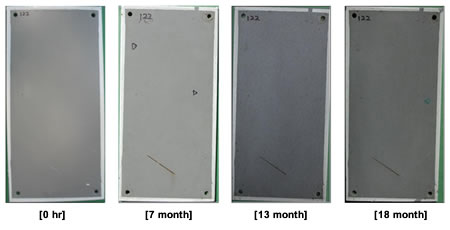
Figure 37. Photo. Progressive changes of panel 122 (HRCSA: NW).
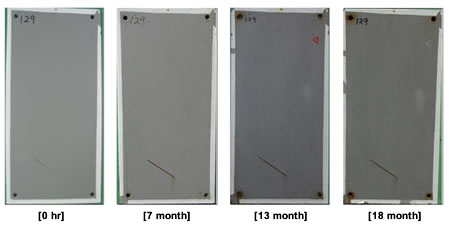
Figure 38. Photo. Progressive changes of panel 129 (HRCSA: NWS).
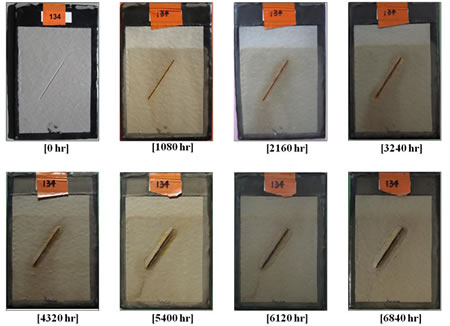
Figure 39. Photo. Progressive changes of panel 134 (GFP: ALT).
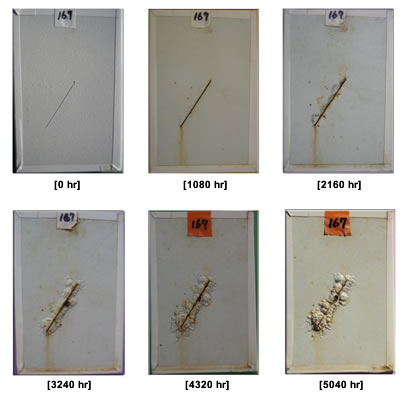
Figure 40. Photo. Progressive changes of panel 167 (HBAC: ALT).
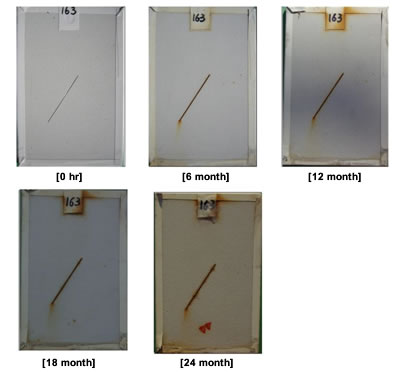
Figure 41. Photo. Progressive changes of panel 163 (HBAC: ME).
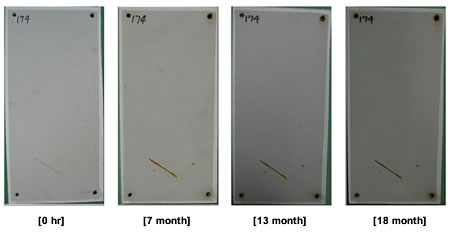
Figure 42. Photo. Progressive changes of panel 174 (HBAC: NW).
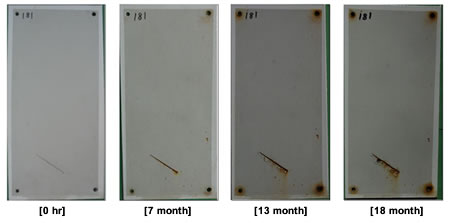
Figure 43. Photo. Progressive changes of panel 181 (HBAC: NWS).
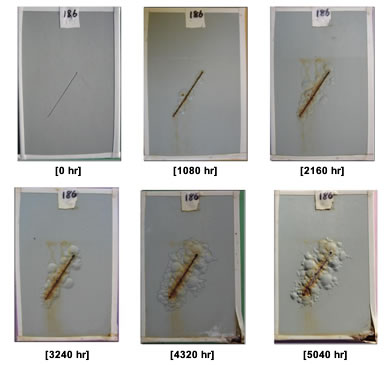
Figure 44. Photo. Progressive changes of panel 186 (WBEP: ALT).
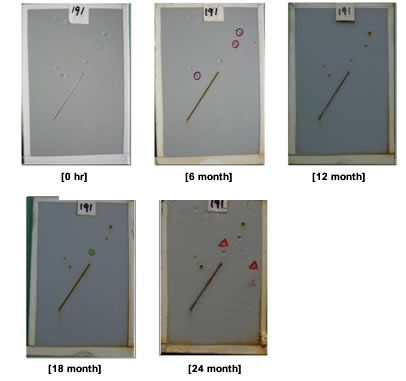
Figure 45. Photo. Progressive changes of panel 191 (WBEP: ME).
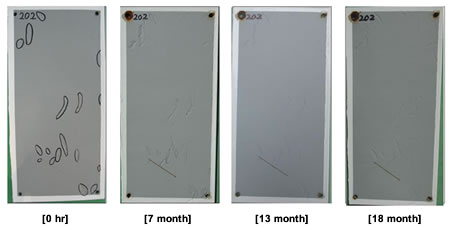
Figure 46. Photo. Progressive changes of panel 202 (WBEP: NW).
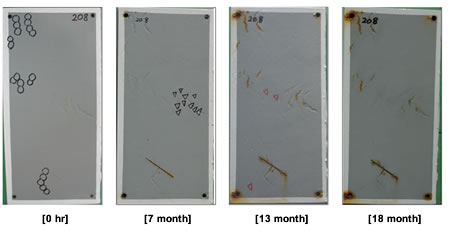
Figure 47. Photo. Progressive changes of panel 208 (WBEP: NWS).
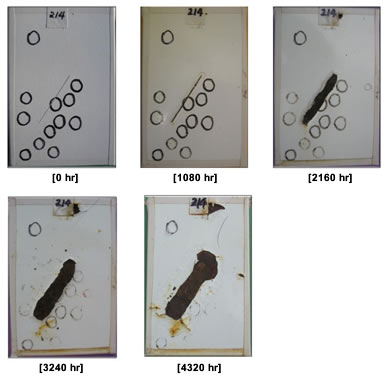
Figure 48. Photo. Progressive changes of panel 214 (SLX: ALT).
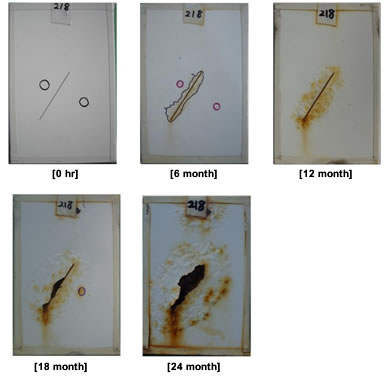
Figure 49. Photo. Progressive changes of panel 218 (SLX: ME).
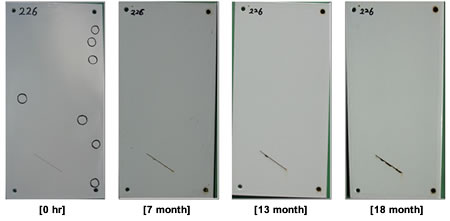
Figure 50. Photo. Progressive changes of panel 226 (SLX: NW).
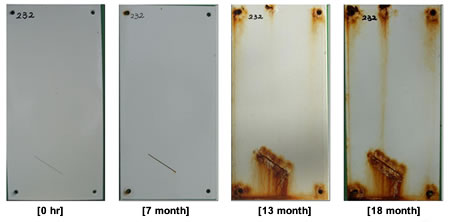
Figure 51. Photo. Progressive changes of panel 232 (SLX: NWS).
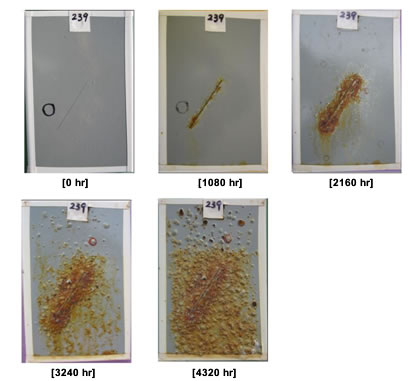
Figure 52. Photo. Progressive changes of panel 239 (UM: ALT).
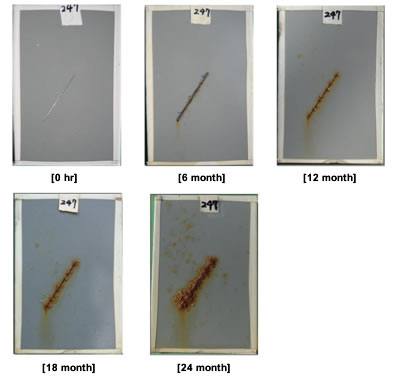
Figure 53. Photo. Progressive changes of panel 247 (UM: ME).
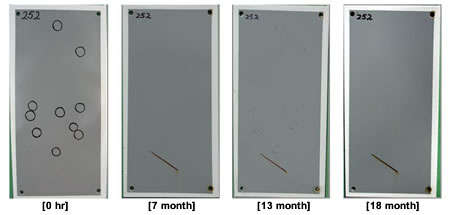
Figure 54. Photo. Progressive changes of panel 252 (UM: NW).
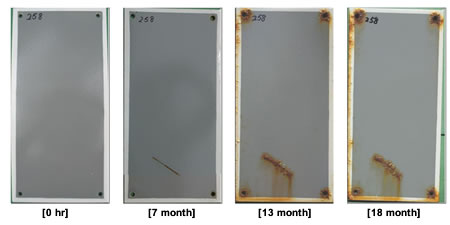
Figure 55. Photo. Progressive changes of panel 258 (UM: NWS).
Figure 56. Graph. Development of coating defects during ALT.
Figure 57. Graph. Development of coating defects during ME.
Figure 58. Graph. Development of coating defects during NW.
Figure 59. Graph. Development of coating defects during NWS.
There were 25 holidays on SLX test panels initially (see figure 48), and 32 defects were detected at the end of the 6,840-h test period. No blisters were observed on the panel surfaces.
ASP, UM, the two-coat control, and EM developed many surface failures. The steep lines related to these coating systems in figure 56 indicate excessive development of defects during ALT. When the excessive defects were observed, an arbitrary number of 100 was used to plot indefinable quantities.
ASP (see figure 27) exhibited one defect after 720 h of testing, and the number of defects increased rapidly. After 3,600 h of testing, the number of defects became physically uncountable. Size 4 and 2 blisters with dense or medium-dense intensities were also observed during this period. Both ASP and UM were removed from the test program after 4,320 h of testing.
UM (see figure 52) exhibited the worst surface failures compared to the rest of the coating systems. It had two defects initially, and this number rapidly increased after 1,440 h of laboratory testing. Numerous blisters were observed, and the panels had G4 to G1 rusting. The rust pits and blisters covered almost entire panel surface, and all of the blisters were filled with rust. The thin DFT of UM could be one of the reasons for the severe surface failures.
The two-coat (see figure 23) and EM (see figure 31) coating systems reacted differently compared to ASP and UM. Both systems did not develop any surface blisters or rust pits during the entire test period. However, when panels from the two-coat system were scanned by the holiday detector after 6,120 h, all of the test panels suggested the development of numerous defects by emitting a countless beeping sound. Most of the EM panels also indicated many defects after 6,480 h. Microscopic examination revealed numerous hairline cracks that had developed on the surface of the two-coat test panels. Figure 60 shows the photomicrograph of surface cracking of the two-coat panels. EM, however, did not show any surface cracking/deterioration when examined under the optical microscope.
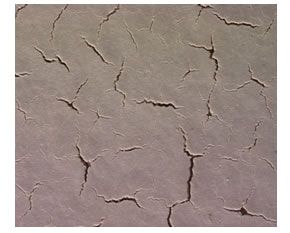
Figure 60. Photo. Surface coating failure by cracking (two-coat system).
It was difficult to explain the cracking phenomena of the two-coat system using the information obtained from this study; however, one hypothesis could be made. Hare described the relationship of adhesion and cohesion with the internal stress in Paint Film Degradation.(35) According his theory:
The adhesion and cohesion strengths maintain the integrity of the coating film. The internal stresses arising from solvent loss, polymerization of the binder, and from film formations are always counterproductive to good mechanical properties. When forces from internal stress are larger than film’s cohesive strength, the film cracks on the surface. In most cases, the internal stress stored within the film minimizes the system’s ability to accommodate additional
tensile stress from external sources, or from the internal stress produced by long-term aging. (pp 142)
Hare described that the external stress from the service includes bending, abrasion, impact, etc., as well as the hygrothermal gradients. He also indicated that over time, some polymers will undergo substantial polymerization and cross linking after film formation, particularly in the presence of UV light, and consequently increase the internal stress.(35) Some of the observed cracking in the present two-coat system could be explained based on this theory.
The microscopic examination of the three-coat system taken after 6,120 h also revealed some small holes on the panel surfaces. Figure 61 shows the photomicrographs of the surface of the three-coat system. However, the micro-sized holes were not holidays and thus did not affect the coating performance during ALT.
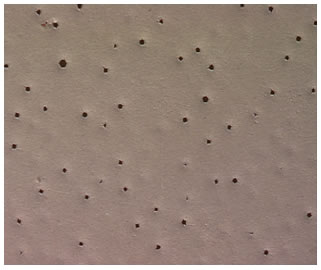
Figure 61. Photo. Surface condition of the three-coat system.
Outdoor Exposure Testing
Most coating systems performed well after 24 months in ME. The three-coat (see figure 20), two-coat (see figure 24), ASP (see figure 28), HBAC (see figure 41), and HRCSA (see figure 36) systems did not developed any surface failures and developed only a few defects, blisters, and rust pits on some test panels. EM did not exhibit any surface blisters and rust pits but developed some holidays after 24 months of exposure in ME. SLX (see figure 49) had one large rusted blister (larger than size 2) on one of the test panels and developed four defects during exposure in ME. Performance of the WBEP panels (see figure 45) was compromised by defects formed from coating application. Certain areas of the film might not have formed uniformly, causing areas of holidays on the panels. Some pinholes were also observed on the test panels, which developed into rusted blisters.
WBEP exhibited F6 blistering, G9 rusting, and had 13 holidays detected by the holiday detector. Although UM (see figure 53) developed F8 and M8 blistering, G8 to G5 rusting, and several holidays that were detected by the holiday detector, the surface failure after ME was much less severe compared to its surface failure in ALT.
All coating systems performed well in NW and NWS except for WBEP (see figure 46 and figure 47). As discussed earlier, WBEP test panels had some initial film defects. DFT was less than 1 mil (25.4 μm) at several areas. There were also some small dent areas on the surface. Typical defective surface condition and the resultant surface appearance after outdoor exposure can be seen in figure 62. The small dents grew into size 6 blisters after NW. In NWS, the small dents grew into size 6 rusted blisters, and all of the thin DFT areas became rusted (the rusting grade was G6). Many defects were detected by the holiday detector on the test panel surfaces.
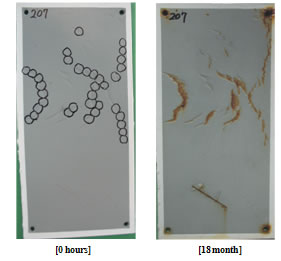
Figure 62. Photo. Large panels with defects from coating application deficiency in NWS.
To summarize, UM and WBEP had more surface failures than the other coating systems in outdoor exposures.
Growth of Rust Creepage
All of the coating systems developed some degree of rust creepage at the scribe line. Table 16 shows the creepage measurement of each coating system at the completion of each test method. Figure 63 through figure 66 show the mean creepage growth with time for each coating system in ALT, ME, NW, and NWS exposure conditions, respectively.
Table 16. Average rust creepage developed.
| Coating System |
ALT |
Rust Creepage (mm) |
| Time Exposure (hours) |
Rust Creepage (mm) |
ME
(24 months) |
NW
(18 months) |
NWS
(18 months) |
| Three-coat |
6,840 |
5.3 |
0 |
0 |
0.5 |
| Two-coat |
6,840 |
4.7 |
1.6 |
1.6 |
1.5 |
| ASP |
4,320 |
6.8 |
1.8 |
0 |
0 |
| EM |
6,840 |
6.5 |
0.9 |
0.6 |
1.6 |
| HRCSA |
6,840 |
0.7 |
1 |
0.7 |
0.7 |
| GFP |
6,840 |
7.1 |
|
|
|
| HBAC |
5,040 |
9.3 |
1.3 |
0 |
3.7 |
| WBEP |
5,040 |
15.9 |
1.1 |
0.6 |
2.3 |
| SLX |
4,320 |
21.9 |
30.5 |
2.2 |
12.5 |
| UM |
4,320 |
35.6 |
5.2 |
0.7 |
6.6 |
Figure 63. Graph. Development of rust creepage during ALT.
Figure 64. Graph. Development of rust creepage during ME.
Figure 65. Graph. Development of rust creepage during NW.
Figure 66. Graph. Development of rust creepage during NWS.
ALT
After ALT, the three-coat and two-coat control systems had moderate creepage at 0.21 and
0.18 inches (5.3 and 4.7 mm), respectively. The three-coat system started to show creepage after 1,080 h of incubation time, while the two-coat system developed rust creepage along the line after 360 h (one test cycle) and slowly grew to 0.18 inches (4.7 mm) after 6,840 h.
HRCSA had the lowest rust creepage of 0.03 inches (0.7 mm) at the completion of ALT. Figure 67 shows the creepage growth during ALT. HRCSA developed initial creepage after 360 h; however, the creepage did not grow much during the entire test period.
EM and GFP had similar performance, with final rust creepage of 0.25 and 0.28 inches (6.5 and 7.1 mm) after incubation times of 1,080 and 1,440 h, respectively. ASP started developing creepage after 720 h and had a creepage of 0.27 inches (6.8 mm) when it was removed from the test program after 4,320 h due to the development of severe surface defects. HBAC and WBEP had creepage of 0.36 and 0.59 inches (9.3 and 15.1 mm), respectively, when they were removed from the test program after 5,040 h. Both coatings started developing rust creepage after the first test cycle of 360 h.
UM had the highest creepage of 1.37 inches (35 mm), followed by SLX, which had a final creepage of 0.98 inches (25 mm) after the first test cycle of 360 h. They were removed from the test program after 4,320 h.
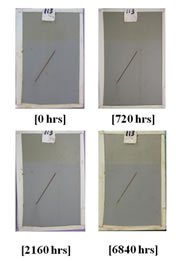
Figure 67. Photo. Rust creepage of HRCSA during ALT.
In summary, HRCSA outperformed the three-coat and two-coat control systems in terms of rust creepage. EM and GFP had more creepage than the two controls. All other one-coat systems had much larger rust creepage than the two controls.
Rust creepage is typically produced as a result of steel dissolution in corrosive environments at the scribed area.(36) The primers in the coating systems prevented the steel corrosion through cathodic protection or inhibitive pigments. Zinc-rich primers of the two controls provided sacrificial cathodic protection for the steel panel. It was interesting to note from the major element contents of the pigments (see table 5) that five of the eight one-coat systems which had an elevated amount of zinc and some amount of phosphorus did not perform as well as the two one-coat systems without any zinc and phosphate. Specifically, GFP and EM outperformed the other one-coat systems except for HRCSA.
Outdoor Exposure Testing
Most coating systems developed minimal rust creepage compared to those in ALT after
24 months of exposure in ME and 18 months exposure in NW and NWS.
The three-coat system did not develop rust creepage at the scribe at the end of ME as well as exposure in NW for 18 months. However, 0.02 inches (0.5 mm) of creepage was observed after
13 months in NWS. FHWA’s prior coating test results showed that the three-coat system with a zinc-rich primer usually did not develop creepage at the scribe when exposed to a salt-rich ME. The 0.02-inch (0.5-mm) rust creepage development indicated that daily spray of 15 percent salt solution is a more severe exposure condition than ME.
The two-coat system exhibited less than 0.08 inches (2 mm) of creepage in all three outdoor exposures. It showed visible creepage at the scribe after 18 months in ME and after 6 months in NW and NWS.
ASP did not develop rust creepage in NW and NWS but started to develop creepage of
0.07 inches (1.8 mm) in ME during the first 6 months.
EM started to show rust creepage after 18 months of exposure in ME and after 13 months of exposure in NW and NWS. The system had less than 0.08 inches (2 mm) of mean final creepage in all three outdoor tests.
HRCSA and WBEP exhibited visible rust creepage after 6 months exposure in three outdoor conditions. However, rust creepage did not grow significantly during the test period. HRCSA had 0.039 inches (1 mm) of creepage in three outdoor exposures at the end of the test period. WBEP demonstrated the highest creepage of 0.09 inches (2.3 mm) in NWS, 0.04 inches (1.1 mm) in ME, and 0.02 inches (0.6 mm) in NW.
HBAC did not show creepage in NW and had 0.039 inches (1 mm) of creepage in ME. However, it had around 0.16 inches (4 mm) of creepage in NWS.
SLX performed poorly in ME and NWS. The final mean creepage was 1.12 and 0.51 inches
(31 and 13 mm), respectively. SLX performed very well in the NW with creepage of
0.08 inches (2 mm).
At the completion of the test, UM had creepage values of 0.20 and 0.27 inches (5 and 7 mm) in ME and NWS, respectively. The creepage developed in NW was less than 0.039 inches (1 mm).
3.3. CORRELATION AMONG PERFORMANCE PARAMETERS AND EXPOSURE CONDITIONS
Correlation among Characterization Parameters in a Specific Exposure Condition
Linear Regression Analysis
Linear regression analysis was performed to identify relationships between the various performance characterization parameters and also to establish if correlations exist between the various exposure conditions involved. All parameters and the corresponding numerical values of one-coat systems and the two controls toward the end of the test period for each exposure environment are shown in table 17.
Table 17. Summary of ALT and outdoor performance data.
| Coating System |
Three-Coat |
Two-Coat |
ASP |
EM |
HRCSA |
GFP |
HBAC |
WBEP |
SLX |
UM |
| ALT |
| Gloss reduction percent |
50.9 |
60.3 |
27.6 |
99 |
66.7 |
41.6 |
79.5 |
77.8 |
18.5 |
23.8 |
| Color reduction (E) |
1.2 |
1.4 |
1.4 |
8.6 |
6.3 |
8.2 |
10.9 |
4.7 |
3.1 |
3.7 |
| Variation in adhesion strength: scribed (psi) |
-12 |
107 |
4 |
-23 |
13 |
30 |
-12 |
-32 |
-22 |
-22 |
| Variation in adhesion strength: unscribed (psi) |
-37 |
60 |
|
-34 |
11 |
20 |
75 |
-46 |
-44 |
|
| Number of coating defects |
1 |
550 |
200 |
100 |
2 |
0 |
7 |
5 |
32 |
550 |
| Rust creepage at the scribe (mm) |
5.3 |
4.7 |
6.8 |
6.5 |
0.7 |
7.1 |
9.3 |
15.9 |
21.9 |
35.6 |
| ME |
| Gloss reduction percent |
28.9 |
91.5 |
52.7 |
97.7 |
30.6 |
|
29.2 |
66.9 |
32.8 |
4.3 |
| Color reduction (E) |
1 |
3.5 |
1.6 |
9.6 |
9.8 |
|
2.2 |
1.9 |
0.4 |
0.4 |
| Variation in adhesion strength: scribed (psi) |
-3 |
10 |
-8 |
-17 |
17 |
|
8 |
-2 |
-18 |
-10 |
| Variation in adhesion strength: unscribed (psi) |
-4 |
10 |
-6 |
-2 |
9 |
|
53 |
1 |
-50 |
-19 |
| Number of coating defects |
1 |
0 |
0 |
35 |
0 |
|
0 |
13 |
11 |
550 |
| Rust creepage at the scribe (mm) |
0 |
1.6 |
1.8 |
0.9 |
1 |
|
1.3 |
1.1 |
30.5 |
5.2 |
| NW |
| Gloss reduction percent |
29.5 |
39 |
10.1 |
96.9 |
81.9 |
|
24.4 |
59.3 |
20.6 |
1.5 |
| Color reduction (E) |
1 |
0.5 |
0.3 |
14.4 |
6.3 |
|
3.3 |
1.5 |
0.8 |
0.2 |
| Variation in adhesion strength: scribed (psi) |
3 |
46 |
34 |
3 |
20 |
|
85 |
-21 |
4 |
-5 |
| Variation in adhesion strength: unscribed (psi) |
-10 |
35 |
39 |
5 |
16 |
|
25 |
-3 |
-17 |
-11 |
| Number of coating defects |
1 |
1 |
4 |
12 |
1 |
|
1 |
39 |
68 |
67 |
| Rust creepage at the scribe (mm) |
0 |
1.6 |
0 |
0.6 |
0.7 |
|
0 |
0.6 |
2.2 |
0.7 |
| NWS |
| Gloss reduction percent |
14.2 |
34.5 |
15 |
97.3 |
74.1 |
|
16.5 |
63.8 |
12.4 |
0.5 |
| Color reduction ( E) |
1 |
0.3 |
0.4 |
15.3 |
8.2 |
|
3.3 |
1.7 |
0.4 |
|
| Variation in adhesion strength: scribed (psi) |
18 |
23 |
20 |
-2 |
29 |
|
36 |
-18 |
-15 |
-6 |
| Variation in adhesion strength: unscribed (psi) |
5 |
31 |
23 |
-3 |
24 |
|
87 |
8 |
3 |
7 |
| Number of coating defects |
0 |
0 |
0 |
12 |
0 |
|
0 |
174 |
28 |
30 |
| Rust creepage at the scribe (mm) |
0.5 |
1.5 |
0 |
1.6 |
0.7 |
|
3.7 |
2.3 |
12.5 |
6.6 |
Combinations of variable pairs for color, gloss, adhesion strength of scribed and unscribed panels, number of coating defects, and rust creepage at the scribe for each individual exposure condition were used for a linear regression analysis. Exposure conditions were ALT, ME, NW, and NWS. The combinations of the various parameters are as follows:
-
Color versus gloss.
-
Color versus rust creepage.
-
Color versus coating defects.
-
Gloss versus coating defects.
-
Gloss versus rust creepage.
-
Coating defects versus rust creepage.
-
Adhesion strength (scribed) versus rust creepage.
-
Adhesion strength (unscribed) versus rust creepage.
-
Adhesion strength (scribed) versus coating defects.
-
Adhesion strength (unscribed) versus coating defects.
Linear regression analysis of the above combinations of variables was conducted using Microsoft® Excel, and the corresponding R-squared values were recorded (see table 18). Correlations with R-squared values higher than 0.6 were identified and further explored for a better numerical relationship. Examples of a good and poor correlation using linear regression analysis are shown in figure 68 and figure 69, respectively. Regression analysis of color versus gloss in NW and NWS resulted in R-squared values greater than 0.69. Another promising correlation was found between adhesion strength of unscribed panels and coating defects, which had an R-squared value of 0.51 in NW. Figure 69 shows the correlation between color and gloss in ME with an R-squared value of 0.193, indicating a poor correlation.
Table 18. R-squared values from linear regression analysis for various performance parameter combinations.
| Combination of Parameters |
R-squared Values |
| ALT |
ME |
NW |
NWS |
Overall Correlation |
| Color versus gloss |
0.328 |
0.193 |
0.692 |
0.711 |
0.015 |
| Color versus rust creepage |
0.021 |
0.121 |
0.015 |
0.053 |
0.101 |
| Color versus coating defects |
0.191 |
0.075 |
0.077 |
0.021 |
0.063 |
| Gloss versus coating defects |
0.084 |
0.242 |
0.124 |
0.006 |
0.063 |
| Gloss versus rust creepage |
0.248 |
0.060 |
0.000 |
0.166 |
0.088 |
| Coating defects versus rust creepage |
0.167 |
0.001 |
0.278 |
0.009 |
0.088 |
| Adhesion strength (scribed) versus rust creepage |
0.193 |
0.255 |
0.038 |
0.305 |
0.088 |
| Adhesion strength (unscribed) versus rust creepage |
0.199 |
0.105 |
0.068 |
0.018 |
0.087 |
| Adhesion strength (scribed) versus coating defects |
0.233 |
0.073 |
0.324 |
0.453 |
0.063 |
| Adhesion strength (unscribed) versus coating defects |
0.190 |
0.070 |
0.511 |
0.074 |
0.063 |
Figure 68. Graph. Positive linear regression analysis between color and gloss in NW.
Figure 69. Graph. Poor linear regression analysis between color and gloss in ME.
As seen in figure 68, the relationship between color and gloss reduction is not a realistic model because the line intercepts the negative y-axis between zero and -2. This means that for zero gloss reduction, the reduction in color is a negative value. However, the relationship indicates that a correlation exists between color and gloss reduction for one-coat systems in NW. A better correlation can be established through regression analysis using an exponential, power, or polynomial fit instead of a linear fit.
Regression Analysis Using Exponential and Polynomial Fits
After the above correlations yielded encouraging results from regression analysis using a linear fit, the relationships of color versus gloss and adhesion strength versus coating defects were correlated using an exponential fit.
The corresponding exponential fit resulted in an increased R-squared value of 0.70 for color versus gloss. For simplicity, outdoor exposure data in both NW and NWS were pooled together for the regression analysis. The larger dataset pooled from NW and NWS has increased sample size, resulting in a statistically improved correlation with a lower standard deviation. The resulting correlation is shown in figure 70. True performance of various one-coat systems can be gauged by excluding the control systems. The correlation between color and gloss without the controls resulted in an increased R-squared value from 0.70 to 0.77 as shown in figure 71.
Linear regression analysis of adhesion strength variation in unscribed panels correlated with coating defects, yielding an R-squared value of 0.51. The adhesion and coating defects data of all one-coat systems along with the control coating systems for both NW and NWS were pooled together, and a regression analysis was performed with a polynomial fit to yield an increased R-squared value of 0.56.
When the control coating systems were not included, the R-squared value increased from
0.56 (see figure 72) to 0.82 (see figure 73). This improved correlation between adhesion
strength variations and the number of coating defects as well as color and gloss indicates that these relationships are more likely characteristics of one-coat systems. Coating systems with
zero defects and numerous holidays (>100 and physically impossible to count) on the surface were not included in this analysis. These included ASP, HRCSA, and HBAC.
Figure 70. Graph. Regression analysis of color versus gloss for one-coat and control coating systems in NW and NWS.
Figure 71. Graph. Improved regression analysis results from figure 70.
Figure 72. Graph. Regression analysis of adhesion strength versus coating defects for one-coat and control coating systems in NW.
Figure 73. Graph. Improved regression analysis result of adhesion strength versus coating defects for one-coat systems in NW.
Correlation among Exposure Conditions for a Specific Characterization Parameter
Linear Regression Analysis
Linear regression analysis was performed for variations in individual performance parameters, such as color and gloss, to examine the relationship among ALT, ME, NW, and NWS.
A combination matrix showing the performance parameters and the various exposure conditions involved is shown in table 19. Regression analysis of these exposure condition combinations for the performance evaluation variables resulted in R-squared values shown in table 20.
Table 19. Linear regression analysis combinations of exposure conditions.
| Characterization Parameter |
Combination
1 |
Combination
2 |
Combination
3 |
Combination
4 |
Combination
5 |
Combination 6 |
| Color |
ALT versus ME |
ALT versus NW |
ALT versus NWS |
ME versus NW |
ME versus NWS |
NW versus NWS |
| Gloss |
ALT versus ME |
ALT versus NW |
ALT versus NWS |
ME versus NW |
ME versus NWS |
NW versus NWS |
| Adhesion strength scribed |
ALT versus ME |
ALT versus NW |
ALT versus NWS |
ME versus NW |
ME versus NWS |
NW versus NWS |
| Adhesion strength unscribed |
ALT versus ME |
ALT versus NW |
ALT versus NWS |
ME versus NW |
ME versus NWS |
NW versus NWS |
| Coating defects |
ALT versus ME |
ALT versus NW |
ALT versus NWS |
ME versus NW |
ME versus NWS |
NW versus NWS |
| Rust creepage |
ALT versus ME |
ALT versus NW |
ALT versus NWS |
ME versus NW |
ME versus NWS |
NW versus NWS |
Table 20. R-squared values of linear regression analysis of exposure conditions.
| Combination of Parameters |
ALT versus ME |
ALT versus NW |
ALT versus NWS |
ME versus NW |
ME versus NWS |
NW versus NWS |
| Color |
0.231 |
0.417 |
0.407 |
0.731 |
0.792 |
0.988 |
| Gloss |
0.330 |
0.635 |
0.613 |
0.337 |
0.411 |
0.961 |
| Adhesion strength scribed |
0.302 |
0.199 |
0.243 |
0.262 |
0.531 |
0.668 |
| Adhesion strength unscribed |
0.576 |
0.834 |
0.767 |
0.367 |
0.672 |
0.351 |
| Coating defects |
0.391 |
0.004 |
0.037 |
0.371 |
0.001 |
0.185 |
| Rust creepage at the scribe |
0.214 |
0.078 |
0.514 |
0.569 |
0.384 |
0.463 |
Regression Analysis Using Power and Polynomial Fit
Linear regression analysis for a linear fit yielded favorable R-squared values for all performance parameters in various exposure condition combinations except for the number of coating defects developed and rust creepage at the scribe. R-squared values higher than 0.65 were chosen and based on favorable correlations from the linear fit, and a regression analysis was performed using a power fit.
Figure 74 shows the relationship between gloss changes in NW and NWS that yielded an
R-squared value of 0.94. Similarly, figure 75 shows the relationship between color variations in NW and NWS regressed using the power fit, resulting in an R-squared value of 0.96. Regression analysis of variation in adhesion strength for scribed panels was performed using a polynomial equation of 2d order with an R-squared value of 0.75. Figure 76 shows the analysis results.
Figure 77 shows the strong relationships among adhesion strength variations of scribed panels for the following:
-
ALT (dependent) versus NW (independent).
-
ALT (dependent) versus NWS (independent).
-
ME (dependent) versus NWS (independent).
ASP and UM did not have any changes in adhesion strength toward the end of the testing
period. As a result, the values of these adhesion strength variations were not used in the regression analysis.
Summary of Relationship Between Variables and Exposure Conditions
Table 20 summarizes the final R-squared values for favorable correlations among the performance parameters and exposure conditions.
Figure 74. Graph. Gloss reductions in NW versus gloss variations in NWS.
Figure 75. Graph. Color variations in NW versus NWS.
Figure 76. Graph. Relationship between adhesion strength variations of scribed panels in NW and NWS.
Figure 77. Graph. Relationship between adhesion strength variations of unscribed panels. 3.4 COMPREHENSIVE PERFORMANCE EVALUATION
Gloss and Color
All coating systems had similar gloss reduction in NW and NWS. In general, the salt solution spray had no effect on gloss reduction. ME had a larger impact on gloss reduction compared to NW and NWS.
EM had higher than 95 percent gloss reduction in both ALT and the outdoor exposures. The two-coat system, WBEP, and ASP had the highest gloss reduction in ME, while HBAC, HRCSA, and WBEP had the highest gloss reduction in ALT. HRCSA had the highest gloss reduction in NW
and NWS.
The color changes of the coating systems were dissimilar in both ALT and the outdoor exposures. For example, WBEP and HBAC had large E values in ALT compared to ME,
NW, and NWS.
UM and SLX exhibited strong UV resistance in both laboratory and outdoor exposures, as demonstrated by the low color and gloss reduction values. The two-coat system and ASP showed poor UV resistance in ME. EM and HRCSA exhibited poor UV resistance in all environments.
Presence of AR compounds can result in reduced weathering performance in outdoor exposure conditions since UV light causes modified surface appearance of AR coatings due to yellowing and/or chalking.
The binder of several coating systems (i.e., three-coat, EM, GFP, HBAC, WBEP, SLX, and UM) consisted of some degrees of aromaticity, which typically reduces the weatherability of these coating systems. The AR/AP ratio of all one-coat systems in table 6, when correlated with gloss reduction, demonstrated that higher AR/AP results in higher gloss reduction (figure 78).
Figure 78. Graph. Gloss reduction as a function of aromaticity.
Pencil Scratch Hardness
The coating hardness changes of the 10 coating systems after outdoor exposure were very similar to that after laboratory testing. ASP, SLX, and UM became harder after ALT and the outdoor exposures. The two-coat system, which did not exhibit a hardness change in ALT, had an increased hardness by about 1 degree in the outdoor exposure tests. The remaining six coating systems retained the same pencil scratch hardness.
Adhesion Strength
There were no significant adhesion strength changes for most coating systems except for SLX (ME), HBAC (all exposure conditions), and the two-coat system (ALT). A lack of significant decrease in adhesion strength after testing for any particular coating was observed.
Surface Appearance and Failure
As expected, coating systems developed more surface failures in ALT than in the outdoor exposures. UM had severe surface failures after ALT, moderate surface failure after exposure
to ME, and minimal surface failure in both NW and NWS.
ASP had severe surface failure in ALT but no surface failure in all three outdoor exposures. The two-coat system developed surface film cracking during ALT but not in other outdoor exposure conditions. EM had some invisible defects detected by a holiday detector after ALT, fewer defects after ME, and no defects in NW and NWS.
Rust Creepage
For most coating systems, the creepage developed in outdoor exposure was much smaller than the creepage developed in ALT for all of the coating systems. HRCSA had less than 0.039 inches
(1 mm) of creepage in all tests. SLX had about 1.21 inches (31 mm) of creepage in ME exposure, which was 0.35 inches (9 mm) greater than the rust creepage developed in ALT. This confirmed that three outdoor exposure conditions were milder than ALT for all coating systems except SLX.
Performance Ranking
All one-coat systems were ranked based on their performance in ALT and the three outdoor exposures. The total time of exposure conditions are as follows:
- ALT: 6,840 h.
- ME: 17,520 h.
- NW: 13,140 h.
- NWS: 13,140 h.
Each ALT cycle consisted of 360 h, while the outdoor exposures were continuous exposures for 24 months (ME) and 18 months (NW and NWS). Performance data can be weighed equally by calculating the rate of change of the variables per each cycle. The number of equivalent cycles for all exposure conditions based on a 360-hr cycle are as follows:
- ALT: 19 cycles.
- ME: 49 cycles.
- NW: 37 cycles.
- NWS: 37 cycles.
Weight of Exposure Conditions
It is important to weigh the exposure conditions based on their impact on the performance of the coating systems. Rust creepage, the number of coating defects, rusting and blister grades, color variation, gloss reduction, and variation in adhesion strength are quantitative parameters that indicate the impact of an exposure condition. Quantitative analysis was used to calculate the coefficient of impact of each exposure condition.
Rust creepage is a dynamically changing parameter, and the rate of change of this variable can be calculated from creepage data. Rate of creepage can be defined as the change in the value of creepage with time.
Where Δ indicates a change in the parameter.
The rate of creepage can be obtained from the slope of the linear fit of creepage plotted as a function of time. All parameters other than creepage are snapshots at specific periods of time
of exposure in all test conditions, and their rate of variation can be calculated per cycle. For example, the number of coating defects developed per cycle, the percentage of gloss reduction per cycle, color variation per cycle, and adhesion strength variation per cycle can be calculated for each coating system in all exposure conditions using the total time of exposure.
Linear regression analysis was used to fit creepage as a function of time, and the corresponding slope was obtained as the rate of creepage. Normalized values of rust creepage (rate), coating defects per cycle, color variation per cycle, gloss reduction per cycle, and adhesion strength variation per cycle were calculated for all coating systems in ALT, MW, NW, and NWS, and average values of each normalized parameter were calculated. Average coating defects, rust creepage, color, and gloss reductions are shown in table 21 through table 24.
An example for calculating the weighted average rate of the development of coating defects against a standard unit of 1 resulted in the following coefficients:
- ALT: 3.43/(3.43+0.37+0.59+0.52) = 0.70
- ME: 0.37/(3.43+0.37+0.59+0.52) = 0.07
- NW: 0.59/(3.43+0.37+0.59+0.52) = 0.12
- NWS: 0.52/(3.43+0.37+0.59+0.52) = 0.11
Table 21. Average coating defects developed.
| Coating System |
ALT |
ME |
NW |
NWS |
| Number of Coating Defects |
Coat Defects/
Cycle |
Number of Coating Defects |
Coat Defects/
Cycle |
Number of Coating Defects |
Coat Defects/
Cycle |
Number of Coating Defects |
Coat Defects/
Cycle |
| Three-coat |
1 |
0.05 |
1 |
0.02 |
1 |
0.03 |
0 |
0.00 |
| Two-coat |
100 |
5.26 |
0 |
0.00 |
1 |
0.03 |
0 |
0.00 |
| ASP |
100 |
8.33 |
0 |
0.00 |
4 |
0.11 |
0 |
0.00 |
| EM |
100 |
5.26 |
35 |
0.72 |
12 |
0.33 |
12 |
0.33 |
| HRCSA |
2 |
0.11 |
0 |
0.00 |
1 |
0.03 |
0 |
0.00 |
| HBAC |
7 |
0.50 |
0 |
0.00 |
1 |
0.03 |
0 |
0.00 |
| WBEP |
5 |
0.36 |
13 |
0.27 |
39 |
1.07 |
100 |
2.74 |
| SLX |
32 |
2.67 |
11 |
0.23 |
68 |
1.86 |
28 |
0.77 |
| UM |
100 |
8.33 |
100 |
2.05 |
67 |
1.84 |
30 |
0.82 |
| Average |
|
3.43 |
|
0.37 |
|
0.59 |
|
0.52 |
Table 22. Average rust creepage developed.
| Coating System |
ALT |
ME |
NW |
NWS |
| Rust Creepage at the Scribe (mm) |
Creepage/
Cycle |
Rust Creepage at the Scribe (mm) |
Creepage/
Cycle |
Rust Creepage at the Scribe (mm) |
Creepage/
Cycle |
Rust Creepage at the Scribe (mm) |
Creepage/
Cycle |
| Three-coat |
5.3 |
0.28 |
0 |
0.00 |
0 |
0.00 |
0.5 |
0.01 |
| Two-coat |
4.7 |
0.25 |
1.6 |
0.03 |
1.6 |
0.04 |
1.5 |
0.04 |
| ASP |
6.8 |
0.57 |
1.8 |
0.04 |
0 |
0.00 |
0 |
0.00 |
| EM |
6.5 |
0.34 |
0.9 |
0.02 |
0.6 |
0.02 |
1.6 |
0.04 |
| HRCSA |
0.7 |
0.04 |
1 |
0.02 |
0.7 |
0.02 |
0.7 |
0.02 |
| >HBAC |
9.3 |
0.66 |
1.3 |
0.03 |
0 |
0.00 |
3.7 |
0.10 |
| WBEP |
15.9 |
1.14 |
1.1 |
0.02 |
0.6 |
0.02 |
2.3 |
0.06 |
| SLX |
21.9 |
1.883 |
30.5 |
0.63 |
2.2 |
0.06 |
12.5 |
0.34 |
| UM |
35.6 |
2.97 |
5.2 |
0.11 |
0.7 |
0.02 |
6.6 |
0.18 |
| Average |
|
0.90 |
|
0.10 |
|
0.02 |
|
0.09 |
Table 23. Average color reduction.
| Coating System |
ALT |
ME |
NW |
NWS |
Color Reduction (CR)
(Δ E) |
CR/Cycle |
CR
(Δ E) |
CR/Cycle |
CR
(Δ E) |
CR/Cycle |
CR
(Δ E) |
CR/Cycle |
| Three-coat |
1.2 |
0.06 |
1 |
0.02 |
1 |
0.03 |
1 |
0.03 |
| Two-coat |
1.4 |
0.07 |
3.5 |
0.07 |
0.5 |
0.01 |
0.3 |
0.01 |
| ASP |
1.4 |
0.12 |
1.6 |
0.03 |
0.3 |
0.01 |
0.4 |
0.01 |
| EM |
8.6 |
0.45 |
9.6 |
0.20 |
14.4 |
0.39 |
15.3 |
0.42 |
| HRCSA |
6.3 |
0.33 |
9.8 |
0.20 |
6.3 |
0.17 |
8.2 |
0.22 |
| HBAC |
10.9 |
0.78 |
2.2 |
0.05 |
3.3 |
0.09 |
3.3 |
0.09 |
| WBEP |
4.7 |
0.34 |
1.9 |
0.04 |
1.5 |
0.04 |
1.7 |
0.05 |
| SLX |
3.1 |
0.26 |
0.4 |
0.01 |
0.8 |
0.02 |
0.4 |
0.01 |
| UM |
3.7 |
0.31 |
0.4 |
0.01 |
0.2 |
0.01 |
0.2 |
0.01 |
| Average |
|
0.30 |
|
0.07 |
|
0.09 |
|
0.09 |
Table 24. Average gloss reduction.
| Coating System |
Gloss Reduction (GR) Percent |
GR/Cycle |
GR Percent |
GR/Cycle |
GR Percent |
GR/Cycle |
GR Percent |
GR/Cycle |
| Three-coat |
50.9 |
2.68 |
28.9 |
0.59 |
29.5 |
0.81 |
14.2 |
0.39 |
| Two-coat |
60.3 |
3.17 |
91.5 |
1.88 |
39 |
1.07 |
34.5 |
0.95 |
| ASP |
27.6 |
2.30 |
52.7 |
1.08 |
10.1 |
0.28 |
15 |
0.41 |
| EM |
99 |
5.21 |
97.7 |
2.01 |
96.9 |
2.65 |
97.3 |
2.67 |
| HRCSA |
66.7 |
3.51 |
30.6 |
0.63 |
81.9 |
2.24 |
74.1 |
2.03 |
|
HBAC |
79.5 |
5.68 |
29.2 |
0.60 |
24.4 |
0.67 |
16.5 |
0.45 |
| WBEP |
77.8 |
5.56 |
66.9 |
1.37 |
59.3 |
1.62 |
63.8 |
1.75 |
| SLX |
18.5 |
1.54 |
32.8 |
0.67 |
20.6 |
0.56 |
12.4 |
0.34 |
| UM |
23.8 |
1.98 |
4.3 |
0.09 |
1.5 |
0.04 |
0.5 |
0.01 |
| Average |
|
3.51 |
|
0.99 |
|
1.11 |
|
1.00 |
Table 25 shows average weighted values for all evaluation parameters in ALT, ME, NW, and NWS. An average weighted coefficient was then calculated for all parameters. The final weighted average coefficients are as follows:
- ALT: 0.64.
- ME: 0.11.
- NW: 0.12.
- NWS: 0.13.
Table 25. Weighted average coefficients.
| Parameter |
ALT |
ME |
NW |
NWS |
| Creepage/cycle |
0.812 |
0.090 |
0.018 |
0.081 |
| Coating defects/cycle |
0.700 |
0.074 |
0.120 |
0.106 |
| Color reduction/cycle |
0.541 |
0.124 |
0.167 |
0.168 |
| Gloss reduction/cycle |
0.532 |
0.150 |
0.167 |
0.151 |
| Average |
0.646 |
0.110 |
0.118 |
0.126 |
The above weights can be assigned as coefficients to calculate the exposure condition weighted parameter values. For instance, gloss reduction of ASP in ALT at the end of testing is 27.6, which can be multiplied by 0.64 to obtain a weighted gloss reduction of 17.7. Table 26 shows
the exposure condition weighted creepage, gloss, color reduction, and values in ALT, ME, NW,
and NWS.
Weight of Performance Parameters
Rust creepage, coating defects development, gloss reduction, color variation, and adhesion used for ranking were assigned weight coefficients. The breakdown of weights assignment was based on previous knowledge of performance parameters and their overall impact and significance in evaluating a coating system. GFP was not included due to performance data not being available for outdoor exposure testing.
The performance parameters were assigned the following weights:
- Rust creepage: 0.35.
- Holidays: 0.25.
- Adhesion: 0.10.
- Color reduction: 0.15.
- Gloss reduction: 0.15.
Table 26. Weighted coating defects, color, gloss, adhesion, and creepage values.
| Coating System |
Rust Creepage at the Scribe (mm) |
Weighted Rust Creepage |
Number of Coating Defects |
Weighted Coating Defects |
Color Reduction, Δ E |
Weighted Color Reduction |
Gloss Reduction Percent |
Weighted Gloss Reduction |
Adhesion Strength Variation |
Weighted Adhesion Strength Variation |
| ALT |
| Three-coat |
5.3 |
3.39 |
1 |
0.64 |
1.2 |
0.77 |
50.9 |
32.58 |
0.117 |
0.07 |
| Two-coat |
4.7 |
3.01 |
100 |
64.00 |
1.4 |
0.90 |
60.3 |
38.59 |
0.089 |
0.06 |
| ASP |
6.8 |
4.35 |
100 |
64.00 |
1.4 |
0.90 |
27.6 |
17.66 |
0.039 |
0.02 |
| EM |
6.5 |
4.16 |
100 |
64.00 |
8.6 |
5.50 |
99 |
63.36 |
0.090 |
0.06 |
| HRCSA |
0.7 |
0.45 |
2 |
1.28 |
6.3 |
4.03 |
66.7 |
42.69 |
0.011 |
0.01 |
| HBAC |
9.3 |
5.95 |
7 |
4.48 |
10.9 |
6.98 |
79.5 |
50.88 |
0.062 |
0.04 |
| WBEP |
15.9 |
10.18 |
5 |
3.20 |
4.7 |
3.01 |
77.8 |
49.79 |
0.102 |
0.07 |
| SLX |
21.9 |
14.02 |
32 |
20.48 |
3.1 |
1.98 |
18.5 |
11.84 |
0.108 |
0.07 |
| UM |
35.6 |
22.78 |
100 |
64.00 |
3.7 |
2.37 |
23.8 |
15.23 |
0.164 |
0.10 |
| ME |
| Three-coat |
0 |
0.00 |
1 |
0.11 |
1 |
0.11 |
28.9 |
3.18 |
0.158 |
0.02 |
| Two-coat |
1.6 |
0.18 |
0 |
0.00 |
3.5 |
0.39 |
91.5 |
10.07 |
0.041 |
0.00 |
| ASP |
1.8 |
0.20 |
0 |
0.00 |
1.6 |
0.18 |
52.7 |
5.80 |
0.032 |
0.00 |
| EM |
0.9 |
0.10 |
35 |
3.85 |
9.6 |
1.06 |
97.7 |
10.75 |
0.122 |
0.01 |
| HRCSA |
1 |
0.11 |
0 |
0.00 |
9.8 |
1.08 |
30.6 |
3.37 |
0.011 |
0.00 |
| HBAC |
1.3 |
0.14 |
0 |
0.00 |
2.2 |
0.24 |
29.2 |
3.21 |
0.061 |
0.01 |
| WBEP |
1.1 |
0.12 |
13 |
1.43 |
1.9 |
0.21 |
66.9 |
7.36 |
0.185 |
0.02 |
| SLX |
30.5 |
3.36 |
11 |
1.21 |
0.4 |
0.04 |
32.8 |
3.61 |
0.106 |
0.01 |
| UM |
5.2 |
0.57 |
100 |
11.00 |
0.4 |
0.04 |
4.3 |
0.47 |
0.183 |
0.02 |
| NW |
| Three-coat |
0 |
0.00 |
1 |
0.12 |
1 |
0.12 |
29.5 |
3.54 |
0.157 |
0.02 |
| Two-coat |
1.6 |
0.19 |
1 |
0.12 |
0.5 |
0.06 |
39 |
4.68 |
0.061 |
0.01 |
| ASP |
0 |
0.00 |
4 |
0.48 |
0.3 |
0.04 |
10.1 |
1.21 |
0.061 |
0.01 |
| EM |
0.6 |
0.07 |
12 |
1.44 |
14.4 |
1.73 |
96.9 |
11.63 |
0.144 |
0.02 |
| HRCSA |
0.7 |
0.08 |
1 |
0.12 |
6.3 |
0.76 |
81.9 |
9.83 |
0.013 |
0.00 |
| HBAC |
0 |
0.00 |
1 |
0.12 |
3.3 |
0.40 |
24.4 |
2.93 |
0.079 |
0.01 |
| WBEP |
0.6 |
0.07 |
39 |
4.68 |
1.5 |
0.18 |
59.3 |
7.12 |
0.161 |
0.02 |
| SLX |
2.2 |
0.26 |
68 |
8.16 |
0.8 |
0.10 |
20.6 |
2.47 |
0.163 |
0.02 |
| UM |
0.7 |
0.08 |
67 |
8.04 |
0.2 |
0.02 |
1.5 |
0.18 |
0.200 |
0.02 |
| NWS |
| Three-coat |
0.5 |
0.07 |
0 |
0.00 |
1 |
0.13 |
14.2 |
1.85 |
0.188 |
0.02 |
| Two-coat |
1.5 |
0.20 |
0 |
0.00 |
0.3 |
0.04 |
34.5 |
4.49 |
0.052 |
0.01 |
| ASP |
0 |
0.00 |
0 |
0.00 |
0.4 |
0.05 |
15 |
1.95 |
0.051 |
0.01 |
| EM |
1.6 |
0.21 |
12 |
1.56 |
15.3 |
1.99 |
97.3 |
12.65 |
0.134 |
0.02 |
| HRCSA |
0.7 |
0.09 |
0 |
0.00 |
8.2 |
1.07 |
74.1 |
9.63 |
0.016 |
0.00 |
| HBAC |
3.7 |
048 |
0 |
0.00 |
3.3 |
0.43 |
16.5 |
2.15 |
0.083 |
0.01 |
| WBEP |
2.3 |
0.30 |
100 |
13.00 |
1.7 |
0.22 |
63.8 |
8.29 |
0.176 |
0.02 |
| SLX |
12.5 |
1.63 |
28 |
3.64 |
0.4 |
0.05 |
12.4 |
1.61 |
0.163 |
0.02 |
| UM |
6.6 |
0.86 |
30 |
3.90 |
0.2 |
0.03 |
0.5 |
0.07 |
0.221 |
0.03 |
Numerical weighted values of all performance parameters from table 26 for each coating system were averaged to obtain the exposure condition and performance parameter weighted values. Table 27 shows the calculation of final average values for the three-coat system as an example. The resultant values are displayed in row 1 of table 28 excluding the final column. Similar calculations for the remaining coating systems are shown in the rest of table 28.
Table 27. Average performance parameter calculation for the three-coat system.
| Performance Parameter |
Average Value |
| Rust creepage |
(3.392+0+0+0.065)/4 = 0.864 |
| Coating defects |
(0.64+0.11+0.12+0)/4 = 0.218 |
| Color reduction |
(0.768+0.11+0.12+0.13)/4 = 0.282 |
| Gloss reduction |
(32.576+3.179+3.540+1.846)/4 = 10.285 |
| Adhesion strength |
(0.075+0.017+0.019+0.024)/4 = 0.034 |
Weights assigned above were used to calculate the final performance parameter and exposure condition weighted average as follows:

Final average or overall parameter was then calculated for ALT, ME, NW, and NWS. Exposure condition and performance parameter weighted values from row 1 were input into the equation as final average to obtain the “Overall Parameter” column in table 28 .
Performance Rank
The far right column in table 28 was used to rank the coating systems, and the comprehensive ranking is shown in table 29. Based on the final average values, the coating systems were ranked 1 (best) through 9 (worst). For instance, a coating system with the lowest average was assigned a rank of 1. This is a true characteristic of a coating system since a low final average value indicates good performance.
Table 28. Weighted performance parameters.
| Coating System |
Rust Creepage |
Coating Defects |
Color Reduction |
Gloss Reduction |
Adhesion Strength |
Overall Parameter |
| Three-coat |
0.864 |
0.218 |
0.282 |
10.285 |
0.034 |
38.91 |
| Two-coat |
0.893 |
16.030 |
0.345 |
14.456 |
0.019 |
130.84 |
| ASP |
1.138 |
16.120 |
0.290 |
6.676 |
0.011 |
109.42 |
| EM |
1.135 |
17.713 |
2.569 |
24.596 |
0.026 |
178.05 |
| HRCSA |
0.183 |
0.350 |
1.733 |
16.379 |
0.003 |
57.37 |
| HBAC |
1.644 |
1.150 |
2.011 |
14.791 |
0.017 |
67.70 |
| WBEP |
2.667 |
5.578 |
0.905 |
18.140 |
0.032 |
103.75 |
| SLX |
4.815 |
8.373 |
0.544 |
4.883 |
0.030 |
91.91 |
| UM |
6.075 |
21.735 |
0.616 |
3.988 |
0.044 |
165.09 |
Table 29. Comprehensive rank of one-coat and control systems.
| Coating System |
Rank |
Final Average |
| Three-coat |
1 |
38.91 |
| HRCSA |
2 |
57.37 |
| HBAC |
3 |
67.70 |
| SLX |
4 |
91.91 |
| WBEP |
5 |
103.75 |
| ASP |
6 |
109.42 |
| Two-coat |
7 |
130.84 |
| UM |
8 |
165.09 |
| EM |
9 |
178.05 |
Evaluation of Coating Systems Based on Ranking
The overall ranking resulted in the three-coat system with the best performance rating followed by HRCSA, HBAC, and WBEP. While positive performance was expected for the three-coat system, the two-coat system was ranked 7th out of all of the coating systems. This reduced ranking can be attributed to the fact that the two-coat system developed an excessive number
of coating defects and surface cracking in ALT. The weight coefficient of ALT is the
highest among all exposure conditions, which has contributed to the lowered ranking of the
two-coat system. Another important reason why the two-coat system may have had a lower comprehensive ranking is due to moderate gloss reduction in ALT and significant gloss reduction in ME, NW, and NWS. Also, it had significantly high rust creepage in ME and
NW and moderate rust creepage in NWS. Note that the above described behavior and ranking
for the three-coat and the two-coat control systems are based on the evaluation of a particular type of three-coat and two-coat system. The performance and ranking may change if a different type of three-coat or two-coat system were to be evaluated.
Although UM had good color and gloss retention properties in ALT, ME, NW, and NWS, it had high rust creepage and developed blisters, so it was removed from the study after 4,320 h of laboratory testing. EM developed moderate rust creepage and coating defects in outdoor exposures but had very low gloss and color retention properties in all testing conditions. This behavior resulted in low ranking of UM and EM at 8 and 9, respectively.
HBAC and WBEP both demonstrated moderate rust creepage in all exposure conditions except NWS, where WBEP developed high coating defects. Also, WBEP demonstrated higher rusting and blistering in comparison to HBAC. Both of these coating systems showed low color and gloss retention properties, placing them at the lower end of the spectrum. HBAC had a ranking
of 3 followed by WBEP at 5.
SLX and ASP were removed from the study after 4,320 h of laboratory testing due to severe blistering and creepage. Although SLX and ASP had moderate to good color and gloss retention, SLX had severe rust creepage in ALT, ME, and NWS with relatively higher rust creepage in NW. ASP had many coating defects that developed in ALT in comparison to SLX. This resulted in a ranking of 4 for SLX and 6 for ASP.
The best performing coating systems were the three-coat system followed by HRCSA. Rust creepage at the scribe followed by the development of coating defects carried the highest weight of coefficients in calculating the final average. Both coating systems had very low rust creepage and little coating defects development, although HRCSA had very low color and gloss retention properties. The three-coat system had higher color and gloss retention properties in comparison to HRCSA, so it had a ranking of 1, followed by HRCSA at 2.
|


