U.S. Department of Transportation
Federal Highway Administration
1200 New Jersey Avenue, SE
Washington, DC 20590
202-366-4000
Federal Highway Administration Research and Technology
Coordinating, Developing, and Delivering Highway Transportation Innovations
 |
| This report is an archived publication and may contain dated technical, contact, and link information |
|
Publication Number:
FHWA-HRT-04-107
|
Previous | Table of Contents | Next
The engineering use of FRP piles on a widespread basis presently raises the need to establish testing procedures to determine the dynamic properties of FRP composite materials. In particular, PDA tests and full-scale loading tests on FRP piles must be conducted to establish site correlations for evaluating the use of wave equation analysis in predicting static piling capacity and evaluating pile drivability and integrity. The main objective of the study described in this chapter was to conduct a full-scale experiment including dynamic and static load tests on FRP piles to address these engineering needs.
PDA and PIT test results were analyzed using CAPWAP(1,45-46) and GRLWEAP(47) programs to establish the dynamic properties of the FRP piles. The PDA was also used to evaluate the feasibility of installing FRP piles using standard pile driving equipment. Pile-bearing capacities were assessed using the CAPWAP program with the dynamic data measured by the PDA, and the calculated pile capacities were compared to the results of SLTs performed on the four FRP piles.
The test piles were driven with an ICE 70 single-acting, variable stroke hydraulic hammer. According to the manufacturer's literature, this hammer has a 31.1-kN (7.0-kip) ram with a maximum rated energy of 28.5 kJ (21 ft-kips) at a maximum stroke of 91.4 cm (3 ft). This hammer has a pump-controlled stroke, and during the initial driving and restrike, the stroke was varied from 30.5 to 91.4 cm (1 to 3 ft). Plywood cushions were used to protect the pile top. In most cases during driving and restriking, the cushion was nominally 24.8 cm (9.75 inches) thick. 15.2-cm- (6-inch-) thick cushions were used to drive the Lancaster piles.
Dynamic measurements of strain and acceleration were taken 91.4 cm to 1.5 m (3 to 5 ft) below the head of the test piles. During initial drive, two strain transducers and two accelerometers were bolted at opposite sides of the pile to monitor strain and acceleration. During redrive, four strain transducers and four accelerometers were attached to the pile. Strain and acceleration signals were conditioned and converted to forces and velocities by the PDA. During driving, the PDA calculated values of the maximum transferred hammer energy and the maximum compression stress at the gauge location, and an estimate of the pile capacity by the Case Method.(8) These results were displayed on the PDA monitor for every blow.
Force and velocity records from the PDA were also displayed on a graphic liquid crystal display (LCD) screen to evaluate data quality, soil resistance distribution, and pile integrity. The force and velocity records were also digitally stored on a disc for subsequent laboratory analysis.
Figures 68 through 71 show the FRP piles before and after driving. Site observations on drivability and durability during installation of the test piles are summarized below.
The steel pile was driven with the lowest blow counts (36 blows/m (11 blows/ft)) and the highest transfer energy of 23.1 kJ (17 ft-kips); this pile, however, was driven without a plywood pile cushion and with a helmet specifically designed for steel pipe piles. Adding 15.2 to 24.8 cm (6 to 9.75 inches) of pile cushion may explain some of the energy losses and increased blow counts observed with the other piles.
Among the FRP piles, the SEAPILE pile was driven with the lowest blow counts (62 to 118 blows/m (19 to 36 blows/ft)), and showed relatively high transfer energies of 13.6 to 17.6 kJ (10 to 13 ft-kips) at the end of driving. The pile cushion for these piles showed very little degradation after driving.
The PPI piles were driven with blow counts ranging between 1 to 1.4 blows/mm (27 to 37 blows/inch), and transfer energies at the gauge location of 8.1 to 10.8 kJ (6 to 8 ft-kips), significantly lower than those obtained for the SEAPILE and Lancaster Composite, Inc., piles. After driving, it was observed that the PPI piles experienced severe pile top degradation; the plastic matrix covering the rebar had melted and some pieces of the steel rebar had sheared off. The heat and pile top damage could have been the reason for the losses in the transfer energy. After driving, the upper foot of each PPI pile was removed, and no damage or separation between bars and the plastic material was observed.
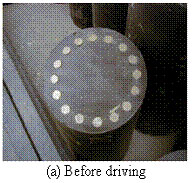
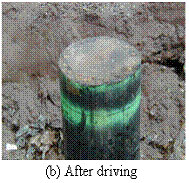
Figure 68. Photo. PPI pile.
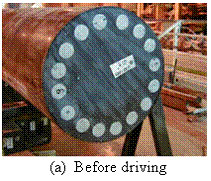
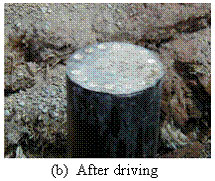
Figure 69. Photo. SEAPILE pile.
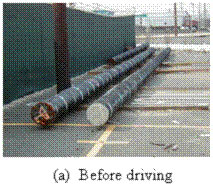
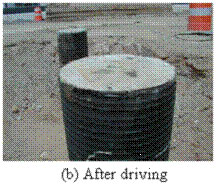
Figure 70. Photo. Lancaster Composite, Inc., pile.
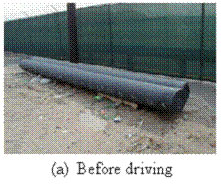
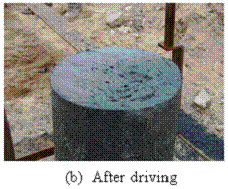
Figure 71. Photo. American Ecoboard pile.
At the end of installation (EOI), the Lancaster Composite, Inc., piles had blow counts ranging from 154 to 305 blows/m (47 to 93 blows/ft), with calculated transfer energy values of 12.2 to 17.6 kJ (9 to 13 ft-kips) at the end of drive. It should be noted that to reduce the estimated tension stresses, the Lancaster Composite, Inc., SLT pile was driven with a reduced stroke of 61.0 cm (2 ft) for the last few feet of penetration; this driving process resulted in a higher blow count of 305.1 blows/m (93 blows/ft). By the EOI of these piles, it was observed that the pile cushion had experienced initial burning.
The Lancaster Composite, Inc., pile that was driven to refusal (almost 0.4 blows/mm (10 blows/ inch)) into the weathered shale at the depth of 26.5 m (87 ft) below grade was spliced. Driving resistance ranged from 164 to 299 blows/m (50 to 91 blows/ft) for a penetration of 18.8 to 26.5 m (60 to 87 ft).
The American Ecoboard piles were driven into the upper sand layer at approximately 9.1 m (30 ft) below the ground surface. They were spliced at the depth of 6 m (19.7 ft). After splicing, the American Ecoboard dynamic testing results evidenced a toe signal, which indicated that the stress wave propagated through the splice. A significant impedance increase followed by a sharp decrease was observed at the splice location. This wave reflection is likely to be the result of the additional steel bolts and sleeve, as well as of a slight gap between the two sections.
Before dynamic testing, several material properties at the gauge location have to be determined. These data include the pile length, cross-sectional area, specific weight, wave speed, and elastic modulus. Testing procedures to establish the dynamic elastic modulus of FRP composite piles have not yet been established or evaluated. For the purpose of this study, the dynamic testing procedures commonly used for steel and concrete piles have been followed to evaluate the dynamic properties of the composite piles, including:
These testing procedures are briefly summarized below.
Before initial installation, low-strain integrity testing was performed with a PIT. The PIT testing (ASTM D5882) consists of attaching a small accelerometer to the pile top sample and using a small handheld hammer to lightly impact the pile sample top. This impact induces a low-strain stress wave in the pile, which travels to the pile toe and reflects back toward the pile top. With the length of the pile sample known, a wave speed, c, can be calculated from the time measured between the impact and the toe response. The wave speed can, in turn, be used with a known material density, r, to calculate the low-strain dynamic modulus using the relationship in figure 72.

Figure 72. Equation. Dynamic modulus E.
PDA testing yields wave speed following a procedure similar to that used for low-strain PIT tests. For a specified length of the pile, the time between impact and toe response can be used to estimate an overall wave speed. The dynamic modulus, E, can be determined using the equation in figure 72.
This method involves the initial portion of the high-strain records and the expected proportionality between measured strain and wave speed. Assuming that for low strains, the FRP piles behave as a linear elastic material and no changes in resistance or pile properties occur during the pile installation for the initial part of the high-strain record, this assumption implies that the wave speed is directly proportional to the measured strain and can, therefore, be calculated from the equation in figure 73.
![]()
Figure 73. Equation. Pile particle speed v.
Where:
v = Pile particle speed calculated from the acceleration record.
e = Measured strain.
c = material wave speed.
The dynamic modulus, E, then can be determined using the equation in figure 72.
PIT tests were performed before driving on American Ecoboard, Lancaster Composite, Inc., PPI, and SEAPILE full-scale piles. For the FRP piles, the foam (i.e., outer layer) is stiffer than the core (i.e., inner layer). Therefore, for the American Ecoboard piles, the PIT tests were conducted on the outer layer, and for the SEAPILE and PPI piles, tests were conducted on the fiberglass bars and the reinforced foam, respectively.
In a linearly elastic pile material, such as steel or concrete, the wave speed determined from the proportionality condition (figure 73) is equal to the overall wave speed calculated from the PDA results. In the case of FRP piles, however, the overall wave speeds obtained with PIT, cl, PDA, ch, and the proportional wave speed, cp, values were consistently different. Table 11 summarizes these results.
| Pile Type | Specific Weight(1) | Low Strain (PIT) | High Strain (PDA) | ||||
|---|---|---|---|---|---|---|---|
| kN/m3 (lb/ft3) | Measured Wave Speed (Test I) cl , m/s (ft/s) | Estimated Elastic Mod.El, kPa (ksi) | Proportional Wave Speed (Test II) cp, m/s (ft/s) | Estimated Elastic Mod. Ep, kPa (ksi) | Overall Wave Speed (Test III) ch, m/s (ft/s) | Estimated Elastic Mod. Eh, kPa (ksi) | |
| American Ecoboard | 7.9 (50) | 1524 (5000) | 1.86 x 10⁶ (270) | 1828.8 (6000) | 2.68 x 10⁶ (388) | 1371.6 (4500) | 1.50 x 10⁶ (218) |
| Lancaster Composite | 22.0 (140) | 4114.8 (13500) | 37.94 x 10⁶ (5503) | 4175.76 (13700) | 39.07 x 10⁶ (5667) | 4023.36 (13200) | 36.27 x 10⁶ (5261) |
| PPI | 8.0 (51) | 3505.2 (11500) | 10.03 x 10⁶ (1455) | 3810 (12500) | 11.85 x 10⁶ (1719) | 3322.32 (10900) | 9.01 x 10⁶ (1307) |
| SEAPILE | 8.5 (54) | 2743.2 (9000) | 6.50 x 10⁶ (943) | 3048 (10000) | 8.03 x 10⁶ (1165) | 2529.84 (8300) | 5.53 x 10⁶ (802) |
(1) Reported by the manufacturers.
The PDA data analysis was conducted to obtain the dynamic properties, including Smith damping and soil quake, and evaluate the load-set response and the static bearing capacity of the FRP piles. The dynamic analysis involved:
The dynamic analysis results were compared to the results of SLTs performed on four FRP piles.
During the PDA testing, the Case Method is used to interpret the measured dynamic data to assess the hammer and driving system performance, determine pile head compression stresses, evaluate structural integrity, and estimate the static pile capacity. Table 12 summarizes the PDA dynamic test results, including the maximum measured pile top strain, maximum compressive stress, maximum estimated tensile stress, transfer energy to pile, hammer operating rate, and the pile capacities calculated by the case method and by CAPWAP analysis. The maximum compressive and tensile stresses were calculated using the dynamic elastic modulus obtained with the PDA testing, considering the wave speed-strain proportionality condition of the initial portion of the high-strain records.
The CAPWAP Version 2000-1 was used with the data recorded in the field to evaluate the ultimate pile capacity of the tested piles. CAPWAP analyses compute soil resistance forces and their approximate distribution using the velocity and speed data recorded in the field during the dynamic pile testing. The CAPWAP results include an evaluation of the soil resistance distribution, soil quake and damping factors, and a simulated static load-set graph. The static load-set simulation is based upon the CAPWAP calculated static resistance parameters and the elastic compression characteristics of the pile. For each pile, the three elastic modulus values calculated from PDA and PIT tests as reported in table 11 were considered. The CAPWAP analyses using the elastic modules calculated from PDA testing and considering the initial portion of the high-strain records (1) yielded the most reasonable energy values for the ICE 70 hammer and (2) predicted load-set curves that yielded the best correlation with SLT results. CAPWAP static capacities calculated using the dynamic elastic modulus values are reported in table 13.
| Pile Designation | Test Date | Pile Penetration,(1) m (ft) | Blow Count,(1) blows/m (blows/ft) | Average Maximum Measured Strain (me) | Average Maximum Compressive Stress,2 kPa (ksi) | Maximum Estimate Tensile Stress,3 kPa (ksi) | Average Transfer Energy,2 kJ (ft-kips) | Hammer Rate, blows/min | Case Method Capacity,4 kN (kips) | CAPWAP Estimated Capacity, kips | Remarks5 |
|---|---|---|---|---|---|---|---|---|---|---|---|
| Steel Reference | 11/14/01 | 18.9 (62) | 36.1 (11) | 714 | 147,547.8 (21.4) | NA | 23.1(17) | 47 | 413.7 (93) | 489.3 (110) | EOI |
| 5/24/02 | 18.6 (61) | 0.31 b/mm (8/inch) | 499 | 103,421.4 (15.0) | NA | 13.6 (10) | 45 | 1267.7 (285) | 1156.5 (260) | BOR | |
| Ecoboard | 5/22/02 | 8.8 (29) | 98.4 (30) | 1540 | 4,136.9 (0.6) | 689.5 (0.1) | 12.2 (9) | 76 | 435.9 (98) | 382.5 (86) | EOI, Section 2; 9.75-inch cushion |
| Lancaster 1 | 11/14/01 | 17.7 (58) | 210.0 (64) | 392 | 151,684.7 (2.2) | 3447.5 (0.5) | 14.9 (11) | 50 | 186.8 (42) | - | ID, Section 1; 9.75-inch cushion |
| 11/14/01 | 26.5 (87) | 298.6 (91) | 523 | 199,948.0 (2.9) | 5516 (0.8) | 17.6 (13) | 49 | 1450 (326) | - | EOI, Section 2; 7.5-inch cushion | |
| 5/24/02 | 26.2 (86) | 1.5 b/mm (77/ 0.5 inch) | 448 | 16,547.4 (2.5) | 4137 (0.6) | 16.3 (12) | 43 | 2375.2 (534) | 2090.6 (470) | EOR | |
| Lancaster 4 | 11/15/01 | 17.7 (58) | 154.2 (47) | 377 | 14,479.0 (2.1) | 5516 (0.8) | 12.2 (9) | 52 | 346.9 (78) | - | EOI; 6-inch cushion |
| 5/24/02 | 17.1 (56) | 0.96 b/mm (25/inch) | 324 | 12411 (1.8) | 1379 (0.2) | 9.5 (7) | 52 | 1072 (241) | - | BOR | |
| Lancaster 3 (SLT) | 11/15/01 | 17.7 (58) | 154.2 (93) | 399 | 15858.5 (2.3) | 8274 (1.2) | 13.6 (10) | 56 | 480.4 (108) | 516 (116) | EOI; 6-inch cushion; 2-ft stroke |
| 5/24/02 | 17.1 (56) | 1.20 b/mm (31 / inch) | 309 | 11721.5 (1.7) | 1379 (0.2) | 9.5 (7) | 44 | 1049.7 (236) | 1000.8 (225) | BOR | |
| PPI 5 | 11/15/01 | 19.2 (63) | 121.4 (37) | 436 | 5171.25 (0.75) | 2068.5 (0.3) | 9.5 (7) | 49 | 453.7 (102) | - | EOI; 9.75-inch cushion |
| 5/23/02 | 17.7 (58) | 0.94 b/mm (24 / inch) | 514 | 6205.5 (0.9) | 689.5 (0.1) | 6.8 (5) | 45 | 756.2 (170) | - | BOR | |
| PPI 7 | 11/15/01 | 19.05 (62.5) | 111.5 (34) | 535 | 6205.5 (0.9) | 2068.5 (0.3) | 10.9 (8) | 48 | 484.8 (109) | - | EOI; 9.75-inch cushion |
| 5/23/02 | 17.7 (58) | 0.82 b/mm (21 / inch) | 529 | 6205.5 (0.9) | 1379 (0.2) | 6.8 (5) | 44 | 791.7 (178) | - | BOR | |
| PPI 6 (SLT) | 11/15/01 | 18.6 (61) | 88.6 (27) | 373 | 4137 (0.6) | 2068.5 (0.3) | 8.1 (6) | 47 | 387 (87) | 409.2 (92) | EOI; 9.75-inch cushion |
| 5/24/02 | 17.7 (58) | 0.86 b/mm (22 / inch) | 654 | 7584.5 (1.1) | 1379 (0.2) | 10.9 (8) | 44 | 938.5 (211) | 978.6 (220) | BOR | |
| Seaward 8 | 11/16/01 | 18.6 (61) | 78.7 (24) | 875 | 6895 (1.0) | 2758 (0.4) | 13.6 (10) | 57 | 382.5 (86) | - | EOI; 9.75-inch cushion |
| 5/22/02 | 17.7 (58) | 0.86 b/mm (22 / inch) | 858 | 6895 (1.0) | 1379 (0.2) | 12.2 (9) | 56 | 885.2 (199) | - | BOR | |
| Seaward 10 | 11/16/01 | 18.6 (61) | 62.3 (19) | 855 | 6895 (1.0) | 2758 (0.4) | 17.6 (13) | 54 | 516 (116) | - | EOI; 9.75-inch cushion |
| 5/22-3/02 | 17.7 (58) | 0.39 b/mm (10 / inch) | 926 | 7584.5 (1.1) | 1379 (0.2) | 16.3 (12) | 43 | 978.6 (220) | - | BOR | |
| Seaward 9 (SLT) | 11/16/01 | 18.7 (61.3) | 118.1 (36) | 758 | 6205.5 (0.9) | 2758 (0.4) | 12.2 (9) | 57 | 516 (116) | 520.4 (117) | EOI; 9.75-inch cushion |
| 5/23/2002 | 17.7 (58) | 0.51 b/mm (13 / inch) | 1074 | 8274 (1.2) | 1379(0.2) | 14.9 (11) | 45 | 978.6 (220) | 1067.5 (240) | BOR-Original CW |
(1) Pile penetrations from ground surface for initial installation and bottom of excavation for restrike. 1 inch = 2.54 cm, 1 ft = 0.305 m
2 Measured at the location of the transducers.
3 Maximum tension stress estimated over all blows.
4 Using RX9 (maximum case method with Jc = 0.90) equation.
5 Unless otherwise noted, 3-ft hammer stroke.
BOR—Beginning of redrive.
EOI—End of installation.
CAPWAP analyses were performed on the records obtained for both the EOI and the beginning of restrike (BOR) of each SLT pile, the steel reference pile, and the Lancaster Composite, Inc., pile (No. 1), which was driven to refusal. The results are summarized in table 13.
| Pile Designation | Penetration Depth in Soil, m (ft) | Driving Resistance, blows/set | CAPWAP | Remarks | ||||||
|---|---|---|---|---|---|---|---|---|---|---|
| Static Capacity Estimate | Smith Damping | Soil Quakes | ||||||||
| Shaft, kN (kips) | Toe, kN (kips) | Total, kN (kips) | Shaft, s/m (s/ft) | Toe, s/m (s/ft) | Shaft, mm (inch) | Toe, mm (inch) | ||||
| Steel Pile | 18.9 (62) | 11/ft | 369.2 (83) | 120.1 (27) | 489.3 (110) | 0.26 (0.08) | 0.16 (0.05) | 2.8 (0.11) | 26.9 (1.06) | EOI |
| 18.3 (60) | 8/inch | 1049.7 (236) | 106.8 (24) | 1156.5 (260) | 0.69 (0.21) | 0.66 (0.2) | 2.3 (0.09) | 6.9 (0.27) | BOR | |
| American Ecoboard (SLT) | 8.8 (29) | 30/ft | 102.3 (23) | 280.2 (63) | 382.5 (86) | 0.95 (0.29) | 1.05 (0.32) | 2.8 (0.11) | 16.0 (0.63) | EOI; after splicing |
| Lancaster 1 | 25.9 (85) | 77/0.5 inch | 702.8 (158) | 1387.8 (312) | 2090.6 (470) | 0.66 (0.2) | 1.05 (0.32) | 2.5 (0.10) | 1.27 (0.05) | EOR; pile driven to refusal |
| Lancaster 3 (SLT) | 17.7 (58) | 93/ft | 240.2 (54) | 275.8 (62) | 516 (116) | 0.66 (0.2) | 0.1 (0.03) | 3.0 (0.12) | 18.3 (0.72) | EOI |
| 18.3 (60) | 32/inch | 836.2 (188) | 164.6 (37) | 1000.8 (225) | 1.12 (0.34) | 1.25 (0.38) | 2.0 (0.08) | 3.8 (0.15) | BOR | |
| PPI 6 (SLT) | 18.6 (61) | 27/ft | 329.2 (74) | 80.1 (18) | 409.2 (92) | 0.39 (0.12) | 0.69 (0.21) | 3.6 (0.14) | 16 (0.63) | EOI |
| 17.7 (58) | 22/inch | 818.4 (184) | 160.1 (36) | 978.6 (220) | 0.75 (0.23) | 1.28 (0.39) | 3.3 (0.13) | 3.8 (0.15) | BOR | |
| Seaward 9 (SLT) | 18.7 (61.3) | 36/ft | 400.3 (90) | 120.1 (27) | 520.4 (117) | 0.66 (0.2) | 0.79 (0.24) | 2.3 (0.09) | 15.5 (0.61) | EOI |
| 17.4 (57) | 130 | 969.7 (218) | 97.9 (22) | 1067.5 (240) | 0.98 (0.3) | 1.25 (0.38) | 2.5 (0.10) | 2.8 (0.11) | BOR | |
| 17.4 (57) | 130 | 809.5 (182) | 84.5 (19) | 889.6 (200) | 0.89 (0.27) | 1.45 (0.45) | 2.5 (0.10) | 2.0 (0.08) | BOR; revised with SLT | |
BOR—Beginning of restrike.
EOI—End of installation.
EOR—End of redrive.
Table 14 shows the quake and damping values recommended by the consulting firm GRL Engineers, Inc., for various types of soils and piles.
| Soil Type | Pile Type or Size | Quake mm (in) | Damping Factors/m (s/ft) | |
|---|---|---|---|---|
| Shaft Quake | All soil types | All Types | 2.5 (0.10) | - |
| Toe Quake | All soil types, soft rock | Open ended pipes | 2.5 (0.10) | - |
| In dry soils, or in very dense or hard soils | Displacement piles of diameter D or width D | D/120 | - | |
| In submerged soils or in loose or soft soils | Displacement Piles of diameter D or width D | D/60 | - | |
| Shaft Damping | Noncohesive soils | - | - | 0.16 (0.05) |
| Cohesive soils | - | - | 0.65 (0.20) | |
| Toe Damping | In all soil types | - | - | 0.50 (0.15) |
Comparison of the CAPWAP analysis results reported in table 13 and the GRL recommendations summarized in table 14 leads to the following conclusions:
To evaluate the dynamic testing procedures used to obtain the dynamic elastic modulus of the FRP piles (i.e., PIT, the PDA testing—high-strain record, and the PDA testing considering the proportionality condition), a parametric study was conducted using the GRLWEAP Version 2002-1 program. GRLWEAP computes the number of blows per foot and the energy at the pile top. The parametric study consisted of calculating, for each FRP pile, the transfer energy obtained by PDA, the static capacity calculated by CAPWAP, and the number of blows per foot using the different elastic modulus values obtained with these testing procedures (table 15). The calculated transfer energy was compared to the PDA results, and the calculated blow counts were compared to the measured number of blows per inch at the beginning of restriking of each pile. CAPWAP results, including ultimate pile capacity, soil quake, and toe and shaft damping are used as GRLWEAP input data (table 13).
| Pile Manufacturer | Measured Elastic Modulus, kPa (ksi) | Measured Number of Blows, blows/m (blows/ft) | Calculated Number of Blows (GRLWEAP), kN/m (kips/ft) | Measured Energy (PDA), kN/m (kips/ft) | Calculated Energy (GRLWEAP), kN/m (kips/ft) | |
|---|---|---|---|---|---|---|
| SEAPILE | PIT—low strain | 6.5 x 10⁶ (943) | 515.1 (157) | 18427.2 (1263) | 160.5 (11) | 145.9 (10) |
| PDA—high strain | 5.5 x 10⁶ (802) | 4537.5 (311) | 145.9 (10) | |||
| PDA—early portion of high-strain records | 8 x 10⁶ (1165) | 2290.6 (157) | 145.9 (10) | |||
| PPI | PIT—low strain | 10 x 106 (1455) | 872.7 (266) | 21899.6 (1501) | 116.7 (8) | 116.7 (8) |
| PDA—high strain | 9 x 10⁶ (1307) | 7893.2 (541) | 116.7 (8) | |||
| PDA—early portion of high-strain records | 11.9 x 10⁶ (1719) | 3881 (266) | 116.7 (8) | |||
| American Ecoboard | PIT—low strain | 1.9 x 10⁶ (270) | 98.4 (30) | 525.2 (36) | 131.3 (9) | 189.7 (13) |
| PDA - high strain | 1.5 x 10⁶ (218) | 481.5 (33) | 189.7 (13) | |||
| PDA—early portion of high-strain records | 2.7 x 10⁶ (388) | 437.7 (30) | 189.7 (43) | |||
The results of this parametric study (figures 74, 75, and 76) illustrate (for the same transfer energy level) the effect of the elastic modulus on the number of blows per foot for the American Ecoboard, PPI, and SEAPILE piles. The GRLWEAP calculations show that the elastic modulus obtained from PDA testing—considering the proportionality condition for the initial portion of the high-strain records—yields the best agreement between (1) the calculated values of the transfer energy level and the energy measured by PDA and (2) the calculated blow count and the measured field records. Figure 74 shows that for the American Ecoboard pile, the effect of Young's modulus on the blow count was relatively small. This may be because Young's modulus values measured by PDA and PIT tests for the American Ecoboard pile were relatively small, compared to those obtained for the PPI and SEAPILE pile materials.

Figure 74. Graph. American Ecoboard pile—blows per foot versus elastic modulus.
Figure 75. Graph. PPI pile—blows per foot versus elastic modulus.
Figure 76. Graph. SEAPILE pile—blows per foot versus elastic modulus.
In general, materials exhibit stiffer behavior as the rate of loading increases. Thus, when comparing dynamic test results with those obtained from static laboratory or field load tests, the dynamic modulus are generally greater than the static elastic modulus.
In table 16, the dynamic elastic modulus, calculated from PDA testing—early portion of the high-strain records, are compared with static elastic modulus for steel and FRP piles, including the PPI and SEAPILE piles, obtained from laboratory compression tests. For steel, which is a rigid material compared to the FRP materials, the difference between static and dynamic modulus is 3 percent. The ratio of dynamic-to-static elastic modulus for FRP materials is 1.64 and 2.38 for the PPI plastic with steel bars and SEAPILE plastic with fiberglass bars, respectively.
| Pile Manufacturer | Static Elastic Modulus, kPa (ksi) | Dynamic Elastic Modulus, kPa (ksi) | Dynamic Elastic Modulus/Static Elastic Modulus |
|---|---|---|---|
| SEAPILE | 3.38 x 10⁶ (490) | 8.03 x 10⁶ (1165) | 2.38 |
| PPI | 7.22 x 10⁶ (1048) | 1.185 x 10⁷ (1719) | 1.64 |
| Steel | 1.999 x 10⁸ (29000) | 2.068 x 10⁸ (30000) | 1.03 |
One of the main objectives of the field demonstration project was to evaluate the dynamic method currently used for predicting the load-set response and ultimate static capacity of FRP piles. To simulate the field conditions as consistently as possible, the static load results were used to evaluate the maximum ratio of the toe bearing capacity to the shaft resistance as an input data for the CAPWAP analysis. The CAPWAP analysis results for the total static capacity, the shaft resistance, and the toe bearing capacity for all the test piles at the EOI and BOR are indicated in table 13.
The PDA and CAPWAP analysis results summarized in tables 12 and 13 show that all the piles experienced a long-term increase in pile capacity from the EOI to the BOR. The capacity gains ranged from 311.4 to 854.1 kN (70 to 192 kips) for the piles installed to 17.7-m (58-ft) penetrations. For most of the tested piles, the measured setup factor, defined as a ratio of the BOR to EOI capacities, is in excess of 2.0. For all the SLT piles, the CAPWAP capacities ranged from 938.6 to 1,267.7 kN (211 to 285 kips) during the BOR and from 186.8 to 556.0 kN (42 to 125 kips) at the EOI.
In general, the CAPWAP analysis showed that at the BOR for the piles driven to penetrations of 17.7 m (58 ft), most of the ultimate capacity was due to the shaft resistance, which ranged from 827.4 to 1,049.8 kN (184 to 236 kips). The toe resistance ranged from 97.9 to 164.6 kN (22 to 37 kips). For the American Ecoboard pile, which was driven to a penetration depth of 8.8 m (29 ft), the analysis yielded a shaft resistance of 102.3 kN (23 kips) and a toe resistance of 280.2 kN (63 kips). The Lancaster Composite, Inc., pile, which was driven to refusal at a depth of 26.5 m (87 ft), had a mobilized ultimate capacity of 2,090.7 kN (470 kips) at the end of redrive, with 1,387.8 kN (312 kips) in toe resistance.
Figures 78 through 81 illustrate the comparison between the load-set curves calculated by the CAPWAP program for the BOR and the SLT results for the Lancaster Composite, Inc., PPI, SEAPILE, and American Ecoboard piles. Table 17 summarizes the main experimental and dynamic analysis results, including the maximum applied or ultimate loads and the corresponding pile top settlements. These settlements are also compared with the elastic settlements of the piles due to their elastic compression, which are calculated assuming that the Lancaster Composite, Inc., PPI, and SEAPILE piles are frictional piles. For frictional piles, assuming a constant load transfer rate along the pile, the settlement due to the elastic compression, Selastic, can be approximately calculated by the equation in figure 77.
Figure 77. Equation. Selastic.
Where:
Pmax = Maximum applied or ultimate load.
E = Elastic modulus of the pile.
A = Pile section area.
L = Pile length.
The elastic modulus values indicated in table 17 were obtained from laboratory static compression tests conducted on FRP pile samples, taking into consideration the initial quasilinear portion of the stress-strain curves.
| Pile Manufacturer | CAPWAP | Static Load Test | EA, kN (kips) | Selastic, mm (inches) | ||
|---|---|---|---|---|---|---|
| Pmax, kN (kips) | Slimit, mm (inches) | Pmax, kN (kips) | Slimit, mm (inches) | |||
| Lancaster Composite (end of first loading cycle) | 1000 (224.8) | 5 (0.2) | 1000 (224.8) | 7.5 (0.3) | 4.1 x 10⁶ (0.9 x 10⁶) | 2.3 (0.1) |
| PPI | 980 (220.3) | 12 (0.5) | 1100 (247.3) | 9.6 (0.4) | 0.9 x 10⁶ (0.2 x 10⁶) | 11 (0.4) |
| SEAPILE | 900 (202.3) | 15 (0.6) | 800 (179.8) | 9.8 (0.4) | 0.745 x 10⁶ (1.67 x 10⁵) | 16.8 (0.7) |
| American Ecoboard | 382 (85.9) | 30 (1.2) | 600 (134.9) | 93.0 (3.6) | - | - |
| 400 (89.9) | 40 (1.6) | |||||
The comparison between the CAPWAP analysis and the SLT results for the FRP piles leads to the following observations.
For the Lancaster Composite, Inc., SLT pile, the CAPWAP analysis yields a load-set curve, which is quite consistent with the results of the first static load cycle. However, it leads to underestimating the total bearing capacity of the pile reached in the second load cycle. The difference between the CAPWAP analysis and the SLT results is likely due to the very high blow counts observed during the restrike (approximately 1 blow/mm (32 blows/inch)). With such low sets, the pile displacement under the dynamic load appears to be too small to fully mobilize the soil resistance and to obtain reliable measurements of the velocity and the force waves as input data for the CAPWAP analysis.
Figure 78. Graph. SLT and CAPWAP analysis—Lancaster Composite, Inc., pile.
Figure 79. Graph. SLT and CAPWAP analysis—PPI pile.
For the PPI SLT pile, the CAPWAP analysis yields an ultimate capacity that corresponds to about 90 percent of the plunging failure load observed during the SLT. The predicted limit settlement at failure is about 25 percent higher than the measured settlement, indicating that the CAPWAP analysis underestimates the stiffness of the pile response to static loading. The calculated elastic settlement due to pile compression is quite close to the limit settlement calculated by CAPWAP and slightly exceeds the experimental value. This seems to indicate that for the PPI pile, due to its low stiffness compared with the Lancaster Composite, Inc., pile, the settlement at failure is mainly the result of the elastic compression of the pile during loading.

Figure 80. Graph. SLT and CAPWAP analysis—SEAPILE pile.
For the SEAPILE SLT pile, the CAPWAP analysis yields an ultimate capacity that corresponds to about 112.5 percent of the plunging failure load observed during the SLT. Similar to the PPI pile, the predicted limit settlement at failure is higher (about 25 percent under the experimental ultimate load) than the experimental settlement, indicating that the CAPWAP analysis underestimates the stiffness of the pile response to static loading. Consistent with the results obtained for the PPI pile, the calculated elastic settlement due to pile compression is quite close to the limit settlement calculated by CAPWAP and exceeds the experimental value. This seems to confirm that for the SEAPILE and PPI tested piles, the settlement at failure is mainly the result of the elastic compression of the pile during loading.
Figure 81. Graph. SLT and CAPWAP analysis—American Ecoboard pile.
For the American Ecoboard SLT pile, the CAPWAP analysis showed a good correlation with the SLT up to 2 cm (0.8 inch) settlement at a load of 25 t (5.6 kips). CAPWAP analysis to predict the behavior of piles during SLTs is limited to settlements that do not exceed approximately 5 cm (2 inches). This might explain the difference between the SLT behavior and CAPWAP prediction curve for the low stiffness American Ecoboard pile, which reached a settlement of 96 mm (3.8 inches) under the static loading of 600 kN (134.9 kips). In addition, the American Ecoboard pile was driven to the sandy layer to assess its behavior primarily as an end bearing pile. The experimental results illustrated that no distinct plunging occurred under the applied static loading. As indicated in table 13, for this pile, the CAPWAP analysis predicted a ratio of end bearing to shaft resistance of 270 percent, which is substantially higher than that predicted for all the FRP piles driven to the clay layer at the depth of about 20 m (65.6 ft).
In situ evaluation of the integrity of FRP piles during driving requires: (1) reliable data monitoring for determining the compression and tension stresses in the pile, and (2) development of appropriate design criteria for the allowable dynamic stresses in the composite pile material and its basic components.
Figures 84 through 87 show typical pile stress versus penetration depth profiles obtained for the Lancaster Composite, Inc., PPI, SEAPILE, and American Ecoboard piles from the field PDA testing. The dynamic elastic modulus used for this analysis was determined from the proportional condition of the initial portion of the high-strain records. The results show that the calculated tensile stresses did not exceed 6,894.8 kPa (1 ksi); calculated compressive stresses at the pile top ranged from 4,136.9 to 15,857.9 kPa (0.6 to 2.3 ksi) during the driving of all FRP piles.
The design criteria for allowable compression and tension stresses in the FRP piles were primarily developed considering the equation of the axial force equilibrium for the composite material and assuming no delamination between its basic components (figure 82).
![]()
Figure 82. Equation. Applied axial force F.
Where:
F = The applied axial force.
At = Total pile cross section area.
Ar = Total cross section area of the reinforcement.
Ap = Total cross section area of the plastic or concrete materials.
st = Equivalent axial stress, tension or compression, acting on the pile section.
srallowable = Allowable axial stress, tension or compression, acting in the pile reinforcements.
spallowable = Allowable axial stress, tension or compression, acting in the plastic material or the concrete for the Lancaster Composite, Inc., pile.
The equation in figure 82 can be solved for the equivalent allowable axial stress in the composite pile section (figure 83).
Figure 83. Equation. Equivalent axial stress st.
Table 18 summarizes the main criteria used for establishing the allowable stresses for the FRP pile installation. It also shows, for each pile, the actual stresses measured by PDA during pile driving.
Figure 84. Graph. Stress versus penetration depth for Lancaster Composite, Inc., SLT pile.
Figure 85. Graph. Stress versus penetration depth for PPI SLT pile.
Figure 86. Graph. Stress versus penetration depth for SEAPILE SLT pile.
Figure 87. Graph. Stress versus penetration depth for American Ecoboard splice SLT pile.
| Type of Stress | Lancaster Composite | Lancaster Composite; Driven to the Bedrock Layer | Seaward International | PPI | American Ecoboard | Steel Pile |
|---|---|---|---|---|---|---|
| Compressive stress, kPa (ksi) | 85% of the concrete compressive strength | 85% of the concrete compressive strength | σmallowable=0
Ar/At=0.175
σr=1.81x10⁵(26) |
σmallowable=0
Ar/At 0.011
σr=2.89x10⁵(42) |
- | 90% of yield strength for steel piles |
| Tension stress | σmallowable=0
Ar/At=0.036
σr=3.47x10⁵
(50.3) |
σmallowable=0
Ar/At=0.036
σr=3.47x10⁵ (50.3) |
σmallowable=0
Ar/At=0.175
σr= NA |
σmallowable=0
Ar/At=0.011
σr = 2.89x10⁵
(42) |
- | 90% of yield strength for steel piles |
| Allowable compressive stress, kPa (ksi) | 37233 (5.4) | 37233 (5.4) | 31027.5 (4.5) | 3171.7 (0.46) | NA | - |
| Allowable tension stress, kPa (ksi) | 12617.9 (1.83) | 12617.9 (1.83) | NA | 3171.7 (0.46) | NA | - |
| Maximum measured compressive stress, kPa (ksi) | 15858.5 (2.3) | 19995.5 (2.9) | 8274 (1.2) | 7584.5 (1.1) | 4895.5 (0.71) | 183407 (26.6) |
| Maximum measured tension stress, kPa (ksi) | 7998.2 (1.16) | 5791.8 (0.84) | 2827 (0.41) | 2206.4 (0.32) | 689.5 (0.1) | 9790.9 (1.42) |
| Maximum measured compressive stress during restrike, kPa (ksi) | 14824.3 (2.15) | 16548 (2.4) | 8549.8 (1.24) | 8205.1 (1.19) | - | 238567 (34.6) |
| Maximum measured tension stress during restrike, kPa (ksi) | 1448 (0.21) | 4137 (0.60) | 3378.6 (0.49) | (0.18) | - | (9.2) |
During pile driving, the measured compression and tension stresses did not exceed the allowable stresses, except for PPI pile. During and after pile driving and restriking of PPI and SEAPILE piles, no damage or separation between the bars and the recycled plastic material was observed, except at the upper foot of each PPI pile. In the case of the Lancaster Composite, Inc., piles, no damage or separation between the concrete and the FRP shell piles was observed (figures 68 through 71). Following these site observations, in the absence of experimental data, the maximum stresses obtained for the FRP piles can be used to establish allowable tension and compression stresses for pile driving.

