U.S. Department of Transportation
Federal Highway Administration
1200 New Jersey Avenue, SE
Washington, DC 20590
202-366-4000
Federal Highway Administration Research and Technology
Coordinating, Developing, and Delivering Highway Transportation Innovations
 |
| This report is an archived publication and may contain dated technical, contact, and link information |
|
Publication Number: FHWA-RD-03-083 Date: June 2003 |
The majority of currently available abutment scour predictors, including some of the methodologies recommended by FHWA, relate abutment scour to a characteristic length (such as flow depth, Y, abutment protrusion length, a, etc.) and the approach flow Froude number. Some of these regression equations include sediment size and gradation as independent variables. However, since these relationships were developed from limited laboratory and field data, they cannot reflect effects due to sediment size properties; therefore they often result in unrealistic scour estimations. As shown in figures 26(a) and 26(b), they provide no guidance when applied to graded sediment mixtures such as those used in the present experimental study.
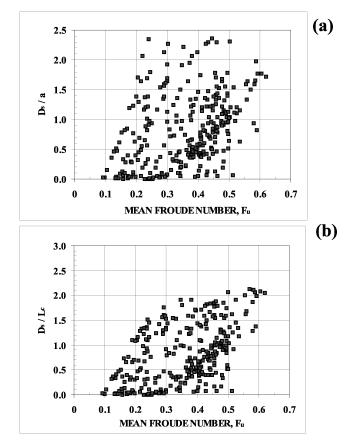
Figure 26. Variation of dimensionless abutment scour with Froude number: (a) abutment protrusion length, a, as characteristic length; (b) ![]() as characteristic length.
as characteristic length.
This chapter presents results of the experiments to analyze effects of gradation and coarse material fraction on abutment scour. As a result of this study, 384 new abutment scour data points covering a range of selected sediment mixtures have been contributed to the literature. Parameters controlling abutment scour in mixtures have been identified, and two new relationships for estimating abutment scour have been developed. The close agreement of these new relationships with laboratory experiments is encouraging.
This section presents details of the experimental setup, testing procedure, laboratory facilities, and measuring equipment that were utilized in the abutment scour experiments. First, the three laboratory test flumes used to study the effects of gradation on abutment scour are described. Next, individual measurements along with associated instrumentation and their accuracy are discussed. These measurements include initial and final bed topographies and slopes, hydraulic grade line, flow discharge, flow velocity, scour hole topography and its evolution with time, flow visualization, grain size distribution, and sampling of the armor layer. Finally, the experimental procedure followed for the various runs is discussed along with measures taken to ensure the accuracy and reliability of results.
Laboratory Flumes
Three laboratory flumes, designated as the hydrodynamics flume, sedimentation flume, and the river mechanics flume, were simultaneously utilized for conducting the abutment scour experiments in noncohesive sediment mixtures. The former two flumes are sediment recirculating facilities, while the latter does not recirculate sediment. All flumes are housed at the Hydraulics Laboratory of the Engineering Research Center at CSU. The water supply to these flumes is from the nearby Horsetooth Reservoir. The temperature of the water in the laboratory is controlled through a heating pipe system.
Hydrodynamics Flume
The hydrodynamics flume is a tilting, water and sediment recirculating laboratory facility. The flume is 0.6 m wide, 0.75 m deep, and 18 m long and is made of a steel bottom and Plexiglas side walls to facilitate visual observations. The facility is rigidly supported on U-shaped steel frames located every 1.2 m and is equipped with angled upper and lower flange stiffeners. The bottom flanges are supported on two I-beams spanning the full length of the flume and ground supported at the far upstream, middle, and far downstream. Two carefully leveled guide rails are mounted on the top flanges to provide an escorting track for the measuring carriage. The flume can be tilted around its middle lateral axis through the synchronized operation of two mechanical jacks located at the upstream and downstream ends. Flow is supplied to the flume from a ground sump via a 0.3-m diameter steel pipe line, equipped with a 0.15-m diameter bypass for fine tuning of the flow, and a 20-HP centrifugal pump. The flow is first introduced to an upstream head box equipped with a multilayer screen containing gravel at its outlet to serve as a flow guide to provide uniform velocities and turbulence characteristics at the entrance of the flume. A wave suppressor is then introduced to ensure the accomplishment of the previous concerns. The flow depth is controlled by a downstream rotating gate hinged across the bottom of the flume, spanning the full width, and operated by a system of pulleys. Due to the tail gate control and the nature of the flume, a back water effect is sometimes noticed, causing the water depth to increase as the gate is approached. A 23-cm thick uniform sediment layer prepared from the tested mixture is spread along the full length of the flume, with provisions made for a downstream 1.8-m long sediment trap and an upstream 1.8-m long transition zone. The upstream transition zone is composed of coarser sediments, with a sloping profile carefully designed to provide excess friction to ensure the existence of fully developed turbulent flow and with a boundary layer hitting the free surface far upstream of the study reaches for all flow conditions.
Sedimentation Flume
The sedimentation flume is an elevated sediment transport testing facility that provides for both longitudinal tilting and sediment recirculation. The flume is 60 m long, 2.4 m wide, and 1.2 m deep and allows for slope adjustments up to 3 percent through a system of hydraulic jacks. The flume is constructed from steel plates at the bottom and sides with provisions for Plexiglas windows along specific locations at its side. The structure's skeleton is composed of U-shaped lateral steel frames with cantilevers for sidewalks and supported on box-sectioned longitudinal girders. The upper flanges house guide rails for an electrically motorized measuring carriage that can virtually move to any point in the flume. Three different pumps (125, 150, and 250 HP), with a maximum combined capacity of 3 m3/s, can be simultaneously operated to supply water to the flume from a reservoir sump via three separate steel pipe lines. The flow is first introduced to the upstream head box, which contains several guide vanes and flow straighteners followed by a honeycomb mesh. The flow then passes through a gravel-filled screen succeeded by a wave suppressor. Rapid development of the fully turbulent boundary layer is achieved through an upstream concrete ramp and/or artificial roughening of the entrance zone. The flow depth is regulated through a manually operated downstream adjustable tail gate. The sediment bed is built to a thickness of about 0.4 m, with provisions made for a downstream sediment trap that extends for 6 m. To facilitate drainage of the flume after the experiments, a perforated 10-cm diameter PVC pipe was embedded in the bed material and spanned the full length of the study reach.
River Mechanics Flume
The river mechanics flume is a fixed-slope facility. The flume is 6 m wide, 0.9 m deep, and around 30 m long. The test section, however, was 24 m long, 5.1 m wide, and 0.9 m deep, providing for two Plexiglas viewing sections along one side of the flume and a large upstream reservoir to create uniform entrance conditions. I-beam rails are mounted on the side walls to provide a track for the huge measuring carriage. A 75-HP axial pump of maximum capacity around 0.6 m3/s supplies water to the flume through a 0.6-m diameter pipeline. The upstream main ends in a similar size diffuser located orthogonal to the main flow direction to distribute the flow uniformly across the flume width. The flow then passes through a gravel-filled screen followed by an artificially coarsened concrete ramp that joins the main sediment bed. The setup also provides for a downstream sediment trap and a downstream sill for depth regulation.
Measurements
A series of measurements are needed in order to define the relationship between local scour at abutments and the various hydraulic, geometric, and sediment parameters, both quantitatively and qualitatively. These measurements are described below.
Flow Discharge
The water discharge in all three test flumes was measured through a system of orifice-meter and a differential manometer. For the hydrodynamics flume, two orifice plates were available: one mounted on the 0.3-m diameter main and the other attached to the 0.15-m diameter bypass line. Both orifice-plates are connected to a dual water-mercury manometer for detecting the pressure drop across the ends of the plate. The flow discharge was then computed from the calibration curves for the orifices. The pressure tapping across the orifice plate is connected to the manometer through hard vinyl tubing provided with bleeding valves for drainage and for ensuring an air-free environment. The sedimentation flume is equipped with three similar setups for measuring the discharge, each attached to a different pump. Extreme care was taken to ensure the release of air bubbles entrapped in all manometer lines. The error in measuring the discharge in the hydrodynamics flume is around 3 percent, in the sedimentation flume around 4 percent, and in the river mechanics flume around 5 percent. These error estimates are due to the calibration errors of orifice plates, unsteadiness in the pump discharge, and fluctuations in manometer readings.
Flow Velocity
In the hydrodynamics flume, velocities were measured utilizing two different size pitot tubes and a two-dimensional magnetic flow meter depending on the desired accuracy. A 3-mm diameter minute pitot tube, tapered to a 1.5-mm diameter total head sensor that is connected to a membrane-type transducer, was first used to detect the flow velocity with an accuracy of ±1.5 percent. However, the problems encountered with air entrainment and blockage of the sensing and conveying tubing led to the replacement of this pitot tube with a larger one. The second pitot tube had a 3-mm diameter sensing stem with a pressure take-off diameter of 3 mm and a probe length of 0.3 m. The pressure transducer that was connected to the pitot tubes contained a 0.7 kilo pascal (kPa) steel membrane and is commercially available as P7D±5 PSID SER. 11534. The output signals from the transducer are amplified, filtered, and analyzed by a data acquisition board and a personal computer. The velocities sensed by this device are in the order of ±2.5 percent of accuracy. The second method for velocity measurements in the hydrodynamics flume utilized the 2-D electromagnetic Marsh McBirney, Model 523 flowmeter. The flowmeter consists of a spherical electromagnetic probe with cable and signal processor powered by 6-V DC externally charged with 110-V AC. The probe has a diameter of 12 mm and is mounted on a 6-mm diameter vertical standing rod. The analog signals corresponding to the two orthogonal velocities sensed by the probe are intercepted by a multichannel data acquisition board connected to a personal computer. The sampling frequency was 50 Hz. Overall accuracy of the latter setup is around 3.5 percent.
In the river mechanics and sedimentation flumes, velocities were measured with a one‑dimensional Marsh McBirney, Model 2000 electromagnetic flowmeter with a 2.54-cm elliptic probe and a digital display conversion voltmeter. The accuracy of the flowmeter is reported to be ±2 percent by the manufacturer, and its operating range is from -0.015 m/s to +6.1 m/s within temperature extremes of 0 oC to 71 oC. Overall accuracy of the velocity measuring setup is estimated to be 5 percent.
Flow Visualization
Examination of flow field in the vicinity of the abutment was achieved through flow visualization techniques, including:
Free Stream Bed and Scour Hole Topographies
The bed topographies for the scour holes and the free stream approaches are measured using point gauges. In all flumes, the standard topography measurement procedure started with the leveling of instrumentation carriages at each measurement location along and across the flume to account for the potential unevenness of tracks. Choosing an arbitrary fixed level, every location in the flume, as identified by its Cartesian coordinates, was assigned a correction factor reflecting its elevation relative to the fixed level.
In the hydrodynamics flume, three different point gauges were utilized for measuring purposes depending on the location and accuracy desired. The bed topographies at four different approach sections were measured for each abutment model to define the upstream bed elevation. At each cross section, the bed level was considered to be the average of 10 measurements evenly distributed across the flume's width. To define bed topography in the vicinity of local scour requires more intensive measurements. A measuring grid of an average of 17 cross sections, with a minimum of 21 points per section, was adopted to describe the scour hole region for each abutment.
A similar procedure was followed for the other two flumes, with provisions made for measuring the initial as well as the final levels. The raw measurements are adjusted with the leveling correction factors for each location and then regressed together to yield the value of the bed slope. Approximately 400 topography measurements were performed for each abutment model per experiment. Due to the large sampling size, the error in bed measurements is considered to be equal to 0.25 of the D90 grain size.
Hydraulic Grade Line
The water surface elevations were measured using point gauges with a resolution of ±0.3 mm. Water surface elevation measurements were conducted at a minimum of three approach cross sections per abutment and at a minimum of five locations across the flume width at each cross section. At every location in the cross section, the water level was considered to be the average of two minimum and maximum detected values, to account for any residual fluctuations in the supply discharge and any surface waves induced by the setup. This tedious procedure assumes an accuracy of 2 percent in the computed water depth. Again the hydraulic grade line is identified through regressing the measured water surface values after being adjusted with the level correction factors. The regression results in high correlation coefficients (R2 = 0.95). The velocity head was then added to the hydraulic grade line to define the total energy line.
Sampling of the Armor Layer
Surface samples representing the armor coat formed at the approach to the abutment and inside the scour hole were carefully collected after the experiments were over and the bed was dried. Various techniques, including molten paraffin wax, sticky polymers, modeling clay, scraping the surface, and pebble counting from still photographs, were tried. Among these, the modeling clay method proved to be the most practical and the most accurate.
Soft modeling clay, sometimes treated with castor oil to make it softer, was used to prepare a thin paste around 5 mm thick. The paste was placed at the desired sampling location and gently stamped down under a uniformly distributed applied pressure. The paste was then carefully lifted up, thus collecting a patch of adhered sediments representing the armor coat. After waiting for a short time to allow the paste to become drier, the collected sediments were removed by scraping the surface. If the clay is left on for a long time (one day or more) it becomes very stiff and the removal process has to be done under warm water. The following step was to wash the sediments to make sure that no residual clays are present, then oven dry them and finally prepare them for sieve analysis.
Grain Size Distribution
The relative size distributions for the various sediment mixtures and samples was determined using the sieve analysis method. The sieve sizes used were those defined by the U.S. Bureau of Standards, which represents the sieve number by the number of openings it has per square inch. An average shaking time of 10 minutes was applied for all tested samples.
Experimental Procedure
The experimental procedure for the abutment scour experiments is summarized as follows:
A comprehensive experimental program was designed to investigate the different aspects of gradation and coarse material fraction effects on local abutment scour. These experiments are categorized into 14 different sets of runs labeled set A through set N. The experimental program was carried out concurrently in three different laboratory facilities. Sets A, B, C, G, H, I, J, K, L, M, and N were performed in the hydrodynamics flume, while sets D and E were conducted in the sedimentation flume. The river mechanics flume was assigned to set F experiments. Sixteen different sediment mixtures and 10 different abutment models were subjected to a range of flow conditions, resulting in a total of 384 different abutment case studies. Tables 8 through 21 present these cases. A summary table of the sediment characteristics associated with the different mixtures utilized in the study is given in table 22.
In the abutment scour experiments presented in this section, the effects of the following parameters on local abutment scour were investigated:
 g (in sets A, B, and C, D-M1, E-M1, and E-M3).
 The following sections present details of each set of experiments and references to related summary tables whenever applicable.
Hydrodynamics Flume Experiments
The majority of the experiments (304 different abutment case studies) were carried out in the hydrodynamics flume. The details of each set of experiments are given below.
Set A Experiments
Set A consisted of 18 different runs (A-1 through A-18). Four abutment models were tested in each of the runs A-1, A-2, and A-3. All the four abutment models had the same length of 11.4 cm in the direction of flow; however, their protrusion lengths (length orthogonal to flow) varied. The abutment with a protrusion length of 2.54 cm was identified as M1, that with a protrusion length of 5.08 cm was identified as M2, that with a protrusion length of 7.62 cm was identified as M3, and that with a protrusion length of 10.16 cm was identified as M4. In runs A-4 through A-18, the 2.54-cm model (M1) was dismantled, since its small size could introduce undesirable scale effects with the selected sediment sizes and therefore could influence the validity of the results. The bed material tested (sediment Type IV) was coarse graded sand with a D50
of 1.8 mm and a g of 2.1, with an approximate log-normal size fraction distribution. The flow depth to abutment protrusion length (Y/a) varied between 0.5 and 2.0, the average velocity was between 18 cm/s and 40 cm/s, and the mean Froude number ranged from 0.2 to 0.5. Table 8 shows a summary of the experimental conditions for set A runs. It should be noted that flow depth (Y) and flow velocities were all measured at an approach section located at a distance of (10a) upstream from each abutment, where a is the abutment protrusion length.
Set B Experiments
Set B included 16 different runs (B-1 through B-16). Three abutment models (M2, M3, and M4) were tested in each of the runs except for runs B-12 and B-13 where only M2 and M4 were examined. Sediment of Type III, which is a coarse uniform sand with a D50 of 1.8 mm and a g of 1.17, was used throughout this set. The flow depth to abutment protrusion length (Y/a) varied between 0.3 and 2.3, the average velocity ranged between 0.21 m/s and 0.45 m/s, and the mean Froude number was between 0.25 and 0.6. Table 9 presents a summary of the experimental conditions for set B runs.
Set C Experiments
As shown in table 10, 21 case studies were included in set C (C-2 through C-8). Throughout this series and in the remaining sets that were conducted in the 0.61-m-wide flume, only abutment models M2, M3, and M4 were used. The bed material selected for this set was a coarse graded sand with a D50 of 1.8 mm, a g of 3.9, and an approximate log-normal size fraction distribution (Type V sediment). The flow depth to abutment protrusion length (Y/a) varied between 0.38 and 1.7, the average velocity (Vu) was between 0.21 m/s and 0.44 m/s, and the mean Froude number ranged from 0.3 to 0.5. A summary of the experimental conditions for set C runs is presented in table 10.
Set G Experiments
This set was designed to test a second uniform medium sand mixture with a D50 of 0.78 mm, and a g of 1.3 identified as Type II sediment. The set consisted of seven runs, which provided 21 data points as indicated in table 11. The experiments were conducted using a constant flow depth of 0.075 m for M2, 0.08 m for M3, and 0.09 m for M4. Mean velocity in set G experiments varied between 0.13 m/s and 0.3 m/s, and mean Froude number varied between 0.14 and 0.35.
Sets H, I, and J Experiments
Sets H, I, and J were all conducted with fine silica sand with a D50 of 0.1 mm and g
of 1.4 (Type I sediment). Set H consisted of 24 cases, all of which were run for a constant depth of 0.10 m. Set I included 18 study cases, all being tested at a constant depth of 0.075 m, and similarly, set J consisted of 18 tests conducted at a constant depth of 0.05 m. Tables 12 through 14 demonstrate the experimental conditions associated with each set. In each of these sets the most severe flow condition resulted in live bed scour, whereas the rest of the experiments were all conducted under clear-water conditions. For set H, velocities and Froude numbers ranged between 0.01 m/s and 0.33 m/s and between 0.09 and 0.3, respectively; for set I, velocities and Froude numbers ranged between 0.075 m/s and 0.40 m/s and between 0.13 and 0.46, respectively; and for set J velocities and Froude numbers ranged between 0.11 m/s and 0.31 m/s and between 0.15 and 0.44, respectively.
Set K Experiments
Table 15 lists test conditions for the seven runs in the set K experiments using Type VII sediment. The Type VII sediment resembles the Type I sediment in all of its features except that the coarsest 15 percent fraction matches that of sediment Type III. All experiments were conducted at an almost constant flow depth of 0.075 m, while the flow velocity varied from conditions which initiated local scour at the abutments to conditions that resulted in the initiation of live-bed scour (clear-water scour limit).
Set L Experiments
This set of experiments is similar to set B in which Type III sediment with a D50 of 1.8 mm and a g
of 1.17 was used. However, in this set the flow depth was maintained at a constant value of about 0.08 m. Flow conditions for the 24 cases considered in set L are given in table 16.
Set M Experiments
As shown in table 17, 10 different experiments were performed in set M using a constant depth of 0.075 m. The bed material tested was Type VI sediment, which basically had the same D50 and g
as uniform coarse sand of Type III (1.8 mm and 1.17, respectively), while having the D90 (i.e. the same coarsest fraction) of the graded sediment mixture of Type IV. Flow conditions in this set of experiments varied from conditions that initiated scour to conditions that initiated bed forms.
Set N Experiments
This set of experiments is similar to set A, which used Type IV graded coarse sand. However, in these experiments the flow depth was kept at a constant value of 0.075 m. Flow conditions pertaining to set N experiments (27 cases) are given in table 18.
Sedimentation Flume Experiments
Sixty-eight different abutment case studies were tested in the sedimentation flume; these studies constituted about 17 percent of the total number of abutment scour cases involved in this research. All the tests performed in the 2.44-m wide flume were conducted at a constant depth of 0.3 m. A total of eight different sediment mixtures were tested. Five different sand types, all having the same D50 of 0.78 mm but with varying gradation coefficients and ninety-percentile diameters, were selected to study sensitivity to various sediment size characteristics. The experiments are divided into two major sets: D and E.
Set D Experiments
Set D consisted of eight different runs. As shown in table 19, four abutment models were tested in each of these runs. All the abutment models were 0.46 m long (in direction of flow) and were identified as M1, M2, M3, and M4. Abutments M1, M2, and M3 had a protrusion length of 0.22 m, while the protrusion length of M4 was 0.18 m. Abutment models M1 and M4 were used for testing an approximate log-normally graded medium sand mixture of D50 equal to 0.78 mm and g equal to 2.43 (Type VIII sediment). Abutment M2 was designated for testing a mixture similar to that at M1, but with a coarser upper ten-percentile fraction (Type XI sediment). Similarly, a third mixture (Type X sediment), that was basically Type VIII sediment but with a coarser upper five-percentile fraction, was introduced at abutment M3.
Set E Experiments
Table 20 summarizes the 36 test conditions for the set E experiments. Four abutment models, which were also identified as M1, M2, M3, and M4, with protrusion lengths of 0.22 m and 0.45 m, were used in these experiments. In runs E-1 through E-8, abutment M1 was used for testing a graded medium sand mixture of D50 equal to 0.78 mm and g
equal to 3.4 (sediment Type IX). Abutment M2 was for testing a mixture similar to that at M1, but with a coarser upper ten-percentile fraction (sediment Type XII). A uniform medium sand with a D50 of 0.78 mm and g of 1.3 (Type II ) was utilized at M3. For comparison purposes, a mixture of sand and clay (70 percent sand and 30 percent clay) was introduced at M4. Runs E-9 and E-10 were conducted using a gravel mixture to examine potential variations due to median sediment size.
River Mechanics Flume Experiments
In the set F experiments, which were conducted in the 5.2-m wide river mechanics flume, a sediment mixture with mean diameter of 0.55 mm, a gradation coefficient of 2.1, and a D90 of 1.3 mm (sediment Type XV) was used. Table 21 summarizes the experimental conditions for this series. Set F experiments were conducted for the qualitative description of the scour hole and related geometric features.
Table 8. Experimental conditions for set A runs for abutment scour.
| RUNID | MODEL SIZE (cm x cm) |
FLOW DISCHARGE Q (l/s) |
APPROACH DEPTH Y (m) |
AVERAGE VELOCITY Vu (m/s) |
ABUTMENT VELOCITY Va (m/s) |
DIVERTED VELOCITY Vj (m/s) |
SCOUR DEPTH Ds (m) |
SEDIMENT TYPE |
|---|---|---|---|---|---|---|---|---|
| A1 - M1 | 2.5x11.4 | 12.621 | 0.061 | 0.34 | 0.33 | 0.31 | 0.016 | IV |
| A1 - M2 | 5.1x11.4 | 12.621 | 0.211 | 1.06 | 0.98 | 0.93 | 0.072 | IV |
| A1 - M3 | 7.6x11.4 | 12.621 | 0.220 | 1.01 | 0.85 | 0.83 | 0.089 | IV |
| A1 - M4 | 10.2x11.4 | 12.621 | 0.238 | 0.94 | 0.78 | 0.72 | 0.098 | IV |
| A2 - M1 | 2.5x11.4 | 16.170 | 0.068 | 0.39 | 0.38 | 0.36 | 0.023 | IV |
| A2 - M2 | 5.1x11.4 | 16.170 | 0.211 | 1.24 | 1.17 | 1.13 | 0.072 | IV |
| A2 - M3 | 7.6x11.4 | 16.170 | 0.220 | 1.17 | 0.99 | 0.96 | 0.089 | IV |
| A2 - M4 | 10.2x11.4 | 16.170 | 0.238 | 1.11 | 0.96 | 0.89 | 0.098 | IV |
| A3 - M1 | 2.5x11.4 | 18.502 | 0.087 | 0.35 | 0.33 | 0.32 | 0.025 | IV |
| A3 - M2 | 5.1x11.4 | 18.502 | 0.211 | 1.14 | 1.06 | 1.02 | 0.072 | IV |
| A3 - M3 | 7.6x11.4 | 18.502 | 0.220 | 1.04 | 0.88 | 0.85 | 0.089 | IV |
| A3 - M4 | 10.2x11.4 | 18.502 | 0.238 | 1.01 | 0.85 | 0.79 | 0.098 | IV |
| A4 - M2 | 5.1x11.4 | 19.502 | 0.075 | 0.42 | 0.40 | 0.40 | 0.073 | IV |
| A4 - M3 | 7.6x11.4 | 19.502 | 0.082 | 0.39 | 0.33 | 0.32 | 0.054 | IV |
| A4 - M4 | 10.2x11.4 | 19.502 | 0.084 | 0.38 | 0.34 | 0.32 | 0.083 | IV |
| A5 - M2 | 5.1x11.4 | 19.884 | 0.080 | 0.41 | 0.39 | 0.38 | 0.064 | IV |
| A5 - M3 | 7.6x11.4 | 19.884 | 0.087 | 0.38 | 0.32 | 0.31 | 0.054 | IV |
| A5 - M4 | 10.2x11.4 | 19.884 | 0.091 | 0.36 | 0.31 | 0.29 | 0.052 | IV |
| A6 - M2 | 5.1x11.4 | 15.874 | 0.066 | 0.40 | 0.38 | 0.36 | 0.048 | IV |
| A6 - M3 | 7.6x11.4 | 15.874 | 0.071 | 0.37 | 0.31 | 0.30 | 0.040 | IV |
| A6 - M4 | 10.2x11.4 | 15.874 | 0.075 | 0.35 | 0.30 | 0.28 | 0.042 | IV |
| A7 - M2 | 5.1x11.4 | 20.445 | 0.083 | 0.40 | 0.38 | 0.37 | 0.062 | IV |
| A7 - M3 | 7.6x11.4 | 20.445 | 0.088 | 0.38 | 0.32 | 0.32 | 0.053 | IV |
| A7 - M4 | 10.2x11.4 | 20.445 | 0.094 | 0.35 | 0.31 | 0.29 | 0.066 | IV |
| A8 - M2 | 5.1x11.4 | 17.306 | 0.071 | 0.40 | 0.38 | 0.37 | 0.059 | IV |
| A8 - M3 | 7.6x11.4 | 17.306 | 0.076 | 0.38 | 0.32 | 0.31 | 0.055 | IV |
| A8 - M4 | 10.2x11.4 | 17.306 | 0.080 | 0.36 | 0.31 | 0.29 | 0.060 | IV |
| A9 - M2 | 5.1x11.4 | 14.130 | 0.065 | 0.36 | 0.34 | 0.32 | 0.047 | IV |
| A9 - M3 | 7.6x11.4 | 14.130 | 0.069 | 0.33 | 0.28 | 0.27 | 0.043 | IV |
| A9 - M4 | 10.2x11.4 | 14.130 | 0.074 | 0.31 | 0.27 | 0.25 | 0.044 | IV |
| A10 - M2 | 5.1x11.4 | 10.227 | 0.049 | 0.34 | 0.32 | 0.31 | 0.026 | IV |
| A10 - M3 | 7.6x11.4 | 10.227 | 0.055 | 0.30 | 0.25 | 0.25 | 0.030 | IV |
| A10 - M4 | 10.2x11.4 | 10.227 | 0.062 | 0.27 | 0.22 | 0.20 | 0.029 | IV |
| A11a - M2 | 5.1x11.4 | 4.573 | 0.029 | 0.26 | 0.23 | 0.22 | 0.007 | IV |
| A11a - M3 | 7.6x11.4 | 4.573 | 0.030 | 0.25 | 0.21 | 0.20 | 0.010 | IV |
| A11a - M4 | 10.2x11.4 | 4.573 | 0.039 | 0.19 | 0.15 | 0.13 | 0.006 | IV |
| A11b - M2 | 5.1x11.4 | 7.232 | 0.039 | 0.30 | 0.28 | 0.26 | 0.015 | IV |
| A11b - M3 | 7.6x11.4 | 7.232 | 0.044 | 0.27 | 0.22 | 0.22 | 0.016 | IV |
| A11b - M4 | 10.2x11.4 | 7.232 | 0.050 | 0.24 | 0.19 | 0.17 | 0.010 | IV |
| A11c - M2 | 5.1x11.4 | 20.454 | 0.082 | 0.41 | 0.39 | 0.38 | 0.068 | IV |
| A11c - M3 | 7.6x11.4 | 20.454 | 0.086 | 0.39 | 0.33 | 0.32 | 0.062 | IV |
| A11c - M4 | 10.2x11.4 | 20.454 | 0.093 | 0.36 | 0.32 | 0.30 | 0.067 | IV |
| A15a - M2 | 5.1x11.4 | 13.790 | 0.102 | 0.22 | 0.20 | 0.18 | 0.010 | IV |
| A15a - M3 | 7.6x11.4 | 13.790 | 0.113 | 0.20 | 0.17 | 0.16 | 0.005 | IV |
| A15a - M4 | 10.2x11.4 | 13.790 | 0.121 | 0.19 | 0.14 | 0.13 | 0.005 | IV |
| A15b - M2 | 5.1x11.4 | 13.790 | 0.077 | 0.29 | 0.27 | 0.25 | 0.023 | IV |
| A15b - M3 | 7.6x11.4 | 13.790 | 0.087 | 0.26 | 0.22 | 0.21 | 0.008 | IV |
| A15b - M4 | 10.2x11.4 | 13.790 | 0.096 | 0.24 | 0.19 | 0.17 | 0.010 | IV |
| A16 - M2 | 5.1x11.4 | 13.529 | 0.057 | 0.39 | 0.37 | 0.36 | 0.049 | IV |
| A16 - M3 | 7.6x11.4 | 13.529 | 0.059 | 0.38 | 0.32 | 0.31 | 0.061 | IV |
| A16 - M4 | 10.2x11.4 | 13.529 | 0.062 | 0.36 | 0.32 | 0.30 | 0.080 | IV |
| A18a - M2 | 5.1x11.4 | 15.263 | 0.065 | 0.39 | 0.36 | 0.35 | 0.057 | IV |
| A18a - M3 | 7.6x11.4 | 15.263 | 0.067 | 0.37 | 0.31 | 0.31 | 0.047 | IV |
| A18a - M4 | 10.2x11.4 | 15.263 | 0.073 | 0.34 | 0.30 | 0.28 | 0.075 | IV |
| A18b - M2 | 5.1x11.4 | 15.574 | 0.068 | 0.37 | 0.35 | 0.34 | 0.043 | IV |
| A18b - M3 | 7.6x11.4 | 15.574 | 0.073 | 0.35 | 0.30 | 0.29 | 0.043 | IV |
| A18b - M4 | 10.2x11.4 | 15.574 | 0.080 | 0.32 | 0.27 | 0.26 | 0.049 | IV |
Notes:
Table 9. Experimental conditions for set B runs for abutment scour.
| RUN ID |
MODEL SIZE (cm x cm) |
FLOW DISCHARGE Q (l/s) |
APPROACH DEPTH Y (m) |
AVERAGE VELOCITY Vu (m/s) |
ABUTMENT VELOCITY Va (m/s) |
DIVERTED VELOCITY Vj (m/s) |
SCOUR DEPTH Ds (m) |
SEDIMENT TYPE |
|---|---|---|---|---|---|---|---|---|
| B1 - M2 | 5.1x11.4 | 14.130 | 0.064 | 0.365 | 0.341 | 0.329 | 0.1173 | III |
| B1 - M3 | 7.6x11.4 | 14.130 | 0.064 | 0.362 | 0.296 | 0.293 | 0.1295 | III |
| B1 - M4 | 10.2x11.4 | 14.130 | 0.066 | 0.349 | 0.304 | 0.285 | 0.1494 | III |
| B2 - M2 | 5.1x11.4 | 11.118 | 0.048 | 0.384 | 0.361 | 0.349 | 0.0832 | III |
| B2 - M3 | 7.6x11.4 | 11.118 | 0.046 | 0.395 | 0.322 | 0.321 | 0.1256 | III |
| B2 - M4 | 10.2x11.4 | 11.118 | 0.052 | 0.348 | 0.303 | 0.284 | 0.1347 | III |
| B3 - M2 | 5.1x11.4 | 8.011 | 0.037 | 0.352 | 0.328 | 0.315 | 0.0811 | III |
| B3 - M3 | 7.6x11.4 | 8.011 | 0.038 | 0.348 | 0.283 | 0.281 | 0.1140 | III |
| B3 - M4 | 10.2x11.4 | 8.011 | 0.040 | 0.329 | 0.283 | 0.264 | 0.1222 | III |
| B4 - M2 | 5.1x11.4 | 4.876 | 0.027 | 0.298 | 0.274 | 0.258 | 0.0472 | III |
| B4 - M3 | 7.6x11.4 | 4.876 | 0.026 | 0.303 | 0.247 | 0.243 | 0.0622 | III |
| B4 - M4 | 10.2x11.4 | 4.876 | 0.028 | 0.282 | 0.234 | 0.215 | 0.0634 | III |
| B5 - M2 | 5.1x11.4 | 6.895 | 0.035 | 0.326 | 0.301 | 0.287 | 0.0680 | III |
| B5 - M3 | 7.6x11.4 | 6.895 | 0.039 | 0.292 | 0.238 | 0.234 | 0.0716 | III |
| B5 - M4 | 10.2x11.4 | 6.895 | 0.045 | 0.252 | 0.204 | 0.187 | 0.0457 | III |
| B6 - M2 | 5.1x11.4 | 8.011 | 0.036 | 0.369 | 0.345 | 0.333 | 0.0872 | III |
| B6 - M3 | 7.6x11.4 | 8.011 | 0.042 | 0.312 | 0.254 | 0.251 | 0.0719 | III |
| B6 - M4 | 10.2x11.4 | 8.011 | 0.048 | 0.272 | 0.223 | 0.205 | 0.0515 | III |
| B7 - M2 | 5.1x11.4 | 11.117 | 0.046 | 0.395 | 0.373 | 0.362 | 0.1000 | III |
| B7 - M3 | 7.6x11.4 | 11.117 | 0.048 | 0.382 | 0.311 | 0.310 | 0.1207 | III |
| B7 - M4 | 10.2x11.4 | 11.117 | 0.052 | 0.350 | 0.305 | 0.286 | 0.1122 | III |
| B8 - M2 | 5.1x11.4 | 9.121 | 0.040 | 0.372 | 0.349 | 0.336 | 0.0899 | III |
| B8 - M3 | 7.6x11.4 | 9.121 | 0.044 | 0.343 | 0.280 | 0.277 | 0.0838 | III |
| B8 - M4 | 10.2x11.4 | 9.121 | 0.052 | 0.290 | 0.242 | 0.224 | 0.0796 | III |
| B9 - M2 | 5.1x11.4 | 9.121 | 0.048 | 0.311 | 0.286 | 0.271 | 0.0393 | VI |
| B9 - M3 | 7.6x11.4 | 9.121 | 0.051 | 0.294 | 0.240 | 0.236 | 0.0402 | VI |
| B9 - M4 | 10.2x11.4 | 9.121 | 0.055 | 0.274 | 0.226 | 0.208 | 0.0244 | VI |
| B10 - M2 | 5.1x11.4 | 11.118 | 0.048 | 0.378 | 0.355 | 0.342 | 0.0241 | VI |
| B10 - M3 | 7.6x11.4 | 11.118 | 0.050 | 0.366 | 0.298 | 0.296 | 0.0323 | VI |
| B10 - M4 | 10.2x11.4 | 11.118 | 0.052 | 0.352 | 0.308 | 0.288 | 0.0372 | VI |
| B12 - M2 | 5.1x11.4 | 8.011 | 0.036 | 0.362 | 0.338 | 0.325 | 0.0896 | III |
| B12 - M4 | 10.2x11.4 | 8.011 | 0.050 | 0.264 | 0.215 | 0.197 | 0.0664 | III |
| B13 - M2 | 5.1x11.4 | 33.980 | 0.120 | 0.463 | 0.445 | 0.440 | 0.1167 | III |
| B13 - M4 | 10.2x11.4 | 33.980 | 0.152 | 0.366 | 0.323 | 0.304 | 0.1149 | III |
| B14 - M2 | 5.1x11.4 | 9.504 | 0.042 | 0.368 | 0.345 | 0.332 | 0.078 | III |
| B14 - M3 | 7.6x11.4 | 9.504 | 0.052 | 0.297 | 0.242 | 0.238 | 0.068 | III |
| B14 - M4 | 10.2x11.4 | 9.504 | 0.058 | 0.269 | 0.221 | 0.203 | 0.076 | III |
| B15 - M2 | 5.1x11.4 | 7.862 | 0.048 | 0.271 | 0.247 | 0.231 | 0.027 | III |
| B15 - M3 | 7.6x11.4 | 7.862 | 0.055 | 0.235 | 0.192 | 0.187 | 0.023 | III |
| B15 - M4 | 10.2x11.4 | 7.862 | 0.062 | 0.206 | 0.160 | 0.145 | 0.020 | III |
| B16 - M2 | 5.1x11.4 | 11.742 | 0.054 | 0.359 | 0.335 | 0.322 | 0.091 | III |
| B16 - M3 | 7.6x11.4 | 11.742 | 0.056 | 0.345 | 0.282 | 0.279 | 0.117 | III |
| B16 - M4 | 10.2x11.4 | 11.742 | 0.063 | 0.304 | 0.256 | 0.237 | 0.126 | III |
Notes:
Table 10. Experimental conditions for set C runs for abutment scour.
| RUN ID | MODEL SIZE (cm x cm) |
FLOW DISCHARGE Q (l/s) |
APPROACH DEPTH Y (m) |
AVERAGE VELOCITY Vu (m/s) |
ABUTMENT VELOCITY Va (m/s) |
DIVERTED VELOCITY Vj (m/s) |
SCOUR DEPTH Ds (m) |
SEDIMENT TYPE |
|---|---|---|---|---|---|---|---|---|
| C2 - M2 | 5.1x11.4 | 7.553 | 0.039 | 0.318 | 0.293 | 0.278 | 0.003 | V |
| C2 - M3 | 7.6x11.4 | 7.553 | 0.042 | 0.297 | 0.242 | 0.238 | 0.004 | V |
| C2 - M4 | 10.2x11.4 | 7.553 | 0.046 | 0.270 | 0.221 | 0.204 | 0.005 | V |
| C3 - M2 | 5.1x11.4 | 17.306 | 0.071 | 0.402 | 0.380 | 0.370 | 0.024 | V |
| C3 - M3 | 7.6x11.4 | 17.306 | 0.075 | 0.381 | 0.311 | 0.309 | 0.038 | V |
| C3 - M4 | 10.2x11.4 | 17.306 | 0.078 | 0.362 | 0.319 | 0.299 | 0.038 | V |
| C4 - M2 | 5.1x11.4 | 4.876 | 0.033 | 0.243 | 0.220 | 0.204 | 0.003 | V |
| C4 - M3 | 7.6x11.4 | 4.876 | 0.035 | 0.228 | 0.186 | 0.181 | 0.003 | V |
| C4 - M4 | 10.2x11.4 | 4.876 | 0.038 | 0.210 | 0.164 | 0.148 | 0.005 | V |
| C5 - M2 | 5.1x11.4 | 20.454 | 0.084 | 0.401 | 0.379 | 0.369 | 0.026 | V |
| C5 - M3 | 7.6x11.4 | 20.454 | 0.086 | 0.392 | 0.321 | 0.319 | 0.033 | V |
| C5 - M4 | 10.2x11.4 | 20.454 | 0.090 | 0.374 | 0.332 | 0.313 | 0.045 | V |
| C6 - M2 | 5.1x11.4 | 14.298 | 0.062 | 0.375 | 0.352 | 0.340 | 0.010 | V |
| C6 - M3 | 7.6x11.4 | 14.298 | 0.070 | 0.335 | 0.273 | 0.270 | 0.011 | V |
| C6 - M4 | 10.2x11.4 | 14.298 | 0.076 | 0.310 | 0.263 | 0.244 | 0.022 | V |
| C7 - M2 | 5.1x11.4 | 21.912 | 0.081 | 0.443 | 0.424 | 0.417 | 0.039 | V |
| C7 - M3 | 7.6x11.4 | 21.912 | 0.087 | 0.414 | 0.339 | 0.338 | 0.032 | V |
| C7 - M4 | 10.2x11.4 | 21.912 | 0.093 | 0.388 | 0.348 | 0.329 | 0.039 | V |
| C8 - M2 | 5.1x11.4 | 19.502 | 0.075 | 0.428 | 0.408 | 0.400 | 0.032 | V |
| C8 - M3 | 7.6x11.4 | 19.502 | 0.079 | 0.405 | 0.331 | 0.330 | 0.035 | V |
| C8 - M4 | 10.2x11.4 | 19.502 | 0.082 | 0.390 | 0.351 | 0.332 | 0.036 | V |
Notes:
Table 11. Experimental conditions for set G runs for abutment scour.
| RUN ID | MODEL SIZE (cm x cm) |
FLOW DISCHARGE Q (l/s) |
APPROACH DEPTH Y (m) |
AVERAGE VELOCITY Vu (m/s) |
ABUTMENT VELOCITY Va (m/s) |
DIVERTED VELOCITY Vj (m/s) |
SCOUR DEPTH Ds (m) |
SEDIMENT TYPE |
|---|---|---|---|---|---|---|---|---|
| G1 - M2 | 5.1x11.4 | 7.552 | 0.076 | 0.163 | 0.144 | 0.130 | 0.006 | II |
| G1 - M3 | 7.6x11.4 | 7.553 | 0.086 | 0.144 | 0.118 | 0.113 | 0.005 | II |
| G1 - M4 | 10.2x11.4 | 7.553 | 0.092 | 0.135 | 0.099 | 0.087 | 0.001 | II |
| G2 - M2 | 5.1x11.4 | 8.990 | 0.083 | 0.178 | 0.158 | 0.143 | 0.020 | II |
| G2 - M3 | 7.6x11.4 | 8.990 | 0.094 | 0.158 | 0.129 | 0.124 | 0.022 | II |
| G2 - M4 | 10.2x11.4 | 8.990 | 0.098 | 0.151 | 0.112 | 0.099 | 0.012 | II |
| G3 - M2 | 5.1x11.4 | 9.751 | 0.075 | 0.214 | 0.192 | 0.176 | 0.047 | II |
| G3 - M3 | 7.6x11.4 | 9.751 | 0.082 | 0.195 | 0.160 | 0.154 | 0.042 | II |
| G3 - M4 | 10.2x11.4 | 9.751 | 0.092 | 0.173 | 0.131 | 0.117 | 0.030 | II |
| G4 - M2 | 5.1x11.4 | 11.010 | 0.073 | 0.246 | 0.222 | 0.207 | 0.079 | II |
| G4 - M3 | 7.6x11.4 | 11.010 | 0.086 | 0.210 | 0.172 | 0.167 | 0.068 | II |
| G4 - M4 | 10.2x11.4 | 11.010 | 0.092 | 0.197 | 0.152 | 0.137 | 0.046 | II |
| G5 - M2 | 5.1x11.4 | 11.941 | 0.076 | 0.258 | 0.234 | 0.218 | 0.084 | II |
| G5 - M3 | 7.6x11.4 | 11.943 | 0.089 | 0.220 | 0.180 | 0.175 | 0.077 | II |
| G5 - M4 | 10.2x11.4 | 11.943 | 0.095 | 0.207 | 0.161 | 0.145 | 0.049 | II |
| G6 - M2 | 5.1x11.4 | 12.884 | 0.080 | 0.265 | 0.241 | 0.225 | 0.098 | II |
| G6 - M3 | 7.6x11.4 | 12.884 | 0.093 | 0.227 | 0.186 | 0.181 | 0.093 | II |
| G6 - M4 | 10.2x11.4 | 12.884 | 0.096 | 0.221 | 0.174 | 0.158 | 0.066 | II |
| G7 - M2 | 5.1x11.4 | 14.130 | 0.076 | 0.304 | 0.280 | 0.265 | 0.113 | II |
| G7 - M3 | 7.6x11.4 | 14.130 | 0.089 | 0.260 | 0.213 | 0.207 | 0.117 | II |
| G7 - M4 | 10.2x11.4 | 14.130 | 0.091 | 0.253 | 0.205 | 0.188 | 0.119 | II |
Notes:
Table 12. Experimental conditions for set H runs for abutment scour.
| RUN # | MODEL SIZE (cm x cm) |
FLOW DISCHARGE Q (l/s) |
APPROACH DEPTH Y (m) |
AVERAGE VELOCITY Vu (m/s) |
ABUTMENT VELOCITY Va (m/s) |
DIVERTED VELOCITY Vj (m/s) |
SCOUR DEPTH Ds (m) |
SEDIMENT TYPE |
|---|---|---|---|---|---|---|---|---|
| H1 - M2 | 5.1x11.4 | 8.155 | 0.119 | 0.112 | 0.098 | 0.087 | 0.008 | I |
| H1 - M3 | 7.6x11.4 | 8.155 | 0.123 | 0.108 | 0.089 | 0.085 | 0.002 | I |
| H1 - M4 | 10.2x11.4 | 8.155 | 0.129 | 0.104 | 0.074 | 0.064 | 0.003 | I |
| H2 - M2 | 5.1x11.4 | 10.228 | 0.116 | 0.144 | 0.127 | 0.114 | 0.026 | I |
| H2 - M3 | 7.6x11.4 | 10.228 | 0.121 | 0.139 | 0.114 | 0.109 | 0.035 | I |
| H2 - M4 | 10.2x11.4 | 10.228 | 0.125 | 0.134 | 0.098 | 0.086 | 0.036 | I |
| H3 - M2 | 5.1x11.4 | 11.941 | 0.119 | 0.164 | 0.145 | 0.131 | 0.040 | I |
| H3 - M3 | 7.6x11.4 | 11.941 | 0.123 | 0.159 | 0.130 | 0.125 | 0.047 | I |
| H3 - M4 | 10.2x11.4 | 11.941 | 0.128 | 0.153 | 0.114 | 0.101 | 0.048 | I |
| H4 - M2 | 5.1x11.4 | 14.464 | 0.122 | 0.195 | 0.173 | 0.158 | 0.060 | I |
| H4 - M3 | 7.6x11.4 | 14.464 | 0.126 | 0.188 | 0.155 | 0.149 | 0.064 | I |
| H4 - M4 | 10.2x11.4 | 14.464 | 0.129 | 0.184 | 0.140 | 0.125 | 0.084 | I |
| H5 - M2 | 5.1x11.4 | 16.605 | 0.122 | 0.224 | 0.201 | 0.186 | 0.087 | I |
| H5 - M3 | 7.6x11.4 | 16.605 | 0.124 | 0.220 | 0.181 | 0.175 | 0.105 | I |
| H5 - M4 | 10.2x11.4 | 16.605 | 0.128 | 0.213 | 0.167 | 0.151 | 0.125 | I |
| H6 - M2 | 5.1x11.4 | 17.913 | 0.122 | 0.241 | 0.218 | 0.202 | 0.105 | I |
| H6 - M3 | 7.6x11.4 | 17.913 | 0.124 | 0.237 | 0.195 | 0.189 | 0.125 | I |
| H6 - M4 | 10.2x11.4 | 17.913 | 0.127 | 0.232 | 0.184 | 0.167 | 0.132 | I |
| H7 - M2 | 5.1x11.4 | 19.502 | 0.122 | 0.262 | 0.238 | 0.222 | 0.119 | I |
| H7 - M3 | 7.6x11.4 | 19.502 | 0.123 | 0.259 | 0.213 | 0.208 | 0.129 | I |
| H7 - M4 | 10.2x11.4 | 19.502 | 0.126 | 0.254 | 0.205 | 0.188 | 0.139 | I |
| H8 - M2 | 5.1x11.4 | 25.683 | 0.125 | 0.336 | 0.312 | 0.298 | 0.115 | I |
| H8 - M3 | 7.6x11.4 | 25.683 | 0.126 | 0.333 | 0.274 | 0.270 | 0.129 | I |
| H8 - M4 | 10.2x11.4 | 25.683 | 0.129 | 0.326 | 0.279 | 0.260 | 0.140 | I |
Notes:
Table 13. Experimental conditions for set I runs for abutment scour.
| RUN ID | MODEL SIZE (cm x cm) |
FLOW DISCHARGE Q (l/s) |
APPROACH DEPTH Y (m) |
AVERAGE VELOCITY Vu (m/s) |
ABUTMENT VELOCITY Va (m/s) |
DIVERTED VELOCITY Vj (m/s) |
SCOUR DEPTH Ds (m) |
SEDIMENT TYPE |
|---|---|---|---|---|---|---|---|---|
| I1 - M2 | 5.1 x 11.4 | 6.881 | 0.071 | 0.158 | 0.140 | 0.126 | 0.0393 | I |
| I1 - M3 | 7.6 x 11.4 | 6.881 | 0.076 | 0.148 | 0.121 | 0.116 | 0.0299 | I |
| I1 - M4 | 10.2 x 11.4 | 6.881 | 0.080 | 0.140 | 0.103 | 0.091 | 0.0335 | I |
| I2 - M2 | 5.1 x 11.4 | 8.438 | 0.073 | 0.190 | 0.169 | 0.154 | 0.0594 | I |
| I2 - M3 | 7.6 x 11.4 | 8.438 | 0.076 | 0.182 | 0.149 | 0.143 | 0.0524 | I |
| I2 - M4 | 10.2 x 11.4 | 8.438 | 0.080 | 0.173 | 0.130 | 0.116 | 0.0640 | I |
| I3 - M2 | 5.1 x 11.4 | 9.990 | 0.077 | 0.213 | 0.190 | 0.175 | 0.0914 | I |
| I3 - M3 | 7.6 x 11.4 | 9.990 | 0.079 | 0.208 | 0.170 | 0.165 | 0.1052 | I |
| I3 - M4 | 10.2 x 11.4 | 9.990 | 0.080 | 0.204 | 0.158 | 0.143 | 0.1219 | I |
| I4 - M2 | 5.1 x 11.4 | 11.330 | 0.075 | 0.249 | 0.225 | 0.209 | 0.1082 | I |
| I4 - M3 | 7.6 x 11.4 | 11.330 | 0.075 | 0.249 | 0.203 | 0.198 | 0.1210 | I |
| I4 - M4 | 10.2 x 11.4 | 11.330 | 0.075 | 0.247 | 0.199 | 0.181 | 0.1362 | I |
| I5 - M2 | 5.1 x 11.4 | 18.501 | 0.076 | 0.398 | 0.376 | 0.365 | 0.1167 | I |
| I5 - M3 | 7.6 x 11.4 | 18.501 | 0.077 | 0.395 | 0.323 | 0.322 | 0.1356 | I |
| I5 - M4 | 10.2 x 11.4 | 18.501 | 0.077 | 0.392 | 0.353 | 0.334 | 0.1402 | I |
| I6 - M2 | 5.1 x 11.4 | 5.768 | 0.075 | 0.127 | 0.111 | 0.099 | 0.0046 | I |
| I6 - M3 | 7.6 x 11.4 | 5.768 | 0.079 | 0.119 | 0.098 | 0.093 | 0.0027 | I |
| I6 - M4 | 10.2 x 11.4 | 5.768 | 0.081 | 0.117 | 0.084 | 0.074 | 0.0009 | I |
Notes:
Table 14. Experimental conditions for set J runs for abutment scour.
| RUN ID | MODEL SIZE (cm x cm) |
FLOW DISCHARGE Q (l/s) |
APPROACH DEPTH Y (m) |
AVERAGE VELOCITY Vu (m/s) |
ABUTMENT VELOCITY Va (m/s) |
DIVERTED VELOCITY Vj (m/s) |
SCOUR DEPTH Ds (m) |
SEDIMENT TYPE |
|---|---|---|---|---|---|---|---|---|
| J1 - M2 | 5.1 x 11.4 | 3.786 | 0.045 | 0.137 | 0.120 | 0.107 | 0.0162 | I |
| J1 - M3 | 7.6 x 11.4 | 3.786 | 0.048 | 0.128 | 0.104 | 0.100 | 0.0216 | I |
| J1 - M4 | 10.2 x 11.4 | 3.786 | 0.053 | 0.118 | 0.085 | 0.074 | 0.0104 | I |
| J2 - M2 | 5.1 x 11.4 | 5.295 | 0.054 | 0.160 | 0.141 | 0.128 | 0.0460 | I |
| J2 - M3 | 7.6 x 11.4 | 5.295 | 0.054 | 0.162 | 0.132 | 0.127 | 0.0747 | I |
| J2 - M4 | 10.2 x 11.4 | 5.295 | 0.055 | 0.158 | 0.118 | 0.105 | 0.0829 | I |
| J3 - M2 | 5.1 x 11.4 | 6.711 | 0.052 | 0.210 | 0.188 | 0.173 | 0.0823 | I |
| J3 - M3 | 7.6 x 11.4 | 6.711 | 0.050 | 0.222 | 0.181 | 0.176 | 0.0948 | I |
| J3 - M4 | 10.2 x 11.4 | 6.711 | 0.049 | 0.226 | 0.178 | 0.162 | 0.1076 | I |
| J4 - M2 | 5.1 x 11.4 | 7.561 | 0.051 | 0.245 | 0.222 | 0.206 | 0.0969 | I |
| J4 - M3 | 7.6 x 11.4 | 7.561 | 0.047 | 0.266 | 0.217 | 0.212 | 0.1024 | I |
| J4 - M4 | 10.2 x 11.4 | 7.561 | 0.045 | 0.275 | 0.226 | 0.208 | 0.1158 | I |
| J5 - M2 | 5.1 x 11.4 | 10.449 | 0.059 | 0.290 | 0.266 | 0.250 | 0.1052 | I |
| J5 - M3 | 7.6 x 11.4 | 10.449 | 0.055 | 0.311 | 0.253 | 0.250 | 0.1036 | I |
| J5 - M4 | 10.2 x 11.4 | 10.449 | 0.054 | 0.320 | 0.272 | 0.254 | 0.1234 | I |
| J6 - M2 | 5.1 x 11.4 | 3.455 | 0.045 | 0.126 | 0.110 | 0.098 | 0.0021 | I |
| J6 - M3 | 7.6 x 11.4 | 3.455 | 0.049 | 0.116 | 0.095 | 0.091 | 0.0009 | I |
| J6 - M4 | 10.2 x 11.4 | 3.455 | 0.049 | 0.116 | 0.083 | 0.073 | 0.0003 | I |
Notes:
Table 15. Experimental conditions for set K runs for abutment scour.
| RUN ID | MODEL SIZE (cm x cm) |
FLOW DISCHARGE Q (l/s) |
APPROACH DEPTH Y (m) |
AVERAGE VELOCITY Vu (m/s) |
ABUTMENT VELOCITY Va (m/s) |
DIVERTED VELOCITY Vj (m/s) |
SCOUR DEPTH Ds (m) |
SEDIMENT TYPE |
|---|---|---|---|---|---|---|---|---|
| K1 - M2 | 5.1 x 11.4 | 6.895 | 0.073 | 0.155 | 0.136 | 0.123 | 0.0021 | VII |
| K1 - M3 | 7.6 x 11.4 | 6.895 | 0.076 | 0.148 | 0.121 | 0.117 | 0.0009 | VII |
| K1 - M4 | 10.2 x 11.4 | 6.895 | 0.081 | 0.140 | 0.102 | 0.090 | 0.0006 | VII |
| K2 - M2 | 5.1 x 11.4 | 8.444 | 0.072 | 0.193 | 0.172 | 0.157 | 0.0128 | VII |
| K2 - M3 | 7.6 x 11.4 | 8.444 | 0.075 | 0.185 | 0.151 | 0.146 | 0.0043 | VII |
| K2 - M4 | 10.2 x 11.4 | 8.444 | 0.080 | 0.174 | 0.132 | 0.118 | 0.0034 | VII |
| K3 - M2 | 5.1 x 11.4 | 9.992 | 0.079 | 0.208 | 0.186 | 0.170 | 0.0287 | VII |
| K3 - M3 | 7.6 x 11.4 | 9.992 | 0.078 | 0.209 | 0.171 | 0.166 | 0.0250 | VII |
| K3 - M4 | 10.2 x 11.4 | 9.992 | 0.080 | 0.204 | 0.158 | 0.143 | 0.0277 | VII |
| K4 - M2 | 5.1 x 11.4 | 11.640 | 0.074 | 0.257 | 0.233 | 0.217 | 0.0491 | VII |
| K4 - M3 | 7.6 x 11.4 | 11.640 | 0.073 | 0.261 | 0.213 | 0.208 | 0.0631 | VII |
| K4 - M4 | 10.2 x 11.4 | 11.640 | 0.073 | 0.262 | 0.214 | 0.196 | 0.0728 | VII |
| K5 - M2 | 5.1 x 11.4 | 12.898 | 0.073 | 0.290 | 0.266 | 0.251 | 0.0762 | VII |
| K5 - M3 | 7.6 x 11.4 | 12.898 | 0.072 | 0.293 | 0.239 | 0.235 | 0.0741 | VII |
| K5 - M4 | 10.2 x 11.4 | 12.898 | 0.073 | 0.292 | 0.243 | 0.225 | 0.0860 | VII |
| K6 - M2 | 5.1 x 11.4 | 14.626 | 0.076 | 0.316 | 0.292 | 0.277 | 0.0835 | VII |
| K6 - M3 | 7.6 x 11.4 | 14.626 | 0.074 | 0.323 | 0.264 | 0.260 | 0.0933 | VII |
| K6 - M4 | 10.2 x 11.4 | 14.626 | 0.074 | 0.325 | 0.279 | 0.260 | 0.1149 | VII |
| K7 - M2 | 5.1 x 11.4 | 16.889 | 0.078 | 0.356 | 0.333 | 0.319 | 0.0884 | VII |
| K7 - M3 | 7.6 x 11.4 | 16.889 | 0.075 | 0.370 | 0.302 | 0.300 | 0.1012 | VII |
| K7 - M4 | 10.2 x 11.4 | 16.889 | 0.075 | 0.368 | 0.326 | 0.306 | 0.1244 | VII |
Notes:
Table 16. Experimental conditions for set L runs for abutment scour.
| RUN ID | MODEL SIZE (cm x cm) |
FLOW DISCHARGE Q (l/s) |
APPROACH DEPTH Y (m) |
AVERAGE VELOCITY Vu (m/s) |
ABUTMENT VELOCITY Va (m/s) |
DIVERTED VELOCITY Vj (m/s) |
SCOUR DEPTH Ds (m) |
SEDIMENT TYPE |
|---|---|---|---|---|---|---|---|---|
| L1 - M2 | 5.1 x 11.4 | 11.327 | 0.075 | 0.249 | 0.225 | 0.209 | 0.0290 | III |
| L1 - M3 | 7.6 x 11.4 | 11.327 | 0.077 | 0.241 | 0.197 | 0.192 | 0.0283 | III |
| L1 - M4 | 10.2 x 11.4 | 11.327 | 0.080 | 0.234 | 0.186 | 0.169 | 0.0302 | III |
| L2 - M2 | 5.1 x 11.4 | 15.106 | 0.077 | 0.323 | 0.298 | 0.284 | 0.0991 | III |
| L2 - M3 | 7.6 x 11.4 | 15.106 | 0.076 | 0.325 | 0.266 | 0.262 | 0.1015 | III |
| L2 - M4 | 10.2 x 11.4 | 15.106 | 0.077 | 0.324 | 0.277 | 0.258 | 0.1082 | III |
| L3 - M2 | 5.1 x 11.4 | 16.888 | 0.079 | 0.350 | 0.326 | 0.312 | 0.1082 | III |
| L3 - M3 | 7.6 x 11.4 | 16.888 | 0.079 | 0.352 | 0.288 | 0.285 | 0.1109 | III |
| L3 - M4 | 10.2 x 11.4 | 16.888 | 0.077 | 0.359 | 0.316 | 0.297 | 0.1222 | III |
| L4 - M2 | 5.1 x 11.4 | 18.882 | 0.081 | 0.381 | 0.358 | 0.346 | 0.1155 | III |
| L4 - M3 | 7.6 x 11.4 | 18.883 | 0.077 | 0.400 | 0.327 | 0.326 | 0.1183 | III |
| L4 - M4 | 10.2 x 11.4 | 18.882 | 0.078 | 0.399 | 0.361 | 0.342 | 0.1433 | III |
| L5 - M2 | 5.1 x 11.4 | 20.453 | 0.084 | 0.402 | 0.380 | 0.369 | 0.1201 | III |
| L5 - M3 | 7.6 x 11.4 | 20.453 | 0.080 | 0.422 | 0.345 | 0.345 | 0.1253 | III |
| L5 - M4 | 10.2 x 11.4 | 20.453 | 0.078 | 0.432 | 0.400 | 0.382 | 0.1420 | III |
| L6 - M2 | 5.1 x 11.4 | 9.992 | 0.073 | 0.226 | 0.203 | 0.188 | 0.0027 | III |
| L6 - M3 | 7.6 x 11.4 | 9.992 | 0.075 | 0.219 | 0.179 | 0.174 | 0.0018 | III |
| L6 - M4 | 10.2 x 11.4 | 9.992 | 0.078 | 0.211 | 0.165 | 0.149 | 0.0015 | III |
| L7 - M2 | 5.1 x 11.4 | 9.251 | 0.073 | 0.207 | 0.186 | 0.170 | 0.0003 | III |
| L7 - M3 | 7.6 x 11.4 | 9.251 | 0.076 | 0.201 | 0.164 | 0.159 | 0.0003 | III |
| L7 - M4 | 10.2 x 11.4 | 9.251 | 0.078 | 0.194 | 0.149 | 0.134 | 0.0003 | III |
| L8 - M2 | 5.1 x 11.4 | 13.790 | 0.078 | 0.291 | 0.267 | 0.251 | 0.0692 | III |
| L8 - M3 | 7.6 x 11.4 | 13.790 | 0.078 | 0.289 | 0.236 | 0.232 | 0.0732 | III |
| L8 - M4 | 10.2 x 11.4 | 13.790 | 0.079 | 0.285 | 0.237 | 0.219 | 0.0741 | III |
Notes:
Table 17. Experimental conditions for set M runs for abutment scour.
| RUN ID |
MODEL
SIZE (cm x cm) |
FLOW DISCHARGE Q (l/s) |
APPROACH DEPTH Y (m) |
AVERAGE VELOCITY Vu (m/s) |
ABUTMENT VELOCITY Va (m/s) |
DIVERTED VELOCITY Vj (m/s) |
SCOUR DEPTH Ds (m) |
SEDIMENT TYPE |
|---|---|---|---|---|---|---|---|---|
| M1 - M2 | 5.1 x 11.4 | 13.441 | 0.075 | 0.293 | 0.269 | 0.253 | 0.0232 | VI |
| M1 - M3 | 7.6 x 11.4 | 13.441 | 0.077 | 0.287 | 0.235 | 0.230 | 0.0238 | VI |
| M1 - M4 | 10.2 x 11.4 | 13.441 | 0.079 | 0.279 | 0.231 | 0.213 | 0.0344 | VI |
| M2 - M2 | 5.1 x 11.4 | 14.627 | 0.075 | 0.320 | 0.296 | 0.281 | 0.0283 | VI |
| M2 - M3 | 7.6 x 11.4 | 14.627 | 0.075 | 0.320 | 0.262 | 0.258 | 0.0280 | VI |
| M2 - M4 | 10.2 x 11.4 | 14.627 | 0.076 | 0.317 | 0.270 | 0.251 | 0.0421 | VI |
| M3 - M2 | 5.1 x 11.4 | 15.571 | 0.075 | 0.341 | 0.317 | 0.303 | 0.0293 | VI |
| M3 - M3 | 7.6 x 11.4 | 15.571 | 0.076 | 0.338 | 0.276 | 0.273 | 0.0344 | VI |
| M3 - M4 | 10.2 x 11.4 | 15.571 | 0.077 | 0.333 | 0.286 | 0.267 | 0.0546 | VI |
| M4 - M2 | 5.1 x 11.4 | 17.169 | 0.076 | 0.373 | 0.349 | 0.337 | 0.0479 | VI |
| M4 - M3 | 7.6 x 11.4 | 17.169 | 0.075 | 0.377 | 0.308 | 0.306 | 0.0515 | VI |
| M4 - M4 | 10.2 x 11.4 | 17.169 | 0.076 | 0.371 | 0.329 | 0.310 | 0.0762 | VI |
| M5 - M2 | 5.1 x 11.4 | 17.714 | 0.077 | 0.378 | 0.355 | 0.343 | 0.0527 | VI |
| M5 - M3 | 7.6 x 11.4 | 17.714 | 0.076 | 0.384 | 0.314 | 0.312 | 0.0594 | VI |
| M5 - M4 | 10.2 x 11.4 | 17.714 | 0.076 | 0.384 | 0.344 | 0.325 | 0.0866 | VI |
| M6 - M2 | 5.1 x 11.4 | 18.372 | 0.077 | 0.389 | 0.367 | 0.355 | 0.0588 | VI |
| M6 - M3 | 7.6 x 11.4 | 18.372 | 0.076 | 0.396 | 0.323 | 0.322 | 0.0671 | VI |
| M6 - M4 | 10.2 x 11.4 | 18.372 | 0.076 | 0.399 | 0.361 | 0.342 | 0.0887 | VI |
| M7 - M2 | 5.1 x 11.4 | 19.502 | 0.079 | 0.407 | 0.385 | 0.375 | 0.0728 | VI |
| M7 - M3 | 7.6 x 11.4 | 19.502 | 0.077 | 0.413 | 0.338 | 0.337 | 0.0744 | VI |
| M7 - M4 | 10.2 x 11.4 | 19.502 | 0.077 | 0.415 | 0.380 | 0.361 | 0.1113 | VI |
| M8 - M2 | 5.1 x 11.4 | 20.685 | 0.079 | 0.430 | 0.410 | 0.401 | 0.0789 | VI |
| M8 - M3 | 7.6 x 11.4 | 20.685 | 0.077 | 0.438 | 0.358 | 0.359 | 0.0796 | VI |
| M8 - M4 | 10.2 x 11.4 | 20.685 | 0.074 | 0.456 | 0.431 | 0.412 | 0.1177 | VI |
| M9 - M2 | 5.1 x 11.4 | 22.128 | 0.084 | 0.433 | 0.413 | 0.405 | 0.0853 | VI |
| M9 - M3 | 7.6 x 11.4 | 22.128 | 0.082 | 0.444 | 0.364 | 0.364 | 0.0856 | VI |
| M9 - M4 | 10.2 x 11.4 | 22.128 | 0.081 | 0.449 | 0.422 | 0.404 | 0.1228 | VI |
| M10 - M2 | 5.1 x 11.4 | 11.327 | 0.076 | 0.245 | 0.221 | 0.206 | 0.0037 | VI |
| M10 - M3 | 7.6 x 11.4 | 11.327 | 0.077 | 0.242 | 0.198 | 0.193 | 0.0030 | VI |
| M10 - M4 | 10.2 x 11.4 | 11.327 | 0.079 | 0.235 | 0.188 | 0.171 | 0.0055 | VI |
Notes:
Table 18. Experimental conditions for set N runs for abutment scour.
| RUN ID |
MODEL SIZE (cm x cm) |
FLOW DISCHARGE Q (l/s) |
APPROACH DEPTH Y (m) |
AVERAGE VELOCITY Vu (m/s) |
ABUTMENT VELOCITY Va (m/s) |
DIVERTED VELOCITY Vj (m/s) |
SCOUR DEPTH Ds (m) |
SEDIMENT TYPE |
|---|---|---|---|---|---|---|---|---|
| N1 - M2 | 5.1 x 11.4 | 13.441 | 0.075 | 0.294 | 0.270 | 0.254 | 0.0098 | IV |
| N1 - M3 | 7.6 x 11.4 | 13.441 | 0.076 | 0.289 | 0.237 | 0.232 | 0.0079 | IV |
| N1 - M4 | 10.2 x 11.4 | 13.441 | 0.080 | 0.277 | 0.229 | 0.210 | 0.0158 | IV |
| N2 - M2 | 5.1 x 11.4 | 14.463 | 0.075 | 0.315 | 0.291 | 0.276 | 0.0207 | IV |
| N2 - M3 | 7.6 x 11.4 | 14.463 | 0.076 | 0.311 | 0.255 | 0.250 | 0.0174 | IV |
| N2 - M4 | 10.2 x 11.4 | 14.463 | 0.078 | 0.303 | 0.255 | 0.236 | 0.0213 | IV |
| N3 - M2 | 5.1 x 11.4 | 15.416 | 0.077 | 0.331 | 0.306 | 0.292 | 0.0235 | IV |
| N3 - M3 | 7.6 x 11.4 | 15.416 | 0.076 | 0.332 | 0.271 | 0.268 | 0.0283 | IV |
| N3 - M4 | 10.2 x 11.4 | 15.416 | 0.077 | 0.327 | 0.280 | 0.261 | 0.0360 | IV |
| N4 - M2 | 5.1 x 11.4 | 17.029 | 0.078 | 0.358 | 0.334 | 0.321 | 0.0338 | IV |
| N4 - M3 | 7.6 x 11.4 | 17.029 | 0.077 | 0.362 | 0.296 | 0.294 | 0.0347 | IV |
| N4 - M4 | 10.2 x 11.4 | 17.029 | 0.077 | 0.364 | 0.321 | 0.302 | 0.0610 | IV |
| N5 - M2 | 5.1 x 11.4 | 18.372 | 0.078 | 0.386 | 0.364 | 0.352 | 0.0488 | IV |
| N5 - M3 | 7.6 x 11.4 | 18.372 | 0.076 | 0.397 | 0.325 | 0.323 | 0.0619 | IV |
| N5 - M4 | 10.2 x 11.4 | 18.372 | 0.074 | 0.407 | 0.371 | 0.352 | 0.0914 | IV |
| N6 - M2 | 5.1 x 11.4 | 19.502 | 0.079 | 0.407 | 0.385 | 0.375 | 0.0527 | IV |
| N6 - M3 | 7.6 x 11.4 | 19.502 | 0.077 | 0.418 | 0.342 | 0.342 | 0.0689 | IV |
| N6 - M4 | 10.2 x 11.4 | 19.502 | 0.077 | 0.416 | 0.382 | 0.363 | 0.0963 | IV |
| N7 - M2 | 5.1 x 11.4 | 20.685 | 0.080 | 0.423 | 0.403 | 0.394 | 0.0619 | IV |
| N7 - M3 | 7.6 x 11.4 | 20.685 | 0.078 | 0.435 | 0.356 | 0.356 | 0.0728 | IV |
| N7 - M4 | 10.2 x 11.4 | 20.685 | 0.078 | 0.437 | 0.406 | 0.388 | 0.1045 | IV |
| N8 - M2 | 5.1 x 11.4 | 22.128 | 0.085 | 0.427 | 0.406 | 0.398 | 0.0689 | IV |
| N8 - M3 | 7.6 x 11.4 | 22.128 | 0.082 | 0.443 | 0.362 | 0.363 | 0.0789 | IV |
| N8 - M4 | 10.2 x 11.4 | 22.128 | 0.080 | 0.456 | 0.431 | 0.413 | 0.1128 | IV |
| N9 - M2 | 5.1 x 11.4 | 11.740 | 0.075 | 0.257 | 0.233 | 0.217 | 0.0040 | IV |
| N9 - M3 | 7.6 x 11.4 | 11.740 | 0.076 | 0.253 | 0.207 | 0.202 | 0.0027 | IV |
| N9 - M4 | 10.2 x 11.4 | 11.740 | 0.079 | 0.243 | 0.195 | 0.178 | 0.0021 | IV |
Notes:
Table 19. Experimental conditions for set D runs for abutment scour.
| RUN ID |
MODEL SIZE (cm x cm) |
FLOW DISCHARGE Q (l/s) |
APPROACH DEPTH Y (m) |
AVERAGE VELOCITY Vu (m/s) |
ABUTMENT VELOCITY Va (m/s) |
DIVERTED VELOCITY Vj (m/s) |
SCOUR DEPTH Ds (m) |
SEDIMENT TYPE |
|---|---|---|---|---|---|---|---|---|
| D1 - M1 | 21.6 x 45.7 | 184.060 | 0.323 | 0.233 | 0.236 | 0.235 | 0.0579 | VIII |
| D1 - M2 | 21.6 x 45.7 | 184.060 | 0.326 | 0.231 | 0.206 | 0.195 | 0.0320 | XI |
| D1 - M3 | 21.6 x 45.7 | 184.060 | 0.326 | 0.231 | 0.195 | 0.192 | 0.0323 | X |
| D1 - M4 | 17.8 x 45.7 | 184.060 | 0.326 | 0.231 | 0.175 | 0.161 | 0.0253 | VIII |
| D2 - M1 | 21.6 x 45.7 | 176.980 | 0.324 | 0.224 | 0.222 | 0.216 | 0.0472 | VIII |
| D2 - M2 | 21.6 x 45.7 | 176.980 | 0.326 | 0.223 | 0.191 | 0.189 | 0.0122 | XI |
| D2 - M3 | 21.6 x 45.7 | 176.980 | 0.326 | 0.223 | 0.186 | 0.180 | 0.0137 | X |
| D2 - M4 | 17.8 x 45.7 | 176.980 | 0.317 | 0.229 | 0.172 | 0.155 | 0.0198 | VIII |
| D3 - M1 | 21.6 x 45.7 | 198.218 | 0.308 | 0.264 | 0.247 | 0.244 | 0.0625 | VIII |
| D3 - M2 | 21.6 x 45.7 | 198.218 | 0.309 | 0.263 | 0.219 | 0.204 | 0.0140 | XI |
| D3 - M3 | 21.6 x 45.7 | 198.218 | 0.314 | 0.259 | 0.201 | 0.189 | 0.1234 | X |
| D3 - M4 | 17.8 x 45.7 | 198.218 | 0.316 | 0.257 | 0.183 | 0.172 | 0.0256 | VIII |
| D4 - M1 | 21.6 x 45.7 | 229.366 | 0.317 | 0.296 | 0.267 | 0.265 | 0.0686 | VIII |
| D4 - M2 | 21.6 x 45.7 | 229.366 | 0.321 | 0.293 | 0.234 | 0.219 | 0.0204 | XI |
| D4 - M3 | 21.6 x 45.7 | 229.366 | 0.323 | 0.291 | 0.219 | 0.213 | 0.0344 | X |
| D4 - M4 | 17.8 x 45.7 | 229.366 | 0.326 | 0.288 | 0.202 | 0.192 | 0.0445 | VIII |
| D5 - M1 | 21.6 x 45.7 | 257.117 | 0.324 | 0.325 | 0.300 | 0.299 | 0.1103 | VIII |
| D5 - M2 | 21.6 x 45.7 | 257.117 | 0.331 | 0.319 | 0.265 | 0.250 | 0.0299 | XI |
| D5 - M3 | 21.6 x 45.7 | 257.117 | 0.334 | 0.316 | 0.255 | 0.244 | 0.0485 | X |
| D5 - M4 | 17.8 x 45.7 | 257.117 | 0.325 | 0.325 | 0.249 | 0.216 | 0.0564 | VIII |
| D6 - M1 | 21.6 x 45.7 | 295.628 | 0.327 | 0.371 | 0.331 | 0.329 | 0.1692 | VIII |
| D6 - M2 | 21.6 x 45.7 | 295.628 | 0.331 | 0.367 | 0.299 | 0.277 | 0.0451 | XI |
| D6 - M3 | 21.6 x 45.7 | 295.628 | 0.329 | 0.369 | 0.289 | 0.274 | 0.0671 | X |
| D6 - M4 | 17.8 x 45.7 | 295.628 | 0.327 | 0.371 | 0.265 | 0.245 | 0.0817 | VIII |
| D7 - M1 | 21.6 x 45.7 | 242.392 | 0.327 | 0.304 | 0.272 | 0.271 | 0.0866 | VIII |
| D7 - M2 | 21.6 x 45.7 | 242.392 | 0.333 | 0.299 | 0.241 | 0.229 | 0.0320 | XI |
| D7 - M3 | 21.6 x 45.7 | 242.392 | 0.336 | 0.296 | 0.231 | 0.223 | 0.0421 | X |
| D7 - M4 | 17.8 x 45.7 | 242.392 | 0.336 | 0.296 | 0.219 | 0.202 | 0.0415 | VIII |
| D8 - M1 | 21.6 x 45.7 | 144.416 | 0.311 | 0.191 | 0.189 | 0.183 | 0.0204 | VIII |
| D8 - M2 | 21.6 x 45.7 | 144.416 | 0.311 | 0.190 | 0.165 | 0.152 | 0.0024 | XI |
| D8 - M3 | 21.6 x 45.7 | 144.416 | 0.312 | 0.190 | 0.158 | 0.149 | 0.0076 | X |
| D8 - M4 | 17.8 x 45.7 | 144.416 | 0.312 | 0.190 | 0.146 | 0.131 | 0.0058 | VIII |
Notes:
Table 20. Experimental conditions for set E runs for abutment scour.
| RUN ID | MODEL SIZE (cm x cm) |
FLOW DISCHARGE Q (l/s) |
APPROACH DEPTH Y (m) |
AVERAGE VELOCITY Vu (m) |
ABUTMENT VELOCITY Va (m) |
DIVERTED VELOCITY Vj (m/s) |
SCOUR DEPTH Ds (m) |
SEDIMENT TYPE |
|---|---|---|---|---|---|---|---|---|
| E1 - M1 | 21.6 x 45.7 | 147.25 | 0.279 | 0.216 | 0.206 | 0.204 | 0.0189 | IX |
| E1 - M2 | 21.6 x 45.7 | 147.25 | 0.284 | 0.213 | 0.182 | 0.173 | 0.0168 | XII |
| E1 - M3 | 21.6 x 45.7 | 147.25 | 0.292 | 0.207 | 0.166 | 0.155 | 0.0320 | II |
| E1 - M4 | 21.6 x 45.7 | 147.25 | 0.283 | 0.213 | 0.152 | 0.136 | 0.0213 | XIII |
| E2 - M1 | 21.6 x 45.7 | 172.73 | 0.305 | 0.232 | 0.236 | 0.234 | 0.0317 | IX |
| E2 - M2 | 21.6 x 45.7 | 172.73 | 0.297 | 0.238 | 0.202 | 0.188 | 0.0213 | XII |
| E2 - M3 | 21.6 x 45.7 | 172.73 | 0.293 | 0.242 | 0.183 | 0.178 | 0.0774 | II |
| E2 - M4 | 21.6 x 45.7 | 172.73 | 0.299 | 0.237 | 0.155 | 0.155 | 0.0579 | XIII |
| E3 - M1 | 21.6 x 45.7 | 202.47 | 0.293 | 0.283 | 0.268 | 0.265 | 0.0152 | IX |
| E3 - M2 | 21.6 x 45.7 | 202.47 | 0.299 | 0.278 | 0.230 | 0.223 | 0.0229 | XII |
| E3 - M3 | 21.6 x 45.7 | 202.47 | 0.305 | 0.272 | 0.212 | 0.204 | 0.0844 | II |
| E3 - M4 | 21.6 x 45.7 | 202.47 | 0.301 | 0.276 | 0.193 | 0.168 | 0.0457 | XIII |
| E4 - M1 | 21.6 x 45.7 | 232.20 | 0.294 | 0.324 | 0.300 | 0.297 | 0.0360 | IX |
| E4 - M2 | 21.6 x 45.7 | 232.20 | 0.300 | 0.317 | 0.260 | 0.248 | 0.0256 | XII |
| E4 - M3 | 21.6 x 45.7 | 232.20 | 0.305 | 0.312 | 0.243 | 0.233 | 0.0957 | II |
| E4 - M4 | 21.6 x 45.7 | 232.20 | 0.299 | 0.319 | 0.213 | 0.173 | 0.0579 | XIII |
| E5 - M1 | 21.6 x 45.7 | 263.35 | 0.299 | 0.362 | 0.332 | 0.329 | 0.0500 | IX |
| E5 - M2 | 21.6 x 45.7 | 263.35 | 0.303 | 0.357 | 0.298 | 0.286 | 0.0399 | XII |
| E5 - M3 | 21.6 x 45.7 | 263.35 | 0.313 | 0.345 | 0.272 | 0.267 | 0.1481 | II |
| E5 - M4 | 21.6 x 45.7 | 263.35 | 0.301 | 0.359 | 0.251 | 0.223 | 0.0671 | XIII |
| E6 - M1 | 21.6 x 45.7 | 311.49 | 0.293 | 0.437 | 0.416 | 0.417 | 0.1094 | IX |
| E6 - M2 | 21.6 x 45.7 | 311.49 | 0.298 | 0.429 | 0.356 | 0.337 | 0.0884 | XII |
| E6 - M3 | 21.6 x 45.7 | 311.49 | 0.307 | 0.417 | 0.320 | 0.292 | 0.2060 | II |
| E6 - M4 | 21.6 x 45.7 | 311.49 | 0.287 | 0.446 | 0.337 | 0.320 | 0.1301 | XIII |
| E7 - M1 | 21.6 x 45.7 | 368.12 | 0.306 | 0.493 | 0.477 | 0.475 | 0.1576 | IX |
| E7 - M2 | 21.6 x 45.7 | 368.12 | 0.310 | 0.488 | 0.412 | 0.395 | 0.1027 | XII |
| E7 - M3 | 21.6 x 45.7 | 368.12 | 0.315 | 0.479 | 0.383 | 0.360 | 0.2652 | II |
| E7 - M4 | 21.6 x 45.7 | 368.12 | 0.288 | 0.524 | 0.405 | 0.386 | 0.2103 | XIII |
| E8 - M1 | 21.6 x 45.7 | 450.24 | 0.307 | 0.601 | 0.593 | 0.583 | 0.3216 | IX |
| E8 - M2 | 21.6 x 45.7 | 450.24 | 0.308 | 0.600 | 0.511 | 0.501 | 0.2188 | XII |
| E8 - M3 | 21.6 x 45.7 | 450.24 | 0.297 | 0.621 | 0.506 | 0.486 | 0.0884 | XIV |
| E8 - M4 | 21.6 x 45.7 | 450.24 | 0.296 | 0.625 | 0.390 | 0.309 | 0.2149 | XIII |
| E9 - M3 | 21.6 x 45.7 | 478.55 | 0.299 | 0.657 | 0.649 | 0.612 | 0.1890 | XIV |
| E9 - M4 | 21.6 x 45.7 | 478.55 | 0.274 | 0.715 | 0.519 | 0.496 | 0.1728 | XVI |
| E10 - M3 | 21.6 x 45.7 | 518.20 | 0.283 | 0.750 | 0.713 | 0.685 | 0.3158 | XIV |
| E10 - M4 | 21.6 x 45.7 | 518.20 | 0.274 | 0.775 | 0.669 | 0.601 | 0.3136 | XVI |
Notes:
1. Average Velocity: Mean velocity prevailing at the approach cross section.
2. Abutment Velocity: Velocity measured along the longitudinal passing through the abutment nose at the approach section.
3. Diverted Velocity: Integrated mean velocity prevailing across the deflected flow portion.
4. All experiments are performed in a 2.44‑m wide flume measured at the approach section.
5. Bed slope is set to a value of 0.0007.
Table 21. Experimental conditions for set F runs for abutment scour.
| RUNID |
MODEL SIZE (cm x cm) |
FLOW DISCHARGE Q (l/s) |
APPROACH DEPTH Y (m) |
AVERAGE VELOCITY Vu (m/s) |
DIVERTED VELOCITY Vj (m/s) |
SEDIMENT TYPE |
|---|---|---|---|---|---|---|
| F1 - MA | 20.3 x 96.5 | 277.505 | 0.226 | 0.226 | 0.241 | XV |
| F1 - MB | 21.6 x 96.5 | 277.505 | 0.216 | 0.216 | 0.253 | XV |
| F1 - MC | 64.8 x 96.5 | 277.505 | 0.223 | 0.223 | 0.241 | XV |
| F1 - MD | 43.2 x 96.5 | 277.505 | 0.213 | 0.213 | 0.253 | XV |
| F2 - MA | 20.3 x 96.5 | 351.129 | 0.226 | 0.226 | 0.308 | XV |
| F2 - MB | 21.6 x 96.5 | 351.129 | 0.213 | 0.213 | 0.323 | XV |
| F2 - MC | 64.8 x 96.5 | 351.129 | 0.219 | 0.219 | 0.308 | XV |
| F2 - MD | 43.2 x 96.5 | 351.129 | 0.210 | 0.210 | 0.323 | XV |
| F3 - MA | 20.3 x 96.5 | 390.772 | 0.198 | 0.198 | 0.393 | XV |
| F3 - MB | 21.6 x 96.5 | 390.772 | 0.185 | 0.185 | 0.411 | XV |
| F3 - MC | 64.8 x 96.5 | 390.772 | 0.192 | 0.192 | 0.393 | XV |
| F4 - MD | 43.2 x 96.5 | 390.772 | 0.183 | 0.183 | 0.411 | XV |
Notes:
Table 22. Properties of sediment mixture types used in abutment scour experiments.
| SEDIMENT TYPE |
D16 (mm) |
D50 (mm) |
D84 (mm) |
D90 (mm) |
D95 (mm) |
D100 (mm) |
g |
|---|---|---|---|---|---|---|---|
| I | 0.07 | 0.10 | 0.14 | 0.15 | 0.17 | 0.25 | 1.40 |
| II | 0.59 | 0.78 | 1.00 | 1.10 | 1.15 | 1.19 | 1.30 |
| II | 1.60 | 1.80 | 2.20 | 2.30 | 2.35 | 2.38 | 1.17 |
| IV | 0.86 | 1.80 | 3.70 | 4.10 | 5.00 | 5.60 | 2.07 |
| V | 0.36 | 1.80 | 5.50 | 6.70 | 8.00 | 10.00 | 3.91 |
| VI | 1.60 | 1.80 | 2.20 | 3.90 | 4.80 | 5.60 | 1.17 |
| VII | 0.07 | 0.10 | 0.14 | 2.20 | 2.35 | 2.83 | 1.40 |
| VIII | 0.31 | 0.78 | 1.83 | 2.10 | 2.35 | 4.00 | 2.43 |
| IX | 0.23 | 0.78 | 2.65 | 3.20 | 4.20 | 9.00 | 3.40 |
| X | 0.31 | 0.78 | 1.83 | 2.10 | 2.35 | 10.00 | 2.43 |
| XI | 0.31 | 0.78 | 1.83 | 2.80 | 5.00 | 10.00 | 2.43 |
| XII | 0.23 | 0.78 | 2.65 | 4.76 | 6.40 | 9.00 | 3.40 |
| XIII | 0.02 | 0.65 | 0.95 | 1.05 | 1.10 | 1.20 | 6.60 |
| XIV | 2.00 | 3.10 | 4.20 | 4.50 | 5.00 | 7.00 | 1.45 |
| XV | 0.25 | 0.55 | 1.10 | 1.30 | 1.50 | 2.38 | 2.10 |
| XVI | 1.30 | 2.70 | 3.70 | 3.90 | 4.20 | 7.00 | 1.68 |
Notes:
D16, D50, D84, D90, D95, D100 = Sediment size for which 26, 50, 84, 90, 95, and 100 percent of sediment is finer by weight, respectively.
In the following analysis, the governing parameters that were found to be affecting abutment scour are presented first. Second, the results of scour experiments utilizing fine uniform sand with 0.1-mm median diameter are given. Third, adjustments to nonuniform mixtures are discussed as a function of gradation coefficients. Finally, the newly developed equation for nonuniform sediment mixtures is presented, including adjustments for coarse fractions.
In designing the experimental program given in section 3.3, series of geometry, flow, and sediment properties were considered for relating the local scour to physical parameters. Among the geometric properties, abutment protrusion length is the most commonly used scaling parameter. In a physical sense, the larger the vertically projected length of the protrusion into the flow, the larger the expected local scour. However, as commonly observed in the field, beyond a certain protrusion length, the stagnation zone that forms in front of the abutment alters the behavior. Along with the protrusion length, the second commonly used parameter in relating scour to a physical length dimension is the flow depth. For this purpose, various depth values at various locations along and across the channel have been proposed in the past. Since the present experiments were conducted in a rectangular channel with no overbank regions, and since the main focus of the study was quantifying effects of sediment properties, the effects of return flows could not be accounted. However, to account for the governing geometric length parameter, after examining various scaling parameters, the square root of the blocked flow area was adopted for the length scaling.
 |
(17) |
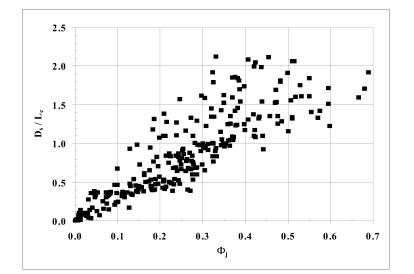
Figure 27. Variation of dimensionless abutment scour with deflected flow excess velocity.
where Yj is the average depth in the approach to the abutment. Flow parameters considered in the analysis included: average free stream velocity, Vu, abutment in-line velocity, Va, depth- and width-averaged deflected flow zone velocity, Vj, and the Froude number, momentum, and energy of the deflected flow . Among these flow variables, Va and Vj were found to be the most significant parameters. Since Vj reflects the approach region upstream from the abutment, and since it is related to the abutment nose velocities, it was chosen as the dominant velocity parameter. Using an approach similar to the approach for pier scour, a dimensionless velocity termed as deflected flow excess velocity was derived. This velocity is given by:
 |
(18)
|
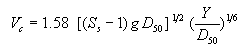
where Vc and Vi are the critical velocity at the approach mobilizing the bed, and scour initiating velocity at the abutment nose, respectively. These two quantities were measured in the experiments. However, they can be obtained through Neill's equation(19):
 |
(19)
|
and Vi . 0.4 Vc for abutment scour initiation. According to Abdou(7), in computing Vc for nonuniform mixtures using equation 19, the term D50 should be replaced by D90. Utilizing Ds / Lc and ![]() as the dependent and independent parameters, the data in figure 26 are replotted in figure 27. As can be seen, the improvement is remarkable.
as the dependent and independent parameters, the data in figure 26 are replotted in figure 27. As can be seen, the improvement is remarkable.
Scour in Uniform Mixtures
To eliminate the effects of coarse size fraction on the resulting abutment scour, a series of experiments was conducted using a uniform fine sand mixture with median diameter of 0.1 mm. The scour corresponding to these conditions represents an envelop condition where adjustments for size gradation and coarse fraction can be applied. Using Ds /Lc and Nj, and accommodating a residual correction factor due to (Y/a), the following relationship was derived (20):
|
|
(20)
|
where
|
|
(21)
|
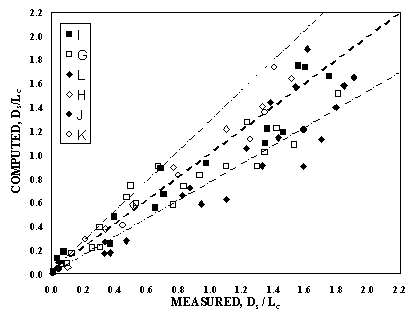
Figure 28(a) presents the measured and computed abutment scour for the uniform fine sand. The uniform scour relationship given above can be adjusted for gradation and coarse fraction effects by introducing additional parameters. For this purpose two different approaches are followed. The first approach makes gradation corrections to the predicted scour values, whereas the second approach introduces a coarse fraction correction. These approaches are given below.
The scour in mixtures with different gradations can be adjusted by introducing a gradation adjustment factor, Ks. This adjustment factor was determined from experimental data by obtaining ratios of scour in graded material and uniform mixtures. A series of curves was developed for 0.78-mm and 1.8-mm sand. These curves, which exhibited very similar features, were then combined into a single set of curves given in figure 28(a). As shown in this figure, Ks is not a constant but varies with flow intensity. Similar to the pier scour corrections, the scour reductions are negligible for low flows and for flows with high intensities. However, the adjustments are significant for a wide range of intermediate flows. The values obtained from figure 28(a) can be directly applied to uniform scour estimates from equation 20 to obtain gradation adjusted estimates for given deflected flow excess velocities.
Coarse Material Adjustments
Experimental results from the study have shown that abutment scour in nonuniform mixtures is greatly affected by the presence of coarse sizes. It was found that the sediment size corresponding to the coarsest 15 percent have a significant effect on the resulting scour. Using results of experiments, the following coarse fraction correction was developed.
|
|
(22)
|
where the adjustments and K2 (flow inclination factor in HEC-18(13)) are given by:
|
|
(23)
|
|
|
(24)
|
and Kn is abutment shape factor (given in HEC-18 as 1.0 for vertical wall abutments; 0.82 for wing-wall abutments; and 0.55 for spillthrough abutments). The factor K15 is to account for the composition of the coarsest 15th percentile and is obtained from figure 28(b) graphically. It is expressed by Abdeldayem(20) in terms of a sediment weighing factor Wg:
|
|
(25)
|
where
|
|
(26)
|
pj is the fraction falling into a size group j (percent finer by weight), and dj is the sediment size for which j percent of sediment in the mixture are finer. The term Wg is a term similar to the coarse fraction size Dcfm used earlier in chapter 2. It represents the size of the coarse fraction by the ratio of areas occupied by them rather than the mean size represented by Dcfm. Figure 29 shows the agreement of this equation with the experimental data.
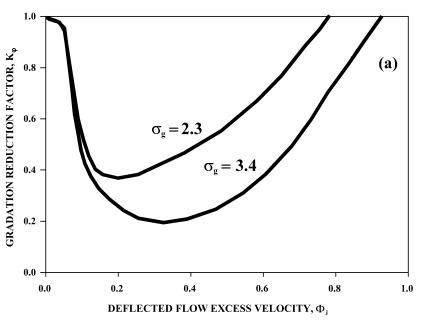
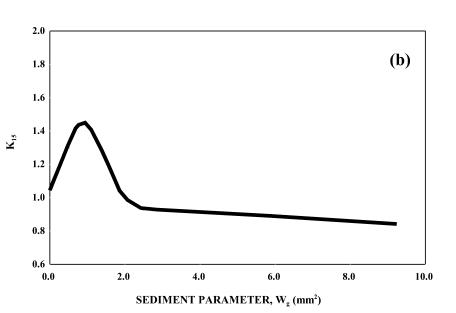
Figure 28. Adjustment factors for gradation and coarse material fraction: (a) gradation reduction factor; (b) coarse fraction adjustment, K15.
(a)
(b)
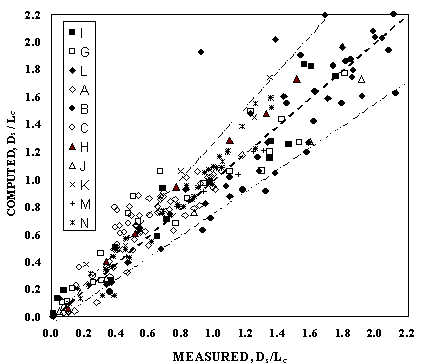
Figure 29. Measured and computed abutment scour for the hydrodynamics flume experiments: (a) for uniform mixtures; (b) all mixtures.
The following summarizes conclusions from this study:
|
|
(22)
|
|
|
(20)
|
The relationships derived in this study were aimed at quantifying the effects of sediment properties on abutment scour. Therefore, the experimental program was limited in its use of protrusion length-to-flow depth ratios (0.3 ![]() Y / a
Y / a ![]() 3.0). For conditions involving ratios beyond the study, these effects must be adequately represented.
3.0). For conditions involving ratios beyond the study, these effects must be adequately represented.

