U.S. Department of Transportation
Federal Highway Administration
1200 New Jersey Avenue, SE
Washington, DC 20590
202-366-4000


Skip to content
Facebook iconYouTube iconTwitter iconFlickr iconLinkedInInstagram

Federal Highway Administration Research and Technology
Coordinating, Developing, and Delivering Highway Transportation Innovations

Report
This report is an archived publication and may contain dated technical, contact, and link information
Publication Number: FHWA-HRT-07-036
Date: March 2007

Junction Loss Experiments: Laboratory Report

APPENDIX C. VELOCITY PROFILES USED IN THE ACCESS HOLE RUNS

The following images show the velocity profile in the outflow pipe from the access hole experiments. These were used to validate Ki. Blue indicates low velocity, while the spectrum toward red reflects increasing magnitudes of local velocity.
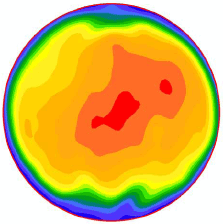
Figure 48. Image. Velocity profile 5 millimeters (0.19 inch) from the outlet for Q divided by A subscript o equals 43 centimeters per second (17 inches per second). This is one in a series of images in appendix C showing velocity profiles in the outlet pipe from access hole experiments. The images have a spectrum of colors with blue indicating the lowest velocity, red the highest, and cyan, green, yellow, and orange spanning the moderate velocities in between. This particular image is the first of four for the flow rate of 43 centimeters per second. This image shows a small red area of highest velocity at the pipe's center and another, smaller red area to the upper right. The two red areas are surrounded by a single red-orange area of next highest velocities.

Figure 48. Image. Velocity profile 5 mm (0.19 inch) from the outlet for Q/Ao = 43 cm/s (17 inches/s).
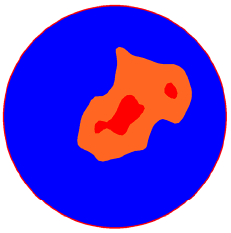
Figure 49. Image. Area where V is greater than 0.867 V subscript max 5 (0.19 inch) millimeters (0.19 inch) from the outlet for Q divided by A subscript o equals 43 centimeters per second (17 inches per second). This is one in a series of images in appendix C showing velocity profiles in the outlet pipe from access hole experiments. The images have a spectrum of colors with blue indicating the lowest velocity, red the highest, and cyan, green, yellow, and orange spanning the moderate velocities in between. This image shows a subset of the velocity profile from figure 48, limiting the display to velocities greater than 0.867 times the maximum velocity. The red areas of highest velocity and the red-orange area of next highest velocities are identical to those of figure 48.

Figure 49. Image. Area where V is greater than 0.867Vmax 5 mm (0.19 inch) from the outlet for Q/Ao = 43 cm/s (17 inches/s).
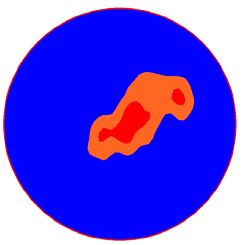
Figure 50. Image. Area where V is greater than 0.90 V subscript max 5 millimeters (0.19 inch) from the outlet for Q divided by A subscript o equals 43 centimeters per second (17 inches per second). This is one in a series of images in appendix C showing velocity profiles in the outlet pipe from access hole experiments. The images have a spectrum of colors with blue indicating the lowest velocity, red the highest, and cyan, green, yellow, and orange spanning the moderate velocities in between. This image shows a subset of the velocity profile from figure 48, limiting the display to velocities greater than 0.90 times the maximum velocity. The red areas of highest velocity are identical to those of figure 48, but the red-orange area of next highest velocities is smaller because a smaller range of velocities is displayed.

Figure 50. Image. Area where V is greater than 0.90Vmax 5 mm (0.19 inch) from the outlet for Q/Ao = 43 cm/s (17 inches/s).
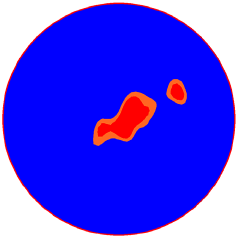
Figure 51. Image. Area where V is greater than 0.925 V  subscript max 5 millimeters (0.19 inch) from the outlet for Q divided by A subscript o equals 43 centimeters per second (17 inches per second). This is one in a series of images in appendix C showing velocity profiles in the outlet pipe from access hole experiments. The images have a spectrum of colors with blue indicating the lowest velocity, red the highest, and cyan, green, yellow, and orange spanning the moderate velocities in between. This image shows a subset of the velocity profile from figure 48, limiting the display to velocities greater than 0.925 times the maximum velocity. The red areas of highest velocity are identical to those of figure 48, but the red-orange area of next highest velocities has been reduced to two areas barely surrounding the two red areas.

Figure 51. Image. Area where V is greater than 0.925Vmax 5 mm (0.19 inch) from the outlet for Q/Ao = 43 cm/s (17 inches/s).
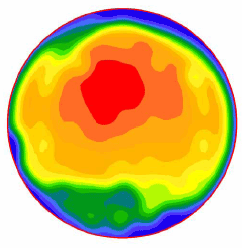
Figure 52. Image. Velocity profile at the outlet for Q divided by A subscript o equals 57 centimeters per second (22 inches per second). This is one in a series of images in appendix C showing velocity profiles in the outlet pipe from access hole experiments. The images have a spectrum of colors with blue indicating the lowest velocity, red the highest, and cyan, green, yellow, and orange spanning the moderate velocities in between. This particular image is the first of four for the flow rate of 57 centimeters per second.  The image shows a single moderate sized and circular shaped red area of highest velocity just above the pipe's center point.

Figure 52. Image. Velocity profile at the outlet for Q/Ao = 57 cm/s (22 inches/s).
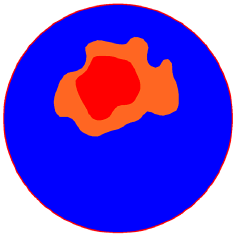
Figure 53. Image. Area where V is greater than 0.867 V subscript max at the outlet for Q divided by A subscript o equals 57 centimeters per second (22 inches per second). This is one in a series of images in appendix C showing velocity profiles in the outlet pipe from access hole experiments. The images have a spectrum of colors with blue indicating the lowest velocity, red the highest, and cyan, green, yellow, and orange spanning the moderate velocities in between. This image shows a subset of the velocity profile from figure 52, limiting the display to velocities greater than 0.867 times the maximum velocity. The red areas of highest velocity and the red-orange area of next highest velocities are identical to those of figure 52.

Figure 53. Image. Area where V is greater than 0.867Vmax at the outlet for Q/Ao = 57 cm/s (22 inches/s).
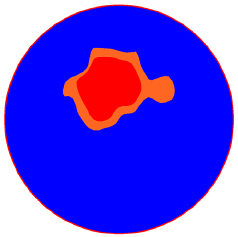
Figure 54. Image. Area where V is greater than 0.90 V subscript max at the outlet for Q divided by A subscript o equals 57 centimeters per second (22 inches per second). This is one in a series of images in appendix C showing velocity profiles in the outlet pipe from access hole experiments. The images have a spectrum of colors with blue indicating the lowest velocity, red the highest, and cyan, green, yellow, and orange spanning the moderate velocities in between. This image shows a subset of the velocity profile from figure 52, limiting the display to velocities greater than 0.90 times the maximum velocity. The red area of highest velocity is identical to that of figure 52, but the red-orange area of next highest velocities is smaller because a smaller range of velocities is displayed.

Figure 54. Image. Area where V is greater than 0.90Vmax at the outlet for Q/Ao = 57 cm/s (22 inches/s).
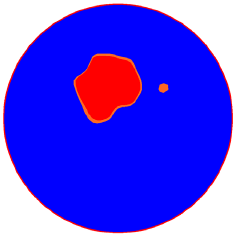
Figure 55. Image. Area where V is greater than 0.925 V subscript max at the outlet for Q divided by A subscript o equals 57 centimeters per second (22 inches per second). This is one in a series of images in appendix C showing velocity profiles in the outlet pipe from access hole experiments. The images have a spectrum of colors with blue indicating the lowest velocity, red the highest, and cyan, green, yellow, and orange spanning the moderate velocities in between. This image shows a subset of the velocity profile from figure 52, limiting the display to velocities greater than 0.925 times the maximum velocity. The red area of highest velocity is identical to that of figure 52, but the red-orange area of next highest velocities has been reduced to two areas, one barely surrounding the red area and the other off to the right.

Figure 55. Image. Area where V is greater than 0.925Vmax at the outlet for Q/Ao = 57 cm/s (22 inches/s).
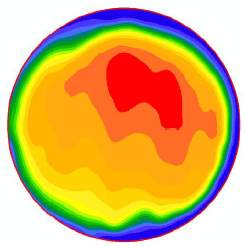
Figure 56. Image. Velocity profile at the outlet for Q divided by A subscript o equals 64 centimeters per second (25 inches per second). This is one in a series of images in appendix C showing velocity profiles in the outlet pipe from access hole experiments. The images have a spectrum of colors with blue indicating the lowest velocity, red the highest, and cyan, green, yellow, and orange spanning the moderate velocities in between. This particular image is the first of four for the flow rate of 64 centimeters per second.  The image shows a single moderately size red area of highest velocity to the upper right of the pipe's center point, roughly in the shape of two thumbprints next to each other.

Figure 56. Image. Velocity profile at the outlet for Q/Ao = 64 cm/s (25 inches/s).
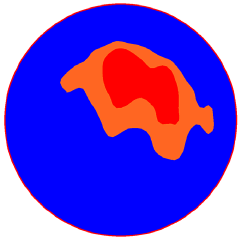
Figure 57. Image. Area where V is greater than 0.867 V subscript max at the outlet for Q divided by A subscript o equals 64 centimeters per second (25 inches per second). This is one in a series of images in appendix C showing velocity profiles in the outlet pipe from access hole experiments. The images have a spectrum of colors with blue indicating the lowest velocity, red the highest, and cyan, green, yellow, and orange spanning the moderate velocities in between. This image shows a subset of the velocity profile from figure 56, limiting the display to velocities greater than 0.867 times the maximum velocity. The red areas of highest velocity and the red-orange area of next highest velocities are identical to those of figure 56.

Figure 57. Image. Area where V is greater than 0.867Vmax at the outlet for Q/Ao = 64 cm/s (25 inches/s).
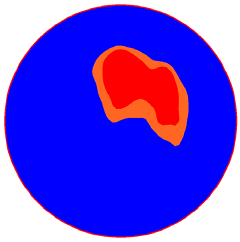
Figure 58. Image. Area where V is greater than 0.90 V subscript max at the outlet for Q divided by A subscript o equals 64 centimeters per second (25 inches per second). This is one in a series of images in appendix C showing velocity profiles in the outlet pipe from access hole experiments. The images have a spectrum of colors with blue indicating the lowest velocity, red the highest, and cyan, green, yellow, and orange spanning the moderate velocities in between. This image shows a subset of the velocity profile from figure 56, limiting the display to velocities greater than 0.90 times the maximum velocity. The red area of highest velocity is identical to that of figure 56, but the red-orange area of next highest velocities is smaller because a smaller range of velocities is displayed.

Figure 58. Image. Area where V is greater than 0.90Vmax at the outlet for Q/Ao = 64 cm/s (25 inches/s).
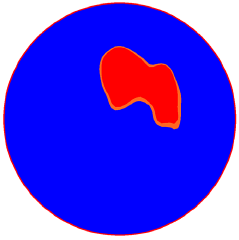
Figure 59. Image. Area where V is greater than 0.925 V subscript max at the outlet for Q divided by A subscript o equals 64 centimeters per second (25 inches per second). This is one in a series of images in appendix C showing velocity profiles in the outlet pipe from access hole experiments. The images have a spectrum of colors with blue indicating the lowest velocity, red the highest, and cyan, green, yellow, and orange spanning the moderate velocities in between. This image shows a subset of the velocity profile from figure 56, limiting the display to velocities greater than 0.925 times the maximum velocity. The red area of highest velocity is identical to that of figure 56, but the red-orange area of next highest velocities is smaller because a smaller range of velocities is displayed.

Figure 59. Image. Area where V is greater than 0.925Vmax at the outlet for Q/Ao = 64 cm/s (25 inches/s).
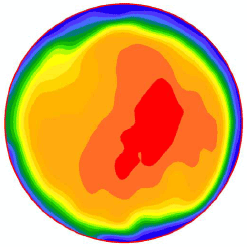
Figure 60. Image. Velocity profile at the outlet for Q divided by A subscript o equals 75 centimeters per second (30 inches per second). This is one in a series of images in appendix C showing velocity profiles in the outlet pipe from access hole experiments. The images have a spectrum of colors with blue indicating the lowest velocity, red the highest, and cyan, green, yellow, and orange spanning the moderate velocities in between. This particular image is the first of four for the flow rate of 75 centimeters per second.  The image shows a single oblong moderate size red area of highest velocity just below and to the right of the pipe's center point. A medium velocity area is roughly circular and occupies all but the very outside edge of the pipe.

Figure 60. Image. Velocity profile at the outlet for Q/Ao = 75 cm/s (30 inches/s).
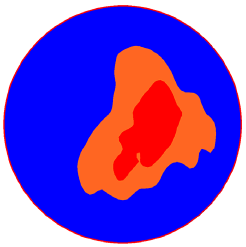
Figure 61. Image. Area where V is greater than 0.867 V subscript max at the outlet for Q divided by A subscript o equals 75 centimeters per second (30 inches per second). This is one in a series of images in appendix C showing velocity profiles in the outlet pipe from access hole experiments. The images have a spectrum of colors with blue indicating the lowest velocity, red the highest, and cyan, green, yellow, and orange spanning the moderate velocities in between. This image shows a subset of the velocity profile from figure 60, limiting the display to velocities greater than 0.867 times the maximum velocity. The red areas of highest velocity and the red-orange area of next highest velocities are identical to those of figure 60.

Figure 61. Image. Area where V is greater than 0.867Vmax at the outlet for Q/Ao = 75 cm/s (30 inches/s).
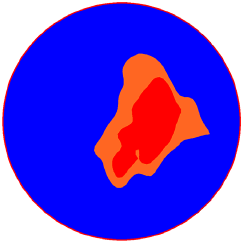
Figure 62. Image. Area where V is greater than 0.90 V subscript max at the outlet for Q divided by A subscript o equals 75 centimeters per second (30 inches per second). This is one in a series of images in appendix C showing velocity profiles in the outlet pipe from access hole experiments. The images have a spectrum of colors with blue indicating the lowest velocity, red the highest, and cyan, green, yellow, and orange spanning the moderate velocities in between. This image shows a subset of the velocity profile from figure 60, limiting the display to velocities greater than 0.90 times the maximum velocity. The red area of highest velocity is identical to that of figure 60, but the red-orange area of next highest velocities is smaller because a smaller range of velocities is displayed.

Figure 62. Image. Area where V is greater than 0.90Vmax at the outlet for Q/Ao = 75 cm/s (30 inches/s).
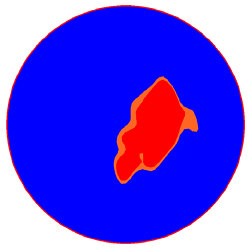
Figure 63. Image. Area where V is greater than 0.925 V subscript max at the outlet for Q divided by A subscript o equals 75 centimeters per second (30 inches per second). . This is one in a series of images in appendix C showing velocity profiles in the outlet pipe from access hole experiments. The images have a spectrum of colors with blue indicating the lowest velocity, red the highest, and cyan, green, yellow, and orange spanning the moderate velocities in between. This image shows a subset of the velocity profile from figure 60, limiting the display to velocities greater than 0.925 times the maximum velocity. The red area of highest velocity is identical to that of figure 60, but the red-orange area of next highest velocities is smaller because a smaller range of velocities is displayed.

Figure 63. Image. Area where V is greater than 0.925Vmax at the outlet for Q/Ao = 75 cm/s (30 inches/s).

Previous | Contents | Next

Federal Highway Administration | 1200 New Jersey Avenue, SE | Washington, DC 20590 | 202-366-4000
Turner-Fairbank Highway Research Center | 6300 Georgetown Pike | McLean, VA | 22101