Junction Loss Experiments: Laboratory Report
APPENDIX B. VELOCITY PROFILES USED IN THE MINICULVERT RUNS
The following images show the velocity profile in the outflow pipe from the miniculvert experiments. These were used to validate Ko. Blue indicates low velocity, while the spectrum toward red reflects increasing magnitudes of local velocity.
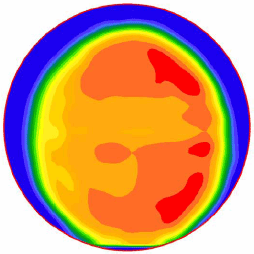
Figure 36. Image. Velocity profile at the outlet for Q/Ao = 42 cm/s (16 inches/s).
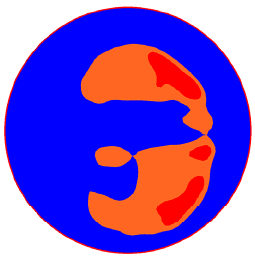
Figure 37. Image. Area where V is greater than 0.867Vmax at the outlet for Q/Ao = 42 cm/s (16 inches/s).
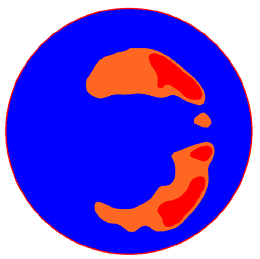
Figure 38. Image. Area where V is greater than 0.90Vmax at the outlet for Q/Ao = 42 cm/s (16 inches/s).
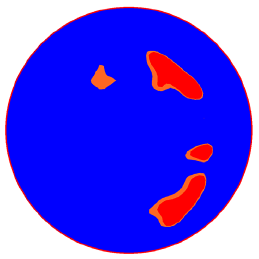
Figure 39. Image. Area where V is greater than 0.925Vmax at the outlet for (16 inches/s)Q/Ao = 42 cm/s (16 inches/s).
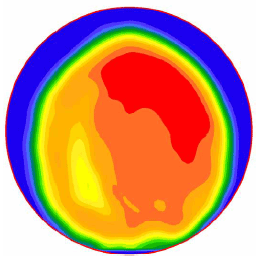
Figure 40. Image. Velocity profile 5mm (0.19 inch) from the outlet for Q/Ao = 57 cm/s (22 inches/s).

Figure 41. Image. Area where V is greater than 0.867Vmax 5mm (0.19 inch) from the outlet for Q/Ao = 57 cm/s (22 inches/s).
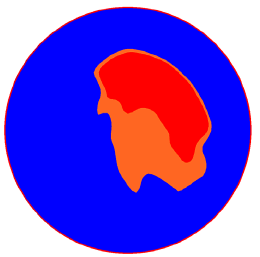
Figure 42. Image. Area where V is greater than 0.90Vmax 5mm (0.19 inch) from the outlet for Q/Ao = 57 cm/s (22 inches/s).
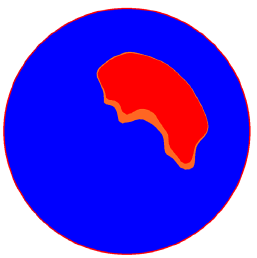
Figure 43. Image. Area where V is greater than 0.925Vmax 5mm (0.19 inch) from the outlet for Q/Ao = 57 cm/s (22 inches/s).
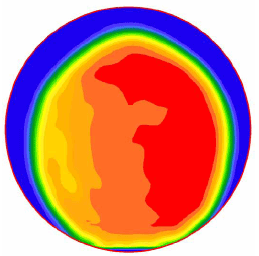
Figure 44. Image. Velocity profile at the outlet for Q/Ao = 69 cm/s (27 inches/s).
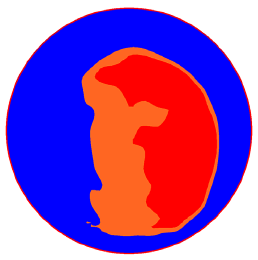
Figure 45. Image. Area where V is greater than 0.867Vmax at the outlet for Q/Ao = 69 cm/s (27 inches/s).
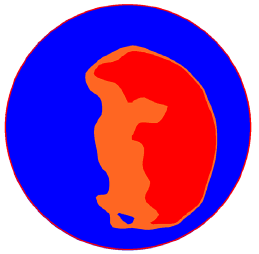
Figure 46. Image. Area where V is greater than 0.90Vmax at the outlet for Q/Ao = 69 cm/s (27 inches/s).
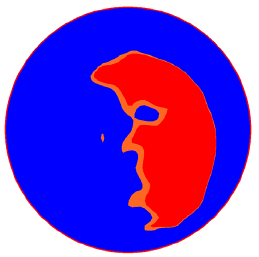
Figure 47. Image. Area where V is greater than 0.925Vmax at the outlet for Q/Ao = 69 cm/s (27 inches/s).
Previous | Contents | Next
| 