U.S. Department of Transportation
Federal Highway Administration
1200 New Jersey Avenue, SE
Washington, DC 20590
202-366-4000
Federal Highway Administration Research and Technology
Coordinating, Developing, and Delivering Highway Transportation Innovations
 |
| This report is an archived publication and may contain dated technical, contact, and link information |
|
Publication Number: FHWA-HRT-08-073 Date: September 2009 |
Chapter 4. MVEPCD Characterization and Verification in Tension4.1. IntroductionFatigue cracking of asphalt pavements, along with permanent deformation, is known to be a major form of pavement distress in the United States. Such cracking occurs due to extensive cyclic applications of loads and/or variations in temperature. The typical understanding of this cracking phenomenon suggests that these cycles create areas of tensile strain at the bottom of the pavement layer, leading to the initiation of microcracks. Under repeated loadings, these microcracks densify, coalesce, propagate, and eventually develop into more visible macrocracks on the pavement surface. Further research in recent years also suggests that under certain conditions cracking can begin at the top of the pavement and progress downward.(43-45) Traditional fatigue testing and performance prediction are based on empirical methods that are developed from the "bottom-up" understanding of fatigue cracking. For fatigue assessment, these methods rely on the simulation of field conditions in the laboratory. As such, typical methods apply cyclic bending stresses to asphalt beams of a particular dimension and support condition.(46) Tests are performed under either controlled stress or controlled strain conditions. Using such methods alone can lead to gross errors in performance prediction when field conditions vary considerably from those used in the laboratory. Further complications with these methods are evidenced by the combined effects of the elements of both material and structure. This shortcoming can be bypassed, however, by separating these two behaviors and focusing on the material separately from the structure. Results of the Strategic Highway Research Program (SHRP) A-003 project acknowledged the need to combine material and structural components in some way.(46,47) Researchers on this project concluded that experimental work should be performed to extract fatigue properties and that mechanistic analysis should be performed to calculate stresses and strains in the pavement structure. Although these researchers made considerable advances in beam fatigue testing-an ever-present shortfall of these tests-the inability of the test to truly separate the material from the structure could not be overcome. A fundamental purpose of this report is to show that material behavior can be accurately described using a simplified laboratory program by using constitutive models that make rigorous theoretical considerations. The benefits of such an approach lie in the constitutive model's use of the fundamental properties that govern material behavior. That is, changes in external conditions, such as temperature and loading level, are easily taken into account without the need for additional experimentation. When combined with a structural model, such as finite elements, this approach can then account for any combination of pavement structure, traffic, and environmental condition. In a previous report, a VEPCD model was characterized using the FHWA ALF mixtures.(13) However, this model was limited because in-service asphalt concrete undergoes a more complicated state of stress than that which was simulated in the laboratory. With this in mind, a possible drawback to the current VEPCD model formulation is the exclusion of stress state dependence. In this chapter, the multiaxial extension, first derived by Ha and Schapery, is characterized and verified using the Control-2006 mixture.(48) As part of the characterization process, results were obtained that allowed further verification of the t-TS principle with growing damage, and these results are presented here. The final section of this chapter presents findings from a study of the uniaxial VEPCD model as it relates to the prediction of cyclic fatigue test results. This section of the report is particularly important because it relates directly to potential test protocols that are to be included in the Simple Performance Tester (SPT)/Asphalt Mixture Performance Tester (AMPT). 4.2. MVECD Characterization in Tension4.2.1. Linear Viscoelastic CharacterizationCharacterization of the MVEPCD model began with the development of a stress state dependent linear viscoelastic model. Following the test protocols presented in chapter 3, frequency-temperature sweep tests were conducted in both the unconfined and confined state. The results of this characterization are shown for the unconfined stress state in table 8, a confining pressure of 250 kPa in table 9, and a confining pressure of 500 kPa in table 10. Generally, higher variability was observed in the confined tests relative to the ones performed under unconfined conditions. However, the variability in both was generally small, on the order of 5 percent. It is also observed from table 8 through table 10 that the confinement effect became more prominent as the temperature increased or the frequency decreased. Table 8. Linear viscoelastic characterization and variation for Control-2006 in unconfined state at selected frequencies and temperatures.
Table 9. Linear viscoelastic characterization and variation for Control-2006 in 250 kPa confined state at selected frequencies and temperatures.
Table 10. Linear viscoelastic characterization and variation for Control-2006 in 500 kPa confined state at selected frequencies and temperatures.
Table 11. Effect of confining pressure on shift factor function coefficients for Control-2006 mixture.
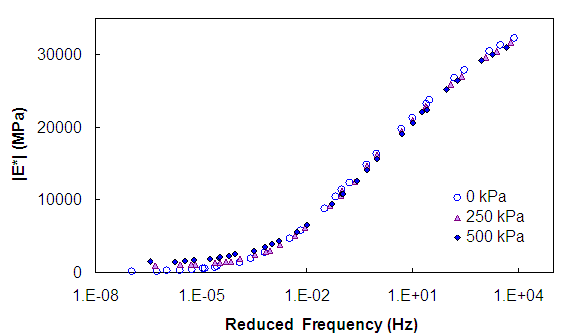
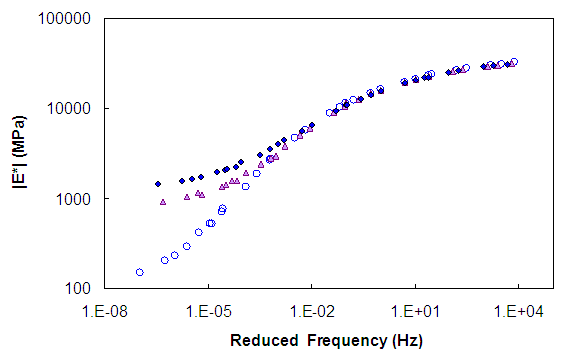
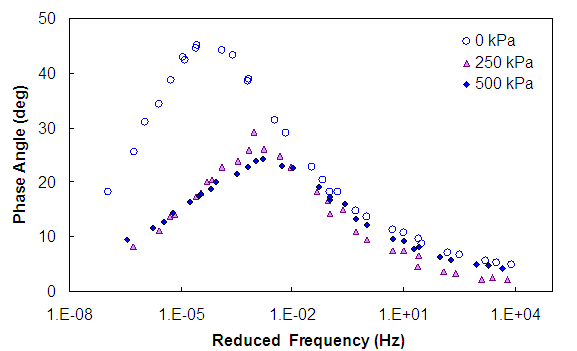
The data presented in table 8 and table 10 have been shifted to form a continuous mastercurve. The results are plotted for the three conditions in figure 19, figure 21, and figure 22. The shift factor function coefficients are shown in table 11. For all cases, zero-mean deviatoric stress conditions (i.e., tension compression) were applied. From figure 19 through figure 21, it is observed that at high reduced frequencies, stiffness and phase angle values were insensitive to confining pressure, but they diverged as the reduced frequency decreased. Furthermore, it is seen from figure 19 and figure 20 that the slope of the confined mastercurve was not as steep as the slope of the unconfined mastercurve, thus suggesting reduced time dependence in the material under confined stress. In addition, by examining the phase angle mastercurves in figure 21, it is seen that at lower reduced frequencies, the material behaved more elastically under confining pressure than it did in the uniaxial state. This effect was not significantly dependent on the confining stress level. The same observation can be made with regards to the t-TS shift factors from figure 22. These observations are consistent with those made by other researchers for asphalt concrete.(22,49) This finding may have implications on the simple performance test protocols since it is known that in the pavement structure complicated stress states do exist. Time and resources do not allow for an indepth investigation into the effects of this phenomenon, and it is unclear exactly what factors influence the phenomenon's magnitude. Care should be taken in using the findings shown in these figures to justify the confined protocol for simple performance testing until the necessary analysis has been completed and further testing is performed. Performing confined dynamic modulus testing, even in the compression mode, is considerably more complex and time-consuming than uniaxial tests. In the end, this effort may be wasteful if, through careful study, the overall impacts of this behavior are similar across mixtures and would be indirectly considered through any mechanistic-empirical analysis calibration process. These observations are also the same as those found from unbound paving materials (i.e., higher stiffness increases the confining pressure). Therefore, the behavior appears to be related to the ability of the asphalt cement to resist dilation of the aggregate skeleton. However the deformation that was applied in these tests was generally small, on the order of 60 One may also question whether the differences observed at low reduced frequencies were related to a permanent hardening of the material, recoverable hardening, or some other mechanism. To examine the possibility of permanent hardening, the frequency sweep test was rerun with no confining pressure approximately 1 hour after decompressing from the first 500 kPa test. Results of this test are presented in figure 25 along with the average from the original uniaxial characterization tests at 54 °C. Similar results were obtained for the two sets of tests, with the test performed after the confined test showing slightly higher values. The slightly higher values could be related to membrane effects but were more likely due to the relative magnitudes of the friction and applied stress levels. The loading rod for the uniaxial tests was not subjected to friction, whereas, in the tests run after the confined test (labeled "unconfined" in figure 25), friction was present where the rod passes through the triaxial cell lid. Regardless of the influence of the friction on the measured modulus, figure 25 shows that the increased stiffness at low reduced temperatures was a mostly recoverable phenomenon at the very least.
Figure 19. Graph. Effect of 500 kPa confining pressure on the dynamic modulus in semi-log space.
Figure 20. Graph. Effect of 500 kPa confining pressure on the dynamic modulus in log-log space.
Figure 21. Graph. Effect of 500 kPa confining pressure on observed elasticity in the Control mixture.
Figure 22. Graph. Effect of 500 kPa confining pressure on the log shift factor function.
Figure 23. Graph. Effect of confining pressure on the relaxation spectrum.
Figure 24. Graph. Use of the uniaxial relaxation spectrum for multiaxial test results.
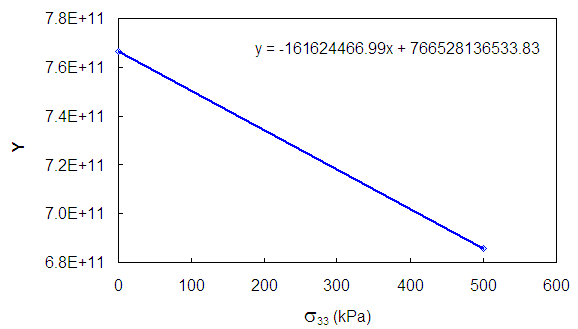
Figure 25. Graph. Effect of performing confined temperature/frequency sweep testing on the unconfined dynamic modulus. 4.2.2. Modeling Stress State Dependence of the |E*|To model the stress state dependence of the |E*| of asphalt concrete, a phenomenological model similar to that used for unbound material moduli was utilized. For the purposes of this report, the modulus mastercurves determined from 0, 250, and 500 kPa were used along with the observations given in figure 19 through figure 25. The relaxation spectrum from the uniaxial test was assumed to be independent of confining pressure, and all pressure effects were combined into the long-time equilibrium modulus (Ε∞ from equation 5). The model used for the equilibrium modulus is shown in equation 85. The characterization results for this model are shown in figure 26, and it was found that k1 = -1,859, k2 = 0.681, and k3 = 10.01. The degree to which these models agreed with the measured responses is shown for the storage modulus in figure 27. Note that the MVEPCD model verification efforts in section 4.4 employ the modulus predicted from equation 85 instead of the measured modulus.
Where: θ = Bulk stress, σ11+σ22+σ33. Pa = Atmospheric pressure. k1, k2, k3 = Fitting coefficients.
Figure 26. Graph. Multiaxial equilibrium characterization results.
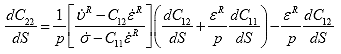
Figure 27. Graph. Multiaxial dynamic modulus model strength. 4.2.3. MVECD Damage Function CharacterizationCharacterization of the MVECD model involves developing the functional relationship of C11, C12, and C22 with damage, S. It is recalled that the general strain energy density function is given as such:
From this equation, the stress and pseudo dilation can be shown as follows:
From equation 87 and equation 88, C11 and C12 may be characterized using uniaxial constant crosshead rate tests under conditions where viscoelastic damage mechanisms dominate the material behavior. C22, however, must be characterized using multiaxial constant crosshead rate tests. 4.2.3.1. Characterization of C11(S)Under uniaxial conditions in equation 87, the pressure is zero, and C11 may be solved at any time as shown in equation 89.
To find the relationship between C11 and S, the damage is first calculated using the chain rule method, equation 90, with C denoting C11 for notational simplicity.
These S values are then refined using the method outlined in the NCHRP 9-19 Final Report.(22) Finally, the functional relationship between C11 and the refined S is determined for each replicate test and averaged to obtain the representative C11-S relationship. This relationship is shown for the mixture under consideration in figure 28. This figure is constructed at a reference temperature of 5 °C and applies only to the material under tensile loading. For this given mixture, it is found that a = -0.00157 and b = 0.5320.
Figure 28. Graph. C11 versus S for tension for Control-2006 mixture (5 °C reference). 4.2.3.2. Characterization of C12(S)Under uniaxial conditions in equation 88, the pressure is zero, and C12 may be solved at any time, as shown in equation 91.
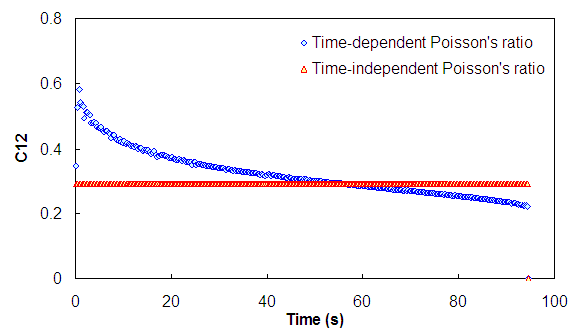
Where: The pseudo dilation is calculated using the convolution of the relaxation modulus and the sum of the axial and radial strain components. Complications arose in C12 characterization due to the differences in time dependence of the axial and radial strains (i.e., the time dependence of Poisson's ratio). The generalized correspondence principle did not account for such time dependence in Poisson's ratio. Instead, the correspondence principle placed all of the time dependence with the relaxation modulus or creep compliance. Through the definitions of pseudo strain and pseudo dilation, it can be observed that C12 = (1-2ν). Thus, C12 defined, in a way, the change in Poisson's ratio with damage. The initial value of C12 was related to the undamaged Poisson's ratio of the material, and any change in this value was assumed to be related to damage effects alone. When the material of interest did not have a constant Poisson's ratio, the same could be claimed because time effects caused C12 to change as well. The data shown in figure 29 demonstrate this effect. Here, a LVE prediction of strains has been performed for the axial and radial strains. These predicted strains were then used to calculate pseudo strain and pseudo dilation. In turn, these values were used to calculate C12, which was plotted against time. Two predictions were performed, one utilizing the time-independent Poisson's ratio and one using the time-dependent Poisson's ratio. Figure 29 shows that the prediction utilizing a time-dependent Poisson's ratio incorporated changes in the values, whereas the values from a time-independent Poisson's ratio did not change with time.
Figure 29. Graph. Effect of time-dependent Poisson's ratio on C12 calculation. To begin, the calculated C12 versus S curves for the asphalt concrete mixture of interest are presented in figure 30. This figure shows that C12 decreased drastically at first and then increased, suggesting that at small damage levels Poisson's ratio increased, and then decreased at some critical damage level. From measurements of the axial and radial strains taken during small strain dynamic loading tests and dynamic modulus tests, it was known that the short-time elastic Poisson's ratio for the material of interest was approximately 0.137. When the data in figure 30 were plotted in semilogarithmic scale, as shown in figure 31, it was observed that at the smallest S values, it was not unreasonable to assume an average C12 value of 0.726. This value of C12 corresponded to a Poisson's ratio of 0.137 and supported the findings from the dynamic modulus tests. The reasons for complications in the characterization of C12 became clear. Any change in the C12 value was assumed to be due to damage alone. However, because the measurements were subject to the time dependence of Poisson's ratio, a change in C12 could be due either to damage growth or time dependence (figure 29).
Figure 30. Graph. C12 characteristic curve for Control-2006 mixture.
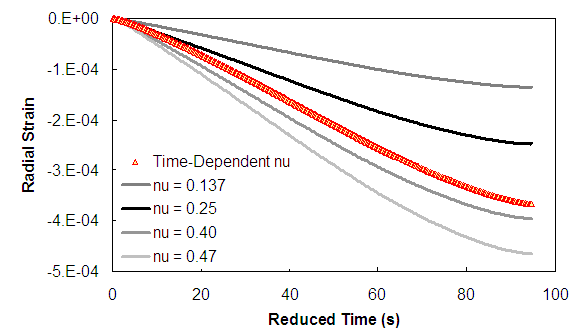
Figure 31. Graph. C12 characteristic curve for Control-2006 mixture in semi-logarithmic space. Because damage affects both axial strains and radial strains, eliminating the time effects from the measurements was not possible. Further, it was not possible to separate the time effects from the true damage effects seen in figure 30. This situation left only a third possibility, which was to assume a constant Poisson's ratio that was overall representative of the material behavior. With this in mind, it was reasonable to assume that the change in curvature of the C12 curves in figure 30 occurred because the effects of damage overwhelmed those of time. To then characterize the material behavior, the value of C12 at the curvature point was averaged for the three replicates (approximately 0.23) and was taken as the initial undamaged C12 value. If this operation was performed, Poisson's ratios at points to the left of the curvature point were all overstated. To clarify the influence of this error, a series of numerical simulations using LVE analysis were performed for tests in the same reduced time range as the characterization tests. In these simulations, the value of radial strains calculated using the time-dependent Poisson's ratio was assumed to be correct (the standard). Then, different time-independent Poisson's ratio values were assumed, and comparisons were drawn between these constant Poisson's ratio predictions and the standard. Numerical simulations were performed in lieu of VECD model predictions because other errors could be introduced in the prediction process otherwise, and the LVE simulation scheme allowed for a more accurate assessment of only the constant Poisson's ratio assumption. Results of the calculations with various assumptions of a constant Poisson's ratio are presented in figure 32. As the figure shows, amongst the values tested, a constant Poisson's ratio of 0.4 performed best. This value was very similar to the point of curvature in the C12 plots shown in figure 30. The error in assuming that Poisson's ratio was equal to the low-bound elastic ratio is demonstrated.
Figure 32. Graph. Effect of different time-independent Poisson's ratio values on radial strain predictions. An assumption of 0.25 for Poisson's ratio did not provide a good prediction. This observation was interesting because the generally accepted value for Poisson's ratio at 5 °C was 0.25. However, this acceptance was based on experience with the resilient modulus test, which applied a much shorter time of loading than these tests. In brief, this observation further emphasized the importance of a reduced time of loading when considering the fundamental behavior of asphalt concrete. From the results of the analytical simulations, the assumed lower bound value for C12 appeared to work well for the tests used in characterization. However, each of these tests covered a similar range in reduced time. The implication for tests that occurred in a more limited range of time, e.g., cyclic tests, was less clear. These tests, when performed at a constant frequency, did not display any time dependence in Poisson's ratio over a given cycle. A cyclic test performed at 25 Hz and 5 °C, for example, might be represented well by a Poisson's ratio of 0.25, but the model would assume it to be 0.386, thus leading to more erroneous predictions than were currently observed in the constant crosshead rate tests. It is unclear exactly how this issue will be addressed. It is hoped that the C12 curve can be scaled appropriately depending on the input conditions, but more experimental data and theoretical development are needed to determine the proper course of action. The form taken for C12 as a function of damage is shown with the data in figure 30 and figure 33. It was observed that at early damage stages, Poisson's ratio changed very little, but generally, as damage increased, Poisson's ratio reduced, as indicated by an increase in C12. For this mixture, it was found that K1 = 0.228558, K2 = -6.9785 x 10⁻⁶, K3 = 0.960065, and K4 = 7.81989 x 10⁻⁷.
Figure 33. Graph. C12 versus S for tensile loading for Control-2006 mixture (5 °C reference). 4.2.3.3. Characterization of C22(S)Characterization of C22 was not as straightforward as the C11 and C12 characterization. For multiaxial loading all three relationships, C11, C12, and C22, had to be used to calculate S, but C22 was not yet known. To compensate for this problem, researchers in the NCHRP 9-19 project developed an iterative technique whereby C22 was substituted, as follows:(22)
Where: υR and εR are calculated from the measured strains based on the relaxation modulus determined at the pressure of interest p. However, there were some concerns over the NCHRP 9-19 interpretation of the problem.(22) As a result of such concern, three methods were examined for the S calculation when the pressure was greater than zero, and the C11 and C12 versus S relationships were known. The first method was based on the NCHRP 9-19 derivation with only slight differences;(22) the second was based on discussions with Schapery; and the third was based on an optimization technique of equation 87. In these methodologies, the pseudo strain and pseudo dilation due to pressure were assumed to have the following equalities:
This assumption was necessary to make equation 87 accurate when no load was applied and to make equation 88 consistent with the terms in equation 87. In a similar manner, the initial value of C22 had to be specified for the consistent transformation from isotropy to transverse isotropy. Because C11 equaled 1 when damage was zero, the initial condition of C22 is given as follows:
4.2.3.3.1. Characterization by NCHRP 9-19 Methodology:(22)By inserting the expression of dual strain energy, equation 86, in the damage evolution law the following was found:
From equation 92, the following was found:
Equation 98 assumed that υR was either a weak function of S or independent of S. Inserting equation 98 into equation 97 yielded the following:
For small Δ ζ, the result was as follows:
With change in notation, it appeared as follows:
Where: S1 = 0. δS is an increment smaller than ΔS=Si+1 - Si, for example, 0.1. δCi = C(Si+dS) - C(Si). These values of S were then used to calculate C12 at a given time step. Because pressure was constant and pseudo dilation and pseudo strain were known as functions of time, equation 88 may be used to directly calculate C22. These values were then plotted against the values of S found from the first step, and the C22-S relationship was developed. Due to some numerical complications, a condition was set such that if the term inside the parenthesis of equation 101 was less than zero, the term was replaced by zero. 4.2.3.3.2. Characterization with Schapery's Approach:Equation 88 was rearranged to solve for C22 (equation 102):
Then, taking the derivative of equation 102 with respect to time and applying the chain rule achieved the following:
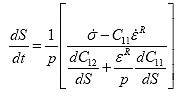
Solving equation 103 for the damage rate resulted in equation 104:
Similarly, using equation 87 resulted in equation 105:
Because equation 104 must equal equation 105, the following can be shown:
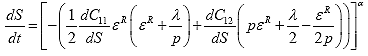
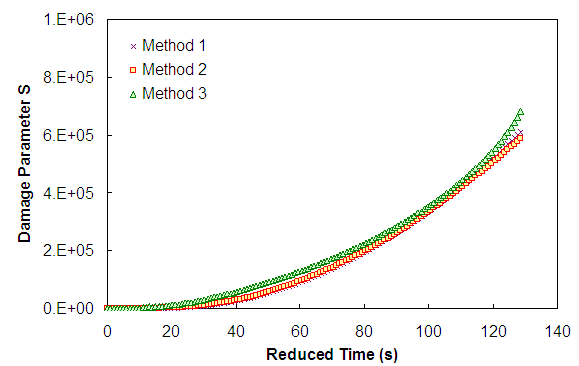
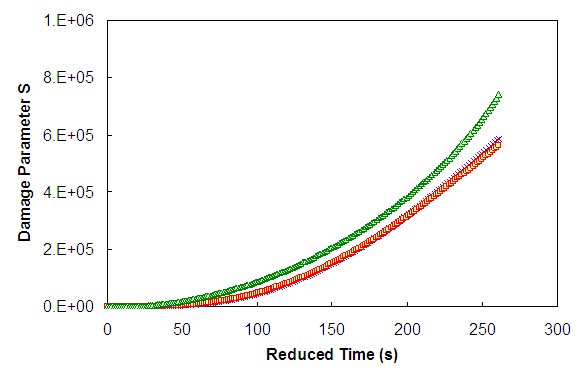
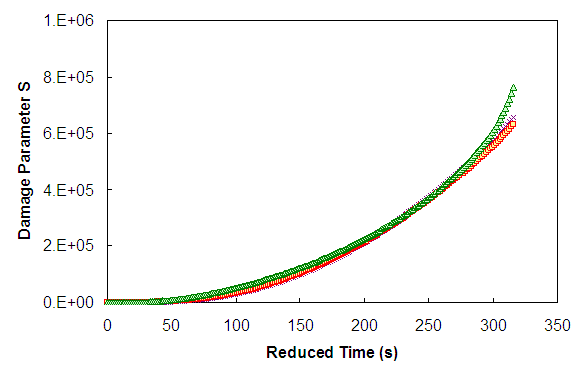
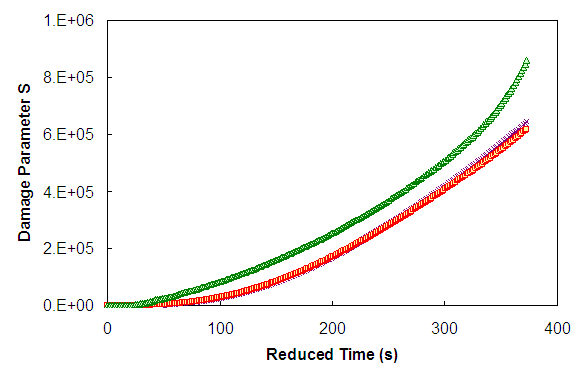
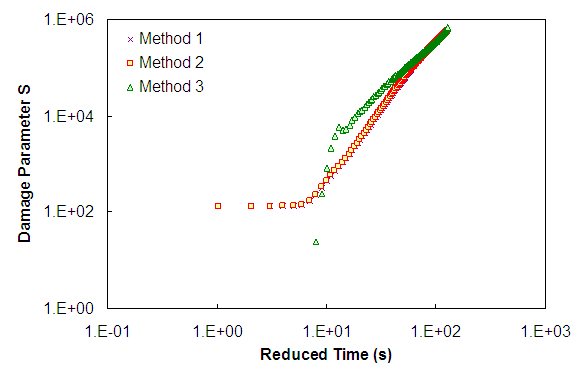
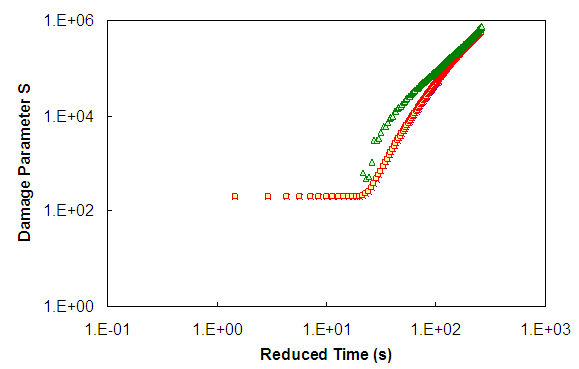
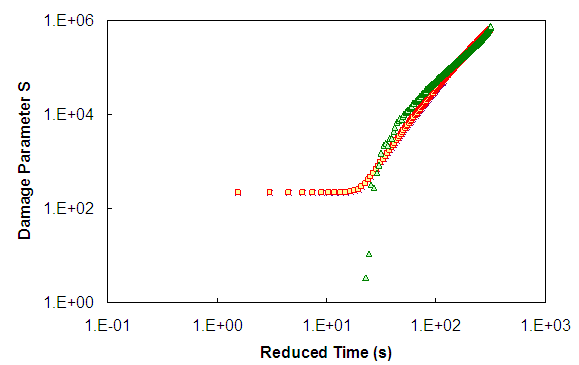
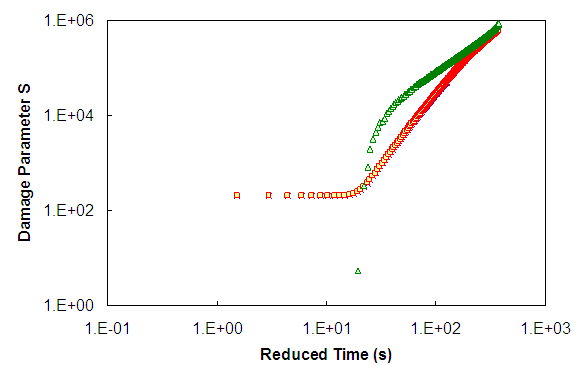
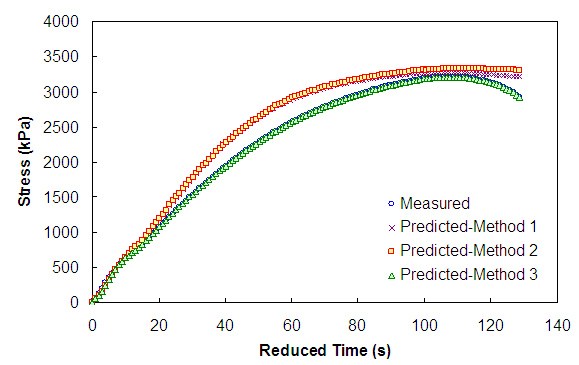
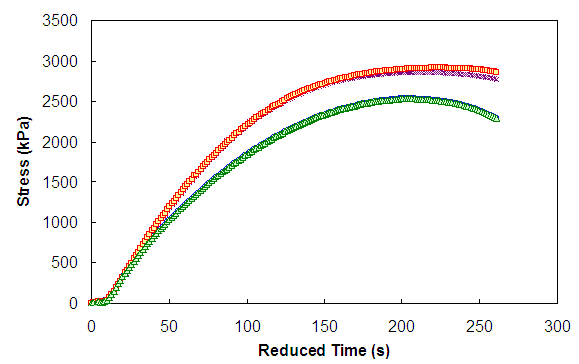
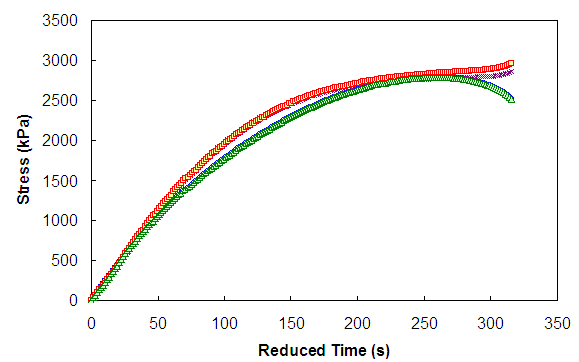
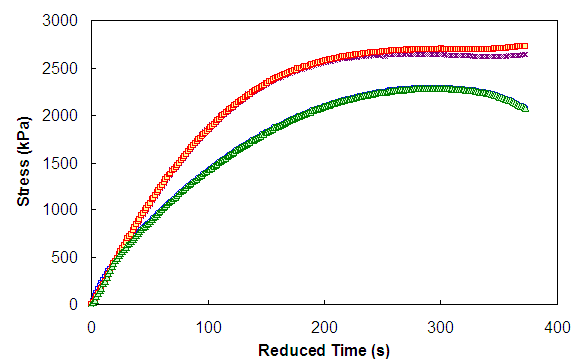
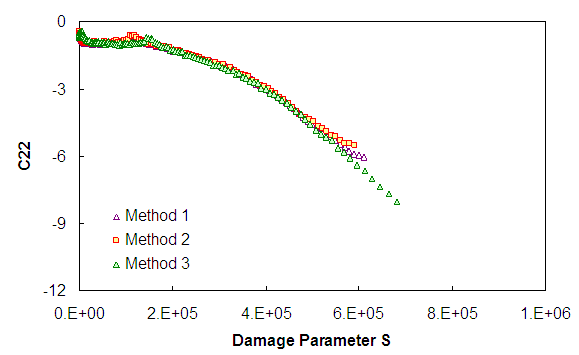
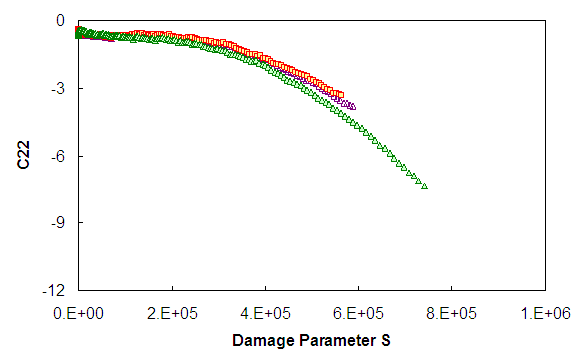
Substituting equation 106 into equation 97 and simplifying found the following: Where: λ = A function of C11, C12, and the pseudo dilation, pseudo strain, and stress rates. Equation 88 may be used to directly calculate C22. These values were then plotted against the values of S found from the first step, and the C22-S relationship was developed. Due to some numerical complications, a condition was set such that if the term inside the parenthesis of equation 101 was less than zero, the term is replaced by zero. 4.2.3.3.3. Characterization by Optimization:From the triaxial constant crosshead rate tests, it was found that pressure was constant, stress was measured, and pseudo strain may be calculated using the measured strains and the relaxation modulus. Then, from equation 87, the only unknown was S. In this methodology, S was solved for by numeric optimization to minimize the error between measured stress and the stress calculated from equation 87. These values of S were then used to calculate C12 at a given time step. Because pressure was constant, and pseudo dilation and pseudo strain were known as functions of time, equation 88 may be used to directly calculate C22. These values were then plotted against the values of S found from the first step, and the C22-S relationship was developed. 4.2.3.3.4. Comparison of Methodologies:Each of the above methods has been used to characterize S. Comparisons were made first with the S values as functions of time for a single test. Figure 34 through figure 37 and figure 38 through figure 41 show the S calculated from each of the methods in both arithmetic and logarithmic scales. Figure 42 through figure 45 present the stress calculated using the characterized S and equation 87. Method three used optimization; thus, the predicted stress and measured stress agree exactly. Figure 46 through figure 49 show the damage characteristic relationship by each technique for the four tests. The final representative C22(S) function is shown in figure 50. The initial conditions required H1 to be equal to equation 95. Explicitly, the coefficients for C22(S) are H1 = -0.633435, H2 = 3.0834 x 10⁻⁵, and H3 = 0.83682.
Figure 34. Graph. S as a function of reduced time calculated by three different methodologies in arithmetic space for 5-1-T.
Figure 35. Graph. S as a function of reduced time calculated by three different methodologies in arithmetic space for 5-3-T.
Figure 36. Graph. S as a function of reduced time calculated by three different methodologies in arithmetic space for 5-4-T.
Figure 37. Graph. S as a function of reduced time calculated by three different methodologies in arithmetic space for 5-5-T.
Figure 38. Graph. S as a function of reduced time calculated by three different methodologies in logarithmic space for 5-1-T.
Figure 39. Graph. S as a function of reduced time calculated by three different methodologies in logarithmic space for 5-3-T.
Figure 40. Graph. S as a function of reduced time calculated by three different methodologies in logarithmic space for 5-4-T.
Figure 41. Graph. S as a function of reduced time calculated by three different methodologies in logarithmic space for 5-5-T.
Figure 42. Graph. Predicted and measured stress as a function of reduced time for different S calculation methodologies for 5-1-T.
Figure 43. Graph. Predicted and measured stress as a function of reduced time for different S calculation methodologies for 5-3-T.
Figure 44. Graph. Predicted and measured stress as a function of reduced time for different S calculation methodologies for 5-4-T.
Figure 45. Graph. Predicted and measured stress as a function of reduced time for different S calculation methodologies for 5-5-T.
Figure 46. Graph. C22 as a function of S calculated by different methodologies for 5-1-T.
Figure 47. Graph. C22 as a function of S calculated by different methodologies for 5-3-T.
Figure 48. Graph. C22 as a function of S calculated by different methodologies for 5-4-T.
Figure 49. Graph. C22 as a function of S calculated by different methodologies for 5-5-T.
Figure 50. Graph. Representative C22 versus S for tension using optimization methodology (5 °C reference). 4.3. Viscoplastic Modeling of Asphalt Concrete in TensionWith the damage characteristic functions thus characterized, it was possible to predict the material behavior under conditions where viscoelastic damage mechanisms dominate. However, it was known that viscoplastic effects may have been significant factors governing the overall behavior of asphalt concrete in tension. Currently, viscoplastic effects are considered using an empirical strain-hardening model. Because details of this model have been presented previously and elsewhere, only the integrated form of the constitutive equation is shown here in equation 108.(12,13,25)
As with the MVECD model, the characterization of equation 108 utilized constant crosshead rate tests under confining pressure. The procedure first required prediction of the VECD related strains of such tests at high temperatures. Viscoplastic strains were then backcalculated by subtracting the predicted MVECD strains from the measured values. This process was repeated in multiple tests where viscoplastic strains were considered to be significant. The backcalculated values for these tests were then presented to the model, and the coefficients were determined by optimization using a genetic algorithm. For the prediction of viscoplastic behavior under various confining states, a phenomenological observation was utilized. From the characterization, it was found that the coefficients p and q are not strongly affected by confining states, but the coefficient Y was found to depend heavily on confining pressure. This relationship, along with the stress dependent model, is shown in figure 51.
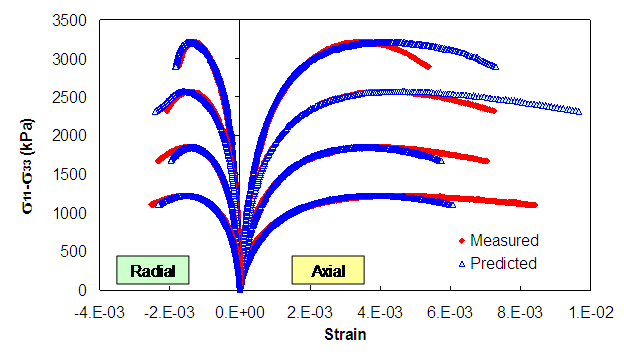
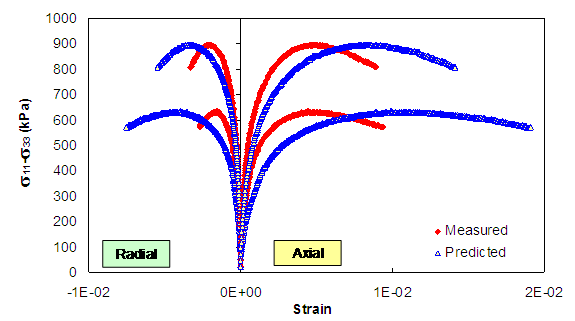
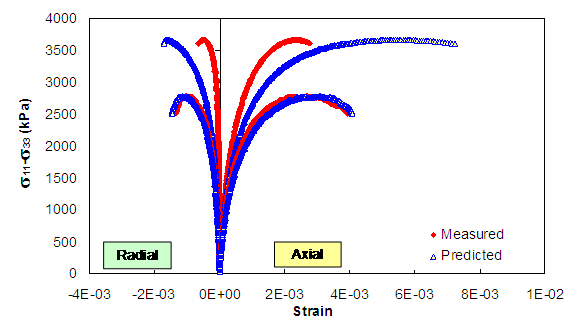
Figure 51. Graph. Effect of confining pressure on coefficient Y. 4.4. MVEPCD Model VerificationVerification tests for the MVEPCD model were similar to those used for characterization (i.e., constant crosshead rate tests under a constant confining pressure). Some of the tests were performed at the same confining pressure as characterization tests, but at a different temperature (25 °C). A second verification test was performed at the same temperatures as characterization but at a different confining pressure (250 kPa). Results of the first verification data set are shown in figure 52. Both axial and radial strain predictions are shown in this figure. Although not shown here, the agreement observed in figure 52 was approximately the same as that observed in the verification of the uniaxial VEPCD model. This agreement was considered a good match with the measurements. The results of the second verification data set are shown in figure 53 for 40 °C and in figure 54 for 5 °C. Although this data set did not show as good an agreement with the measured response, the fitting was considered reasonable.
Figure 52. Graph. Results of MVEPCD model simple verification for constant crosshead rate tests under 500 kPa confinement at 25 °C.
Figure 53. Graph. Results of MVEPCD model verification for constant crosshead rate tests under 250 kPa confinement at 40 °C.
Figure 54. Graph. Results of MVEPCD model verification for constant crosshead rate tests under 250 kPa confinement at 5 °C. 4.5. t-TS with Growing Damage in TensionIt has been shown repeatedly that dense-graded asphalt concrete, including that with modified binders, exhibits t-TS under growing damage in the uniaxial stress state. Less conclusive results are available for the behavior of mixtures under confining pressure. Therefore, it was necessary to verify the principle of t-TS under confining pressure. Verification was performed following the method presented in Chehab.(20) The advantage of utilizing this method was that tests used for validation of t-TS may also have utilized in the characterization procedure, thus reducing excessive testing. A brief schematic representation of the process is presented in figure 55 through figure 57. In short, stress as a function of reduced time for constant crosshead rate tests performed at different rates and temperatures was plotted for a given strain level. Therefore, each test produced a single point in the respective plot. This process was repeated for several strain levels covering a broad range in material behavior. If t-TS with growing damage was valid, then the resulting plots would appear to be continuous. Figure 55. Illustration. Schematic representation of first step for verifying the t-TS principle under growing damage, finding stress for different tests at a consistent strain level.
Figure 56. Illustration. Schematic representation of the second step for verifying the t-TS principle under growing damage, finding reduced time for the stress found in the first step for each test.
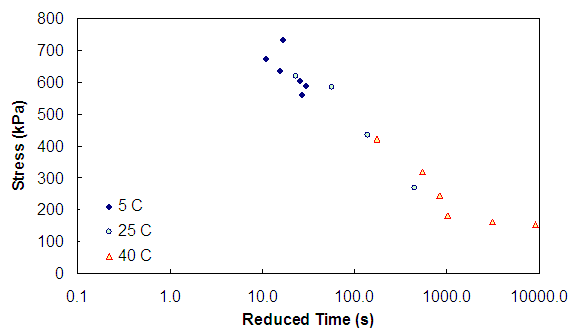
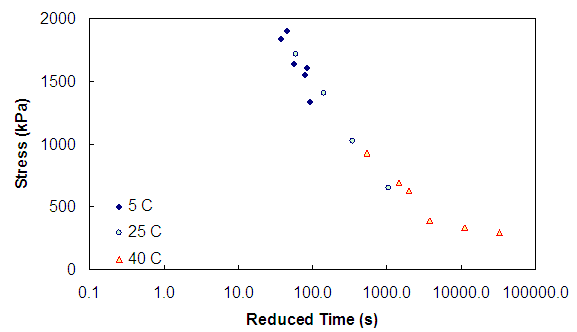
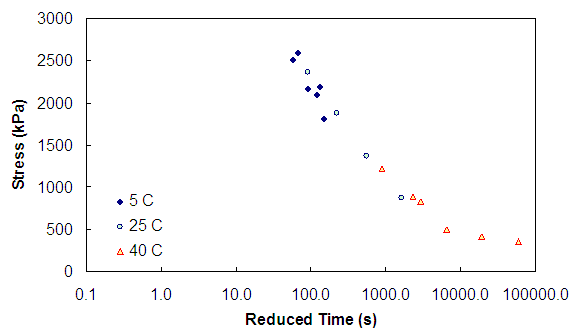
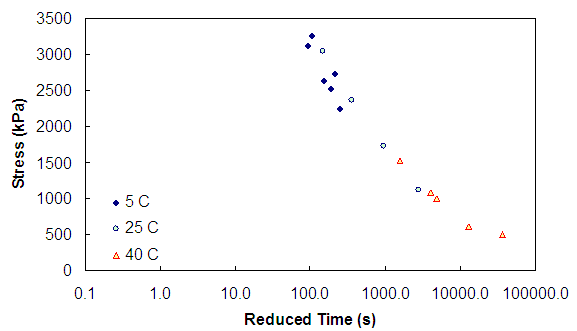
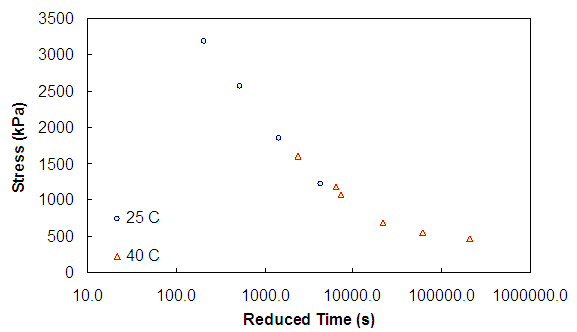
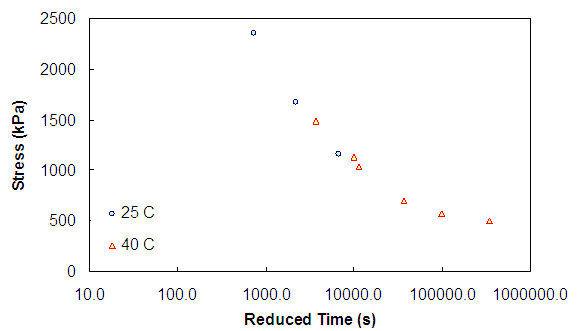
Figure 57. Illustration. Schematic representation of the third step for verifying the t-TS principle under growing damage, plotting the stress from the first step against the reduced time from the second step. The strain levels examined for t-TS analysis are shown graphically along with the stress-strain curves in figure 58. The stress-strain curves in figure 58 represented all the tests noted in table 3, and the examined strain levels covered both low damage (low strain levels) and high damage (high strain levels) ranges. The resulting stress versus reduced time curves at these strain levels are presented in figure 59 through figure 64. At all strain levels examined, the curves appeared continuous, and thus, t-TS under deviatoric tension conditions was satisfactorily verified. In figure 63 and figure 64, data for 5 °C were not presented due to localization of the strain prior to reaching the given strain levels. This observation is also apparent in figure 58, in which the tests with the highest strength were performed at 5 °C.
Figure 58. Graph. Strain levels examined for verifying the t-TS principle under growing damage and confining pressure for the Control-2006 mixture.
Figure 59. Graph. t-TS with growing damage under confinement verification at a 0.0001 ε level.
Figure 60. Graph. t-TS with growing damage under confinement verification at a 0.0005 ε level. Figure 61. Graph. t-TS with growing damage under confinement verification at a 0.001 ε level.
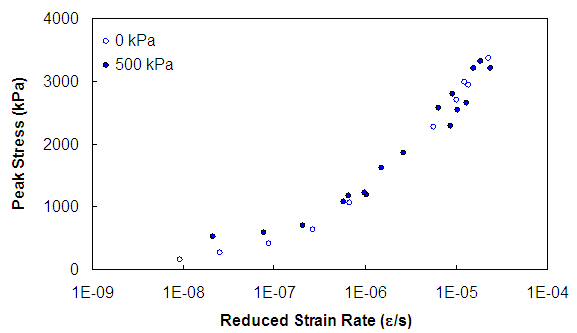
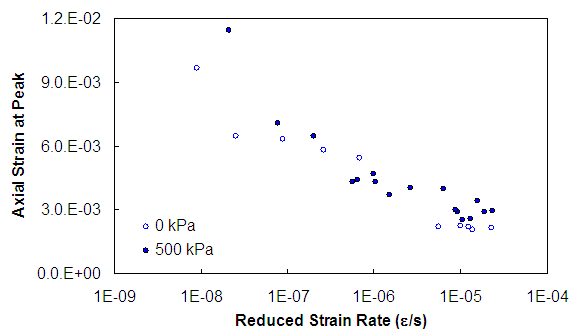
Figure 62. Graph. t-TS with growing damage under confinement verification at a 0.0022 ε level. Figure 63. Graph. t-TS with growing damage under confinement verification at a 0.004 ε level. Figure 64. Graph. t-TS with growing damage under confinement verification at a 0.007 ε level. 4.6. Engineering Behavior in Confined TensionVerification of t-TS with growing damage under confining stress permitted the development of mastercurves for various engineering parameters. Such curves were created in much the same way as LVE mastercurves (refer to subsection 2.2.1). In this case, the reduced variable of interest was the reduced strain rate. This value was calculated for a given test by multiplying the physically observed strain rate by the time-temperature shift factor for that test. The time-temperature shift factor was determined by using the test temperature with the time-temperature shift factor function shown in figure 22. One such curve of particular interest was the strength mastercurve, which is shown for both the confined and unconfined conditions in figure 65. Each point in these curves reflected the result from a single test. When examining this figure, the tests performed at higher temperatures resulted in lower reduced strain rates, and tests performed at lower temperatures resulted in higher reduced strain rates. No tests were performed at intermediate temperatures in the unconfined condition, and thus, no data were available in the middle reduced rates for this stress condition. From figure 65, results similar to those observed in LVE characterization were seen. Specifically, strength did not appear to be a function of confining pressure at high reduced rates but did appear to be a strong function of confining pressure at lower reduced rates. Also, less rate dependence was observed in the confined test at lower reduced rates. Another similar curve of interest was the strain at failure mastercurve. This curve provided a glimpse of the effect of temperature and rate on ductility. Plots of the strain at failure mastercurves under both the confined and unconfined conditions are shown in figure 66. Given the variability in these measurements, it was difficult to find any certain conclusive differences in the ductility with pressure. However, the data seemed to indicate an increase in ductility under all conditions, particularly at low reduced rates (i.e., high temperatures). The observation regarding asymptotic behavior of both stiffness and strength at the low reduced frequencies/rates did not seem to transfer to the ductility.
Figure 65. Graph. Effect of 500 kPa confining pressure on strength mastercurves.
Figure 66. Graph. Effect of 500 kPa confining pressure on ductility in constant crosshead rate tests. 4.7. Fatigue Analysis with VECD Model4.7.1. VECD Integrated Formulation SummaryFormulas relating to the existing formulation of the VEPCD model are shown in equation 109 through equation 116. The damage evolution law is given by the following:
Where: The dual energy density function for uniaxial loading was as follows:
This leads to the constitutive relationship, which is shown in equation 111.
Noting that increments of time are generally small, the following can be assumed.
Thus,
Because only C was a function of damage, equation 113 simplified to the following:
However, in the case where only stress and time were given, it was convenient to observe that the following: Assuming that pseudo strain was constant over a given increment of time, equation 114 can be recast as follows: For solving equation 116, either an iterative technique or the analytical representation of δC/δS can be used. The important aspects of this formulation as they relate to this report are as follows:
4.7.2. Formulation of Lee, Daniel, and KimFormulas relating to the previous formulation as they have been applied in the past are shown in equation 117 through equation 123.
Where: I = Normalization factor. εeR = Effective pseudo strain = εR - εsR. εsR = Permanent pseudo strain. F = Function representing the slope of an individual stress-pseudo strain loop. G = Hysteresis function. H = Healing function. It was observed that the damage function, C, is not explicit in equation 117; rather, C enters through the function, F, as follows:
Equation 117 led to the pseudo energy density function shown in equation 119:
The damage evolution law was the same for this approach and the current approach. Because G and H were not functions of damage, the damage growth equation became the following: Previous researchers further simplified this equation by taking only the pseudo strain values at the peak and then performing the chain rule operation as follows:
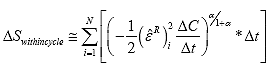
Where: εRm,i = Peak pseudo strain of cycle i. εRme,i = Effective pseudo strain at the peak of cycle i. Ci = Pseudo stiffness at the εRm,i. Ci-1 = Pseudo stiffness at εRm,i-1. Δt = Cycle pulse time times the number of cycles occurring between observation i and observation i - 1. If it is assumed that the permanent pseudo strain at the beginning of the cycle was approximately equal to the permanent pseudo strain at the peak of the cycle and if it is assumed that the permanent pseudo strain was much smaller than the maximum pseudo strain, then equation 121 can be recast as follows:
In terms of the iterative approach currently used, the following was the case:
The important aspects of this formulation as they relate to this report are as follows:
4.8. Simplified Analysis of Cyclic Fatigue Data4.8.1. Correction Factor in Formulation of Lee, Daniel, and KimTo make cyclic and monotonic data agree in the previous formulation, it was necessary to introduce a pseudo stiffness time change correction factor, M, into the damage calculation function.
To examine the significance of equation 124, it must be returned to its base form before the introduction of factor, M, to equation 121. Undoing the final simplification step for this equation is as follows:
In order to make equation 125 agree with equation 124, it was necessary to introduce the correction factor, M, as shown in equation 126.
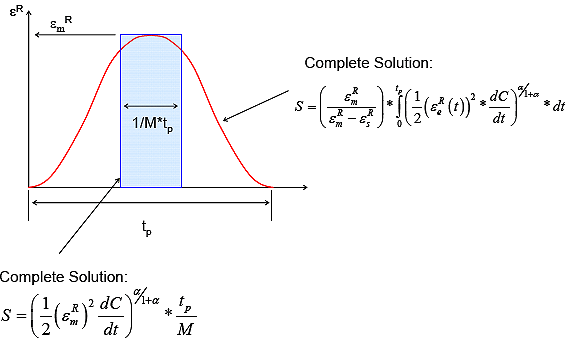
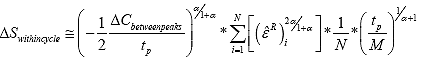
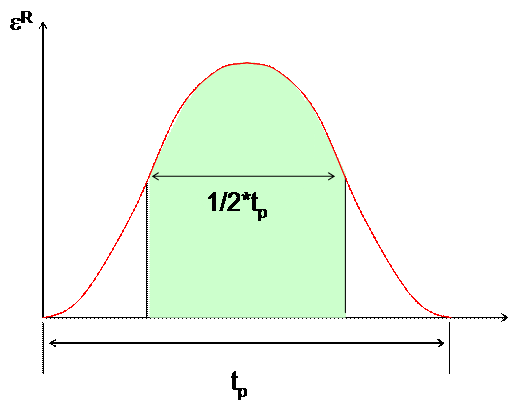
From this equation, it was observed that a factor, M (taken as 4 in previous research), introduced in the manner shown in equation 124, implied that the pseudo stiffness decreased at a rate of M times the observed cycle averaged rate for a period of 1/M*tp (figure 67). Mathematically, this approach can be schematically represented in figure 69. This figure indicates that the problem was simplified from that of a cyclic load application with magnitudeεRm to a square wave form of duration 1/M*tp and a magnitude equal toεRm. Although the square waveform is shown centered about the pulse, no real consideration was given to it when the equivalent square pulse was located during the cyclic pulse.
Figure 67. Illustration. A schematic representation of the concept of average dC/dt.
Figure 68. Illustration. A schematic representation of the effect of the M factor on dC/dt used in calculation.
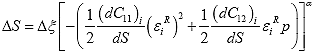
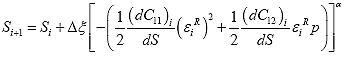
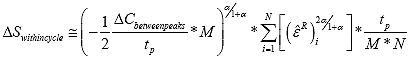
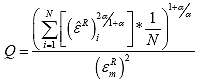
Figure 69. Illustration. Mathematical equivalence of the formulation used by Lee, Daniel, and Kim.(3,4,5) 4.8.2. Rigorous Analysis of Pseudo Strain History EffectsThe primary complication was that pseudo stiffness values were taken only at the peak. However, in order to have a net reduction in pseudo stiffness over a cycle, the damage must evolve during loading. Some assumptions had to be made regarding how damage grew between the peak values to more rigorously apply equation 120. Ideally, it should be possible to use the measured data to determine exactly when damage seems to grow, but complications in the analysis of full-time data in cyclic tests prevented such an approach. Because the integration was so well defined and repeatable (constant cyclic loading, for example), the correction factor could be simplified and applied in a way similar to the previous formulation by introducing another derivable factor, Q, as shown in equation 127. This factor was known as the pseudo strain shape factor and accounted for the time-varying pseudo strain history. It was hypothesized that the more rigorously accurate solution to equation 120 is given by equation 127 (in contrast to equation 124).
To derive the factor, Q, the G and H functions in equation 119 had to be ignored and substituted with an analytical expression for total pseudo strain as a function of time. This expression was denoted by
Equation 128 implies a different form for the constitutive relationship. In particular, the factor, εmR/( εmR - εsR ), was lumped in with the effective pseudo strain. This particular factor did not affect equation 127; however, it did imply arrival at equation 127 somewhat differently than was done previously (equation 120 through equation 122). During the cycle, damage grew over only a certain portion of the cycle pulse time, tp. Furthermore, during this time, pseudo stiffness reduced linearly at a rate such that the total reduction in pseudo stiffness that occurred over this reduced portion was equal to the experimentally observed reduction in pseudo stiffness between peaks. Mathematically this phenomenon is as follows:
Where: M = Factor denoting the inverse of the proportion of total pulse time when damage occurs (i.e., if it is assumed that damage occurs during only a quarter of the pulse time, then M = 4). tp = Cycle pulse time (1/f). N = Number of discrete points used in the numerical calculation. Substituting equation 129 and equation 130 into equation 128 and then simplifying found the following: A comparison of equation 133 and equation 127 illustrated that the factor, Q, could be solved as follows: It was then necessary to assume over which range of tp damage would occur. For controlled stress testing, it was assumed that damage growth occurred over only half of the loading cycle and was centered over the peak stress. It was important to specify the proportion of loading where damage occurred and when damage occurred in the loading cycle. The functional form of A schematic view of the assumptions made for controlled stress loading conditions is shown in figure 70. The shaded region the figure represents the portion of the loading pulse where it was assumed that damage was occurring.
Figure 70. Illustration. Schematic representation of assumptions made for controlled stress cyclic loading to develop Q and M factors. In the case of controlled crosshead loading, the functional form for
A schematic view of the assumptions made for controlled crosshead loading is shown in figure 71. Again, the shaded region represents the portion of the load pulse where it was assumed that damage was occurring.
Figure 71. Illustration. Schematic representation of assumptions made for controlled crosshead cyclic loading to develop Q and M factors. Finally, combining the pseudo strain shape factor and the pseudo stiffness time factor into a single parameter, Z, resulted in the following relationship:
Where: Z factor was given by the following equation 138.
In the work of Lee, Daniel, and Kim, the Z factor was given by equation 139.(3-5)
The tests used to verify the above derivation are summarized in table 12. The four ALF mixtures used in the VEPCD model verification and discussed in detail elsewhere were used here.(12,13) Table 12. Cyclic tests performed.
Table 13. Summary of cyclic correction factors.
The comparisons of the C versus S curves characterized from the monotonic tests and from cyclic tests are shown in figure 72 through figure 75. The loading portions of the first cycle in all of the tests shown in figure 72 were calculated using the formulation shown in equation 29.
Figure 72. Graph. Damage characteristic comparison, cyclic to monotonic using equation 127 Control mixture.
Figure 73. Graph. Damage characteristic comparison, cyclic to monotonic using equation 127 CRTB mixture.
Figure 74. Graph. Damage characteristic comparison, cyclic to monotonic using equation 127 SBS mixture.
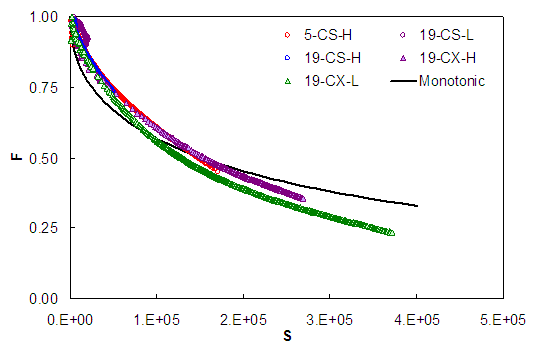
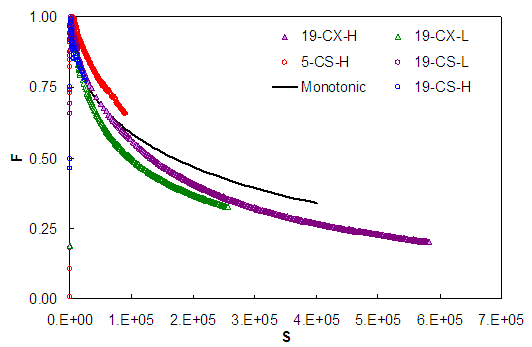
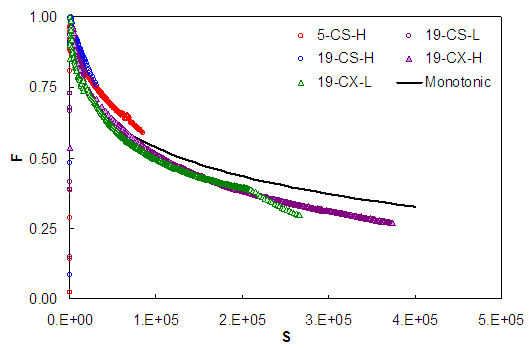
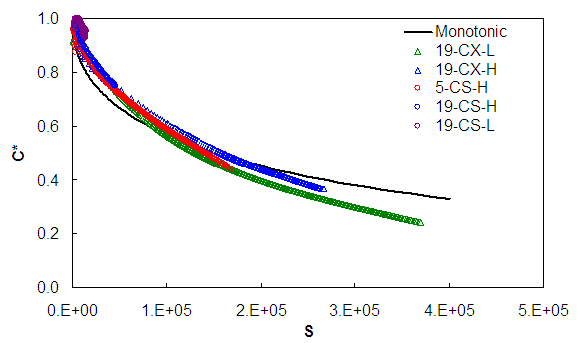
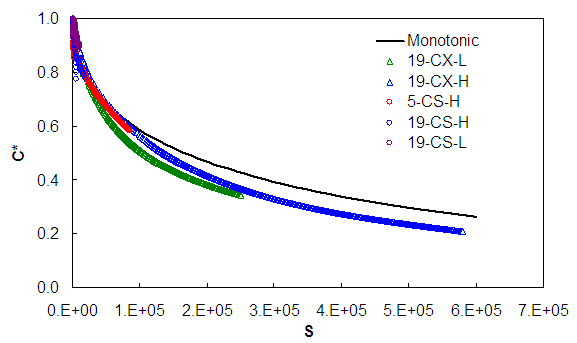
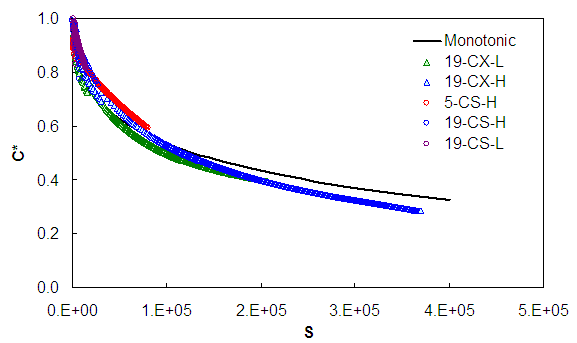
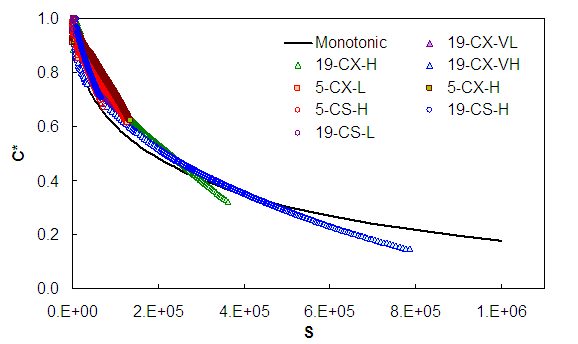
Figure 75. Graph. Damage characteristic comparison, cyclic to monotonic using equation 127 Terpolymer mixture. 4.8.3. Discussion of Simplified Model ApproachFigure 72 through figure 75 show that the collapse of the damage characteristic curve between cyclic and monotonic data depended on both the mixture and test conditions. The Control and CRTB mixtures showed the most favorable overall collapse, whereas the SBS and terpolymer mixtures showed the least favorable collapse. For each of the mixtures, the degree of collapse appeared to reduce as the amount of permanent strain developing in the test increases. In general, such permanent strains were significantly higher in the CS tests than they were in the CX tests. These strains also tended to increase as a percentage of the total with lower input amplitudes or higher temperatures. These results appeared to become significant for only the 19-CS-L test for the Control and CRTB mixtures. The SBS mixture showed the effects under both of the 19 °C CS test conditions, whereas the terpolymer mixture showed major effects under only the 19-CS-L and the CX conditions. In addition to the effects of permanent strain, the collapse may have been affected by errors in some of the aforementioned assumptions made for the calculation of damage. Unfortunately, the direct verification of these assumptions was not possible due to uncontrollable data analysis and acquisition errors. Additionally, in cyclic loading, it was possible that other mechanisms, such as nonlinear viscoelasticity and microcrack healing, may have occurred. If this was the case, these mechanisms may not have been triggered by constant rate tension testing. Therefore, it was not expected that the curves would collapse until the model was appropriately formulated. Another potential source of error lay with the α variable in the VEPCD model. Two different physical interpretations of the α variable were used in the literature. However, these interpretations were based on the physical consequences for a single macrocrack (i.e., fracture process zone characteristics, which may have had no relation to the physical realities of a continuum damage problem). In addition, the interpretation of α as a constant value independent of test conditions was based on certain LVE characteristics. These particular characteristics were not observed for asphalt concrete under every condition. In addition, because α was an exponent in the model, its impact was complicated and could have caused an increase or decrease in the damage prediction, depending on temperature, mode of loading, and amplitude of loading. 4.9. Refined Derivation of Simplified Fatigue ModelThe previous formulations had some obvious problems either in the rigor of their derivations or in the assumptions made. To address this problem, a new formulation was proposed. In the following subsections this refined formulation is given. Then, the refined formulation is further simplified into a form which can be easily programmed into a spreadsheet for fatigue life predictions. To be clear, the definition used for pseudo stiffness with this formulation is shown in equation 140. Notice that pseudo stiffness is given by the variable F to differentiate it from the definition used in the previous formulations. Qualitative the meaning of F and C are the same even though they differ slightly quantitatively.
Where: σ0,ta = The stress tension amplitude. ε R0,ta = The pseudo strain tension amplitude. I = The normalization factor (0.9-1.1). 4.9.1. Identification of Tensile Loading TimeTo quickly analyze the cyclic data in the simplified mechanics model, it was important to identify the actual time that a given cycle was under tensile loading. This time was important because it was assumed that fatigue damage occurred only under such conditions. To determine this time, it was assumed that regardless of the input condition the following analytical function was descriptive of the stress history of any given cycle for the tests used in this study: Where: σ0,ta = The tension stress amplitude and for generality time was given as reduced time, ζ. The βterm, defined by equation 142, was a factor that allowed direct quantification of the duration that a given stress history was tensile. In equation 142, (σpeak)i was the largest value within cycle i, and (σvalley)i was the smallest value within cycle i.
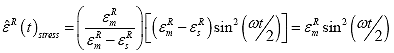
When β = 1, the entire stress (and therefore the pseudo strain minus permanent pseudo strain) history for the given cycle was tensile; when β = 0, half of the history was tensile; and when Noting that the total pulse time was ωR/(2π) and using the definition of stress shown in equation 141, the factor M used in the previous formulation can now be rigorously calculated using equation 143.
With the definition of total stress history and β in equation 141 and equation 142 respectively, it can be shown that the tensile amplitude can be calculated from the peak-to-peak values if β is known by equation 144. Although equation 144 is shown for stress, it can also be applied to pseudo strain.
Finally, it can be shown that the times during the load pulse at which tensile loading begins and ends for any given cycle are, in terms of the coefficient, β, and the reduced loading frequency, ωR, given by equation 145 and equation146.
4.9.2. Defining AlphaThe power,α, in the VECD model has been discussed previously. In the reformulated model, the power was defined more clearly. Through theoretical arguments that use the macrocracking phenomenon, this power was found to relate to linear viscoelastic time dependence.(9) Motivated by earlier work on this subject, the maximum absolute value of the log-log slope of the relaxation modulus, m, was taken to represent the linear viscoelastic response. (See references 4, 5, 7, and 8.) According to the theory, if the material's fracture energy and failure stress are constant, then α = 1/m + 1, but if the fracture process zone size and fracture energy are constant, then α = 1/m. A review of the literature shows that different researchers have used differing α values. Some researchers suggest that it is most appropriate to use α = 1/m for the type of CS tests that were performed in this current study and α = 1/m + 1 for the CX tests.(3,4) This approach is supported by the work of other researchers that uses the constant failure stress and energy criteria for the CX tests and by separate studies which have used CS-type tests and α = 1/m.(5,7,12) Therefore, this study used α = 1/m + 1 for the CX tests, and α = 1/m for the CS tests. No attempt was made in this work to calibrate these relationships further. A summary of the α values used for the mixtures of interest is given in table 14. Table 14. Summary of αvalues for refined model.
4.9.3. Failure in Cyclic Mode of LoadingTwo criteria were adopted to define the cycle at which data could be used in the VECD characterization/verification process. Two different criteria were necessary because the CS and CX tests failed in quite different patterns and because each criterion captured one of the two possible reasons that it was inappropriate to use a given test result: (1) localization of damage at the point of a single macrocrack, or (2) the onset of additional dominating mechanisms that were not related to microdamage. To identify the point of macrocrack localization in these tests, the method suggested in the literature, whereby the cycle at which the phase angle showed a sharp decrease, was taken as Nf.(58) This cycle was identified graphically by plotting the phase angle versus cycle number. During the test, the phase angle tended to increase steadily until a point at which it dropped rapidly. The cycle where this rapid drop occurred was N-f.. When processes other than damage mechanisms, such as viscoplasticity, began to have significant effect, then a test could no longer be used directly for characterization. Although at this time rigorous identification of this occurrence was not possible, it was assumed that the onset of other mechanisms was closely related to the total amount of permanent strain experienced by the specimen. It was known from experience that the constant crosshead rate tests at 5 °C and strain rates above 1 x 10⁻⁵ for unmodified mixtures and 1 x 10⁻⁴ for polymer-modified mixtures were dominated by the viscoelastic damage mechanisms.(7,12) It was also known that for any given mixture the tests performed at these rates showed similar strain levels at the peak stress. These mixture-dependent strain levels represented a known level below which VECD mechanisms dominate. The cycle in the fatigue tests at which the permanent strain exceeded this threshold was taken as the point after which data could not be used for VECD characterization. To find the permanent strain during the cyclic test, the permanent pseudo strain was tracked by cycle. Then these permanent pseudo strain values were compiled as a function of reduced time, where reduced time was taken at the end of the beginning of the respective cycle where the permanent pseudo strain was known. It was then assumed that the permanent pseudo strain varied linearly within the cycle (the final value for cycle i was equivalent to the initial value for cycle i + 1). With this assumption, equation 16 could be inverted and used with the state variable formulation to solve for permanent strain. Note that while the effect of assuming a linear pseudo strain growth is not explored here, the effect of this assumption was small since the amount of permanent pseudo strain within a cycle is generally very small. When either of these two conditions was met, failure was said to have occurred, and all data gathered afterward were ignored. Thus, all of the data shown in any of the subsequent graphs represent the data prior to this failure point. It is worth noting that in this study all tests in the CX mode failed due to the rapid change in phase angle, while all tests performed in the CS mode failed due to exceeding the strain limit. 4.9.4. Refined Simplified Model DerivationThe basic concept of the refined model is to separate the damage calculation into two components: damage occurring in the first loading path and damage occurring due to the repeated loading. These two components were referred to as the transient and cyclic portions respectively. The mathematical implications are given in equation 147.
Where: ζp = Reduced cycle pulse time. This refined method assumed that all of the effects of damage were shown through a reduction of the cyclic pseudo stiffness, F. This assumption did not mean that damage affected only the cyclic pseudo stiffness but rather that this pseudo stiffness wholly reflected damage effects. It was also assumed that damage growth within a given cycle was small. The test data were still normalized for specimen-to-specimen variability by the correction factor, I, defined earlier. The transient calculation was the same as the rigorous calculation shown in equation 114, but the form of the cyclic portion was given by equation 148 where the variable R was a form adjustment factor. The subscript k was only a placeholder to represent the fact that the factor R could vary from cycle to cycle depending on the particular loading history. During real experiments this might occur due to slight deviations in machine control. In general, though, the value of R varied only slightly throughout loading. However, the refined model was capable, by including the form adjustment factor, to explicitly account for any load form shape (i.e., square, saw-tooth, sinusoidal, etc.), or combinations of shapes, as long as that load history did not violate the assumptions made in the following paragraphs.
This adjustment factor was found by assuming that equation 150 could be used to simplify the more rigorous equation 149.
Setting equation 149 equal to equation 150 and noting that (equation 152):
gave the following (equation 153):
Finally, if it was assumed that within a cycle,
which simplifies to (equation 155):
The implication of assuming that
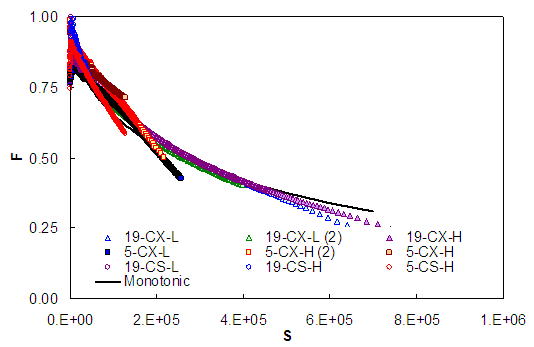
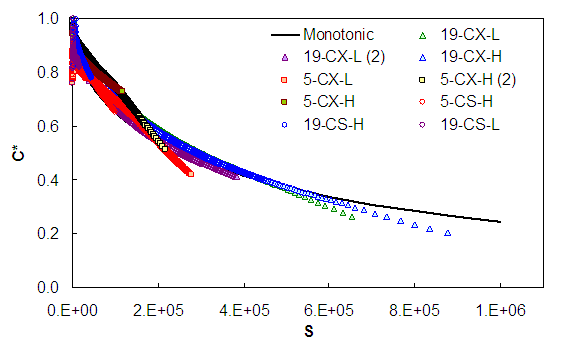
4.9.5. Model ApplicationThe refined model was applied to the tests given in table 12, and the comparison of the damage characteristic curves from the cyclic and monotonic tests are shown in figure 76 through figure 79. Comparing these figures to the results shown in figure 72 through figure 75, it was seen that the refined method did a much better job in collapsing the damage characteristic curves, suggesting that the mathematical rigor and assumptions made in this refined method were more appropriate for describing the behavior of asphalt concrete materials.
Figure 76. Graph. Damage characteristic comparison, cyclic to monotonic using refined model Control mixture.
Figure 77. Graph. Damage characteristic comparison, cyclic to monotonic using refined model CRTB mixture.
Figure 78. Graph. Damage characteristic comparison, cyclic to monotonic using refined model SBS mixture.
Figure 79. Graph. Damage characteristic comparison, cyclic to monotonic using refined model Terpolymer mixture. 4.9.6. Simplifications to Refined ModelCompared to the rigorous modeling, the refined model was simple to use. However, the method still required the complete calculation of pseudo strain for the entire loading history, e.g., evaluation of the integral in equation 16. This process could have been time consuming, so it was worthwhile to examine simplifications to the calculation. The easiest simplification was referred to as the steady-state assumption because it was rigorously accurate only under steady-state loading. This condition was only approximately true for the cyclic portion of loading and is mathematically shown in equation 157.
Replacing the pseudo strain amplitude in equation 148 with that in equation 157 greatly simplified the calculation and made a spreadsheet solution a possibility. The consequences of this simplification are shown in figure 80 through figure 84. Note that an additional mixture was included in this group of graphs. The test summary for only this mixture is given in table 15; a summary of the other mixtures has already been given in table 12. Due to the change in definition for pseudo stress, the pseudo stiffness is now referred to as C* to indicate that it was computed using the steady-state assumption. Also, recall the definitions of failure in these tests have been provided in subsection 4.9.3.
Figure 80. Graph. Damage characteristic comparison, cyclic to monotonic using refined simplified model Control mixture.
Figure 81. Graph. Damage characteristic comparison, cyclic to monotonic using refined simplified model CRTB mixture.
Figure 82. Graph. Damage characteristic comparison, cyclic to monotonic using
Figure 83. Graph. Damage characteristic comparison, cyclic to monotonic using refined simplified model Terpolymer mixture.
Figure 84. Graph. Damage characteristic comparison, cyclic to monotonic using refined simplified model 9.5-mm Fine mixture. Table 15. Cyclic tests performed for 9.5-mm Fine mixture.
4.10. SummaryVarious interpretations of the work potential/pseudo strain class of continuum damage models have been explored, and a final refined version is suggested. The two methods shown in this report represented a simplification of a more rigorous theory so that it can be easily and accurately applied to cyclic fatigue testing and characterized using cyclic fatigue tests that are performed in the AMPT. The final suggested version is also further simplified so that it can be implemented as a software solution. The earlier versions of this model contained certain shortcomings in the rigor of their derivations. The rigorously accurate VECD model has been used to gain understanding of, and improve upon, these earlier models. The resulting refined formulation unified the results of CS, CX, and monotonic testing and supported earlier findings that the damage characteristic curve was a material property independent of temperature and test type. In addition, this model allowed rapid characterization and/or prediction of the material fatigue response. Coupled with either a structural model or a predictive scheme similar to that used in the NCHRP 1-37A Mechanistic Empirical Pavement Design Guide, this model could also be used to predict the fatigue response of asphalt concrete pavements.(59) This topic is the subject to ongoing efforts by the research team. |
|||||||||||||||||||||||||||||||||||||||||||||||||||||||||||||||||||||||||||||||||||||||||||||||||||||||||||||||||||||||||||||||||||||||||||||||||||||||||||||||||||||||||||||||||||||||||||||||||||||||||||||||||||||||||||||||||||||||||||||||||||||||||||||||||||||||||||||||||||||||||||||||||||||||||||||||||||||||||||||||||||||||||||||||||||||||||||||||||||||||||||||||||||||||||||||||||||||||||||||||||||||||||||||||||||||||||||||||||||||||||||||||||||||||||||||||||||||||||||||||||||||||||||||||||||||||||||||||||||||||||||||||||||||||||||||||||||||||||||||||||||||||||||||||||||||||||||||||||||||||||||||||||||||||||||||||||||||||||||||||||||||||||||||||||||||||||||||||||||||||||||||||||||||||||||||||||||||||||||||||||||||||||||||||||||||||||||||||||||||||||||||||||||||||||||||||||||||||||||||||||||||||||||||||||||||||||||


 (85)
(85) 
 (96)
(96)  (97)
(97)  (99)
(99)  (100)
(100)  (101)
(101) (104)
(104)  (105)
(105)  (106)
(106)  (107)
(107) 
 (108)
(108) 


 (109)
(109)  (113)
(113)  (114)
(114)  (116)
(116) (119)
(119)  (124)
(124)  (125)
(125)  (126)
(126) 

 (128)
(128)  (132)
(132)  (133)
(133) (134)
(134) (135)
(135) 
 (137)
(137) (138)
(138)
 (142)
(142)  (143)
(143)  (147)
(147)  (153)
(153)  , (154)
 (155)
(155)  (156)
(156)