Chapter 3. Specimen Fabrication and Testing Protocols
3.1. Materials
Component materials used in this study were obtained from FHWA's Turner-Fairbank Highway Research Center (TFHRC). Two options for materials acquisition were available to the researchers at the outset of the project. The first option was to acquire already mixed asphalt concrete that was available and used for construction of the ALF testing lanes. The second option was to have the component materials sampled and transported to NCSU for fabrication of appropriate asphalt concrete mixtures. Based on the availability and desired consistency of the materials, the latter option was chosen, and component materials were obtained from TFHRC. Four stockpiles, #68, #78, #10, and Sand (FHWA Designation B-6265, B-6264, B-6306, and B‑6263, respectively), were sampled and transported to NCSU for fabrication. For the ALF lanes, hydrated lime was first mixed with the #10 stockpile before mixing it with the asphalt binder. The decision was made to not use this stockpile for fabrication; instead, hydrated lime was added separately on a specimen by specimen basis at NCSU. In addition to acquiring aggregates, four asphalt binders, PG 70-22 (B-6298), Crumb Rubber Terminal Blend (B-6286), Styrene-Butadiene-Styrene (B-6295), and Ethylene Terpolymer (B-6289), were also acquired.
The aggregate structure for each of the mixtures was constant and was a coarse 12.5-mm nominal maximum size aggregate (NMSA) mixture comprised of 18.0 percent #68 stone, 36.4 percent #78 stone, 17.1 percent #10 stone, 27.5 percent sand, and 1.0 percent lime. For the multiaxial tension work, a slightly modified mixture was used. This mixture contained the same binder and gradation as the Control mixture; however, the #78 aggregate for this mixture was obtained almost 4 years after the original aggregate was obtained. To reflect the later date of aggregate acquisition, this mixture is referred to as Control-2006. The blended gradation is shown in figure 13. Four asphalt binders, three polymer-modified and one unmodified, of similar performance grade were used for this study. Table 1 summarizes the relevant information for each of these binders. The asphalt content for each mixture was set at 5.3 percent by total mixture mass based on the mix design values.
Table 1. Relevant asphalt binder information.
| Binder |
Designation |
PG Grade |
Cont. PG Grade |
| Unmodified |
Control/Control-2006 |
70-22 |
72-23 |
| Crumb Rubber Term. Blend |
CR-TB |
76-28 |
79-28 |
| Styrene-Butadiene-Styrene |
SBS |
70-28 |
74-28 |
| Ethylene Terpolymer |
Terpolymer |
70-28 |
74-31 |
Figure 13. Graph. Mixture gradation chart.
The laboratory materials were similar to those found in the field with the following exceptions:
- Differences between the laboratory air voids and the constructed air voids.
- Differences in internal structures (not quantified) between the compaction techniques used-gyratory in the lab and roller in the field.
- Small differences in the mixture gradations due to construction factors.
The actual field mixture conditions are summarized in table 2 and figure 14.
Table 2. Summary of constructed lanes' air void and asphalt content.
| Mixture |
Laboratory |
Test Lanes |
| Percent Air Voids |
Percent Asphalt1 |
Percent
Air Voids |
Percent Asphalt1 Ignition |
Percent Asphalt1 Nuclear |
| Control |
4.0 |
5.3 |
7.8 |
5.23 |
4.82 |
| CR-TB |
6.8 |
5.48 |
5.09 |
| SBS |
6.0 |
5.28 |
5.05 |
| Terpolymer |
6.5 |
5.52 |
5.25 |
| 1 By percent mass. |
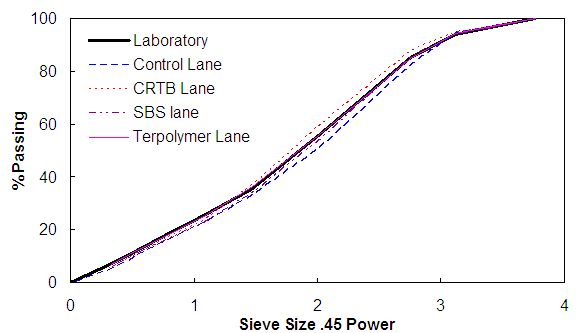
Figure 14. Graph. Comparison of test lane and laboratory gradations.
3.2. Specimen Fabrication
All specimens were compacted by the Superpave Gyratory Compactor to a height of 178 mm and a diameter of 150 mm. To obtain specimens of uniform air void distribution, these samples were cored and cut to a height of 150 mm with a diameter of either 75 mm for tension testing or a diameter of 100 mm for compression testing. Details can be found elsewhere.(19,20)
After obtaining specimens of the appropriate dimensions, air void measurements were taken via the CoreLok method, and specimens were stored until testing. The air voids for all tests in this study were between 3.5 and 4.5 percent. During storage, specimens were sealed in bags and placed in an unlit cabinet to reduce aging effects. Furthermore, no test specimens were stored for longer than 2 weeks before testing.
3.3. Test Setup
A closed-loop servo-hydraulic loading frame was used for all the tests. Depending on the nature of the test, either an 8.9- or a 25-kN load cell was used. An environmental chamber, equipped with liquid nitrogen coolant and a feedback system, was used to control and maintain the test temperature.
Measurements of axial and, in some instances, radial deformations were taken during loading. Axial measurements were taken at 90-degree intervals over the middle 100 mm of the specimen with loose-core linear variable displacement transducers (LVDTs). When taken, radial deformations were measured at 90-degree intervals with spring-loaded LVDTs. These measurements were taken on the central plane of the specimen. Load, crosshead movement, triaxial cell pressure (when appropriate) and deformation data for the specimen were acquired with National Instruments® hardware and collected with LabViewTM software.
Prior to all tension testing, steel end plates were glued to the specimen with Devcon® steel putty. Extreme care was taken to completely clean both the end plates and the specimen ends before each application. It was observed early in the testing that failure to do so could result in the premature failure of the test. To ensure that the specimens were properly aligned, a special gluing jig was employed to ensure that the end plates were parallel, minimizing any eccentricity that might occur during the test. The triaxial tension end-plates had holes drilled specifically so that after the end plate glue had cured, a drill could create another hole through the glue at the center of the bottom end of the specimens to allow them to drain excess pore pressure during testing.
For the uniaxial constant crosshead rate compression tests, a circular hole that was 3 mm in depth and 14 mm in diameter was made at the center of the top surface of the specimen. The top plate had a key with the same dimensions in its center. The key and the hole were used to prevent the specimen from sliding during the test. For the creep and recovery test specimens, an aluminum end plate was used to minimize the creep due to the weight of the end plate. A
0.3048-mm thick rubber membrane with a 100-mm diameter and lubricant were used to avoid the end effect caused by friction between the end plate and the surface of the specimen.
Tests performed under confining pressure were the most difficult to prepare. The preparation protocols for confined tests are similar to those of an unconfined setup, except that before testing the specimen is encased in a latex membrane. To ensure proper drainage during the compression tests, the bottom lubricated membrane was punctured with a hole approximately 25 mm in diameter. This drainage ensured that no excess pore pressure developed during testing.
Following the protocol presented elsewhere, the specimen was encased in a latex membrane after attaching LVDT mounting studs.(42) Early observations showed that extreme care had to be taken when attaching LVDTs and that failure to remove all air pockets between the membrane and specimen, particularly around the LVDT studs, resulted in unusual and inconsistent results. In this study, a hole in the membrane approximately 2.5 mm in diameter was punctured at the center of each LVDT mounting stud. This hole was then stretched around the LVDT studs, and all surrounding air pockets were removed. Studs were mounted and prepared similarly for radial measurements. Mounts were prepared for radial measurements instead of directly measuring the membrane-encased specimen because it was found that deformation of the membrane was significant during pressurization. Finally, after all LVDT mounting brackets were attached, acrylic latex caulk was used to seal the areas around the mounts.
3.4. Test Protocols
The laboratory testing was divided into four phases. The objective of the first phase was to determine the temperature and loading frequency dependence of the four mixtures. Temperature and frequency sweep complex modulus testing, either under confinement or not, were performed during this phase.
The second phase was intended to verify the t-TS principle with growing damage under confinement. This phase was important because the positive verification of the t-TS principle with growing damage under confinement significantly reduced the testing program for MVEPCD model development. Due to the limitation of time and resources, only the constant crosshead rate tests were performed for validation of the t-TS principle.
The third phase of laboratory testing was designed to determine the MVEPCD model coefficients of the mixtures. The testing program required for this phase consisted of the following:
- Constant crosshead rate tests at low temperatures and fast loading rates under both confined and unconfined conditions for the development of the viscoelastic continuum damage model.
- Constant crosshead rate tests at high temperatures with a range of loading rates or creep and recovery tests for the development of the viscoplastic model. The creep and recovery tests required a constant loading time with varying load amplitudes and constant loading amplitude with varying loading times.
The final phase of the experimental program was designed to validate the developed model. In this phase, constant rate tests under conditions not used in model development were used.
The four phases of testing applied both to tension and compression testing. For the tension testing, 75-mm diameter, 150-mm tall specimens were used, whereas 100-mm diameter, 150-mm tall specimens were used for the compression testing.
3.4.1. Complex Modulus Test
The complex modulus test was performed in the load-controlled mode in axial tension-compression (zero-mean deviatoric stress) or in compression only (zero-maximum deviatoric stress) according to American Association of State Highway and Transportation Officials (AASHTO) TP62-03. For the zero-mean deviatoric stress condition, confining pressures of 0, 250, and 500 kPa were tested, whereas the zero-maximum deviatoric stress tests were performed for confining pressures of 0, 140, and 500 kPa. Load levels for these tests were determined by a trial and error process so that the resulting strain amplitudes were between 50 and 70 . Based on the work of other researchers, it was assumed that this criterion ensured an accurate viscoelastic characterization.(7,42) Under both confined and unconfined conditions, tests were performed at five temperatures (-10, 5, 20, 40, and 54 °C) and six frequencies (25, 10, 5, 1, 0.5, and 0.1 Hz) or in compression at four temperatures (-10, 10, 35, and 54 °C) and eight frequencies (25, 10, 5, 1, 0.5, 0.1, 0.05, and 0.01 Hz). . Based on the work of other researchers, it was assumed that this criterion ensured an accurate viscoelastic characterization.(7,42) Under both confined and unconfined conditions, tests were performed at five temperatures (-10, 5, 20, 40, and 54 °C) and six frequencies (25, 10, 5, 1, 0.5, and 0.1 Hz) or in compression at four temperatures (-10, 10, 35, and 54 °C) and eight frequencies (25, 10, 5, 1, 0.5, 0.1, 0.05, and 0.01 Hz).
3.4.2. Constant Crosshead Rate Tests
Constant crosshead rate tests were performed with the application of a constant rate of deformation over the complete loading train. Because each component of the loading train (machine ram, load cell, etc.) deformed slightly, the on-specimen displacement rate or strain rate was not constant.(20) Prior to the confined tension test, a constant confining pressure was applied for 2 hours before testing. This 2-hour period ensured that bulk creep could not affect the analysis. To simplify the discussion of these results for the ready, a test identification (ID) system (e.g., 55-1, 55-2, etc.) has been used to describe the data for the remainder of this report. The first number in the test ID is the test temperature, and the second number indicates the ranking of the strain rate, with 1 being the fastest. For tension tests, the test ID is followed by a "T" (e.g., 55-1-T, 55-2-T).
Tests in tension were performed at three temperatures (5, 25, and 40 °C) and at multiple rates. These tests were used for the following:
- Viscoelastic (Multiaxial viscoelastic continuum damage (MVECD)) damage characterization (5 °C tests).
- Viscoplastic (VP) characterization (40 °C tests).
- MVEPCD model validation.
- t-TS principle with growing damage verification.
Table 3. Controlled crosshead testing matrix for Control-2006 in tension.
| Test ID |
Confining Pressure (kPa) |
Temp. (°C) |
Crosshead Strain Rate |
Purpose |
| 0 |
500 |
| 5-1-T |
X |
X |
5 |
5.50E-05 |
MVECD characterization |
| 5-2-T |
X |
X |
3.00E-05 |
| 5-3-T |
X |
X |
2.20E-05 |
| 5-4-T |
|
X |
2.15E-05 |
| 5-5-T |
|
X |
1.50E-05 |
5-6-T |
X |
|
1.05E-05 |
MVEPCD and
t-TS verification |
25-1-T |
|
X |
25 |
5.00E-04 |
25-2-T |
|
X |
1.50E-03 |
25-3-T |
|
X |
4.50E-03 |
25-4-T |
|
X |
1.35E-02 |
40-1-T |
X |
X |
40 |
3.00E-02 |
40-2-T |
X |
X |
1.00E-02 |
VP
characterization |
40-3-T |
X |
X |
3.00E-03 |
40-4-T |
X |
X |
1.00E-03 |
40-5-T |
X |
X |
3.00E-04 |
Table 3 presents the strain rates calculated from the crosshead displacement rates over the 150‑mm specimen height that were used for each phase. Tension tests were performed at 5, 25, and 40 °C at 0 and 500 kPa.
Tests in compression were performed at 5, 25, 40, and 55 °C at 0 and 500 kPa. For compression modeling purposes, these tests were used for the following:
- Viscoelastic damage characterization (5 °C tests).
- t-TS principle with growing damage verification.
To conserve materials while still covering a wide range of material behavior, it was decided that the best course of action would be to conduct tests at several different combinations of temperatures and rates with one replicate test for each combination. The strain rates used for testing at each temperature were selected so that an overlap would occur in the reduced strain rates between adjacent temperatures. The relevant information for the compression tests is presented in table 4.
Table 4. Controlled crosshead testing matrix for Control in compression.
| Test ID |
Confining Pressure (kPa) |
Temp. (°C) |
Crosshead Strain Rate |
Purpose |
| 0 |
500 |
| 5-1 |
X |
X |
5 |
5.75E-05 |
MVECD characterization |
| 5-2 |
X |
X |
3.83E-05 |
| 5-3 |
X |
X |
1.92E-05 |
| 5-4 |
X |
X |
9.60E-06 |
| 25-1 |
X |
X |
25 |
1.35E-02 |
t-TS verification |
| 25-2 |
X |
X |
4.50E-03 |
| 25-3 |
X |
X |
1.50E-03 |
| 25-4 |
X |
X |
5.00E-04 |
| 40-1 |
X |
X |
40 |
3.01E-02 |
| 40-2 |
X |
X |
1.00E-02 |
| 40-3 |
X |
X |
3.00E-03 |
| 40-4 |
X |
X |
1.00E-03 |
| 55-1 |
X |
X |
55 |
2.99E-02 |
| 55-2 |
X |
X |
1.00E-02 |
| 55-3 |
X |
|
3.00E-03 |
| 55-4 |
X |
|
1.00E-03 |
3.4.3. Repetitive Creep and Recovery Tests
Repetitive creep and recovery tests were conducted in uniaxial and multiaxial compression up to failure at 55 °C. These tests consisted of the repeated application of creep and recovery cycles. For characterization, two different conditions were applied: one with the loading time fixed and the stress magnitude increasing in each cycle (i.e., a variable loading (VL) test) and the other with a fixed-stress level and increasing loading time as the loading cycle increases (i.e., a variable time (VT) test). To gain insight into the material behavior with respect to sequence of loading, a VT test was performed in the reverse order of the characterization VT test (i.e., a reverse VT (RVT)). For model verification, three different conditions were used:
- A test with constant load and constant time (CLT).
- A variable load and variable time test (VLT).
- A VT test that was followed by a flow number test.
A summary of the test methods and the confining pressures used with each is shown in table 5. The following sections provide a brief summary of each test method used.
3.4.3.1. VL Test
The repetitive creep and recovery test with a variable load level was performed for the calibration of the developed viscoplastic model. In this VL test, the loading time remained constant until the end of the test, whereas the load level was varied. One loading block consisted of eight increasing loading pulses. The deviatoric stress of the first loading in the loading group was the same as that of the third loading in the preceding loading group. For testing with an unconfined and confining pressure of 140 kPa, the first deviatoric stress was 137.9 kPa and was stepped by 1.2(n-1) as the number of loads, n, increased, as shown in figure 15. The confined testing began with a deviatoric stress of 300 kPa for the 500 kPa confining pressure test, as shown in figure 16. For both cases, the loading time was set to 0.4 s, and the loading was repeated until the specimens failed.
Table 5. Creep and recovery testing matrix for Control mixture in compression.
| |
Confining Pressure (kPa) |
0 |
140 |
500 |
VT |
X |
X |
X |
RVT |
|
X |
X |
VL |
X |
X |
X |
VLT |
|
X |
X |
CLT |
0.4 s |
|
|
X |
1.6 s |
|
|
X |
6.4 s |
|
|
X |
VT + Flow Number |
|
X |
|
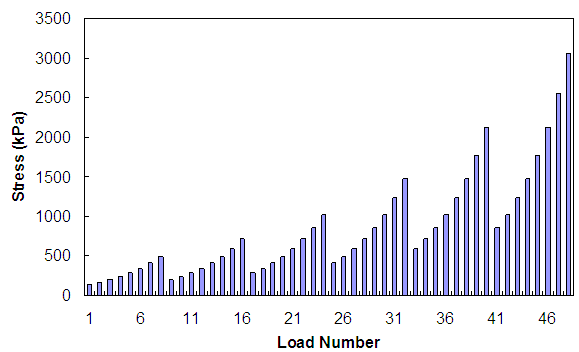
Figure 15. Graph. Stress history of VL testing (unconfined and 140 kPa confinement VL).
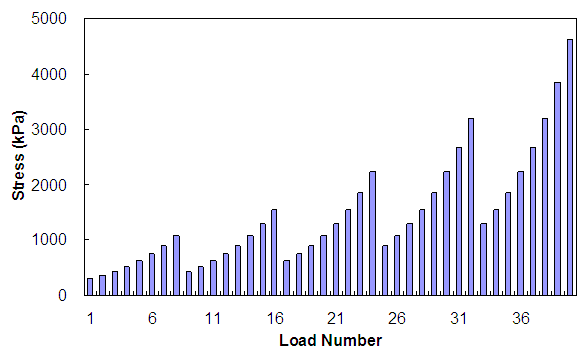
Figure 16. Graph. Stress history of VL testing (500 kPa confinement VL).
3.4.3.2. VT and RVT Test
The repetitive creep and recovery tests with variable loading times were performed to achieve three major goals:
- Identify the effect of loading time (pulse time) on viscoplastic strain development.
- Verify the t-TS principle.
- Characterize the viscoplastic model.
For the VT tests, the level of deviatoric stress remained the same until the end of the test, but the duration of the load was varied. As with the VL testing, these tests consisted of the repeated application of load pulses in groups or blocks. The first loading block started with a 0.05-s loading pulse followed by 200 s of rest. Longer loading pulses with 200 s of rest were applied subsequently until the loading block ended, as shown in table 6. This loading block was repeated depending on the deviatoric stress and confining pressure of the test.
Table 6. Test conditions for the VT and RVT tests.
ConfiningPressure
(kPa) |
DeviatoricStress
(kPa) |
Pulse Time (rest period)
(s, physical time at the testing temperature) |
| 0 |
827 |
0.05 (200) |
0.1 (200) |
0.2
(200) |
0.4
(200) |
1.6
(200) |
6.4
(200) |
- |
| 140 |
552, 827 |
0.05 (200) |
0.1
(200) |
0.2
(200) |
0.4
(200) |
1.6
(200) |
6.4
(200) |
- |
| 0.82 *(40) |
1.63 *(40) |
3.27 *(40) |
6.53 *(40) |
26.12
*(50) |
104.49
*(60) |
- |
| 500 |
1600, 1800, 2000 |
0.05 (200) |
0.1
(200) |
0.25 (200) |
0.4
(200) |
1.6
(200) |
2.0
(200) |
6.4
(200) |
* Physical time at 40 °C, which is equivalent in reduced time to physical time at 55 °C.
- No measurement taken. |
Note from table 6 that at a confining pressure of 140 kPa two different pulse times and rest period histories are given. Tests at this confining pressure were performed for t-TS verification with damage, and the second history was performed at 40 °C for this verification. In RVT testing, the loading conditions were the same as for VT testing except for the sequence of loading, which was exactly opposite to that in the VT tests.
3.4.3.3. CLT Test
CLT testing was conducted to confirm the effects of loading time (or pulse time) on the viscoplastic strain development. During CLT testing, the loading time, rest period, and load level were kept constant. These tests were performed only at the 500 kPa confining pressure, and only a single deviatoric stress level of 1,800 kPa was used. Three different loading times of 0.4, 1.6, and 6.4 s were used.
3.4.3.4. VLT Test
VLT testing incorporated the combined loading histories of the VT and VL testing. The test started with a deviatoric stress of 100 kPa and a loading time of 0.05 s, as shown in figure 17, figure 18, and table 7. After 200 s of rest following the first loading, another loading followed by 200 s of rest using the same deviatoric stress but with an increased loading time, similar to the VT testing. Following the rest period, the deviatoric stress increased to the next stress level, as shown in figure 17 and figure 18. This sequence was repeated until the specimen failed.
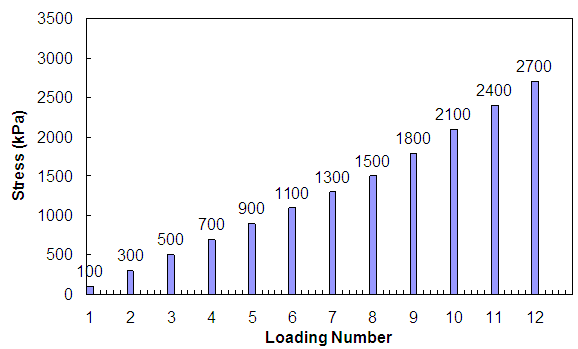
Figure 17. Graph. Stress history of VLT testing (140 kPa confinement).
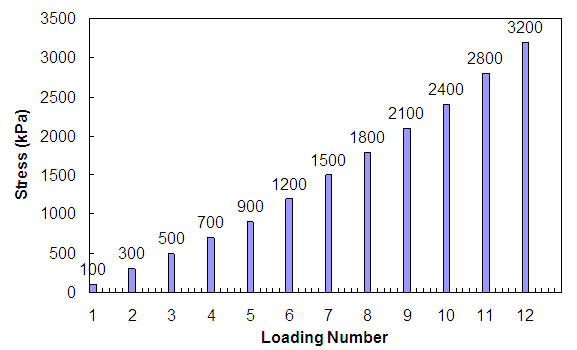
Figure 18. Graph. Stress history of VLT testing (500 kPa confinement).
Table 7. Loading times for VLT test.
| Confining Pressure (kPa) |
Pulse Time (s) |
| 140 |
0.05 |
0.1 |
0.2 |
0.4 |
1.6 |
6.4 |
| 500 |
0.05 |
0.1 |
0.25 |
0.4 |
1.6 |
6.4 |
3.5. Data Analysis
Various data analysis methods were evaluated in this research. The major objective in the data analysis was to determine the MVEPCD model coefficients. The time-temperature shift factors were determined from the frequency and temperature sweep dynamic modulus test. These factors were also used to check if the mixtures exhibited t-TS with growing damage. Dynamic modulus mastercurves were used for the determination of MVECD characteristics.
The viscoelastic model development involved the determination of pseudo strain and the damage parameter, S. The constant crosshead rate monotonic tests at 5 °C were used to develop the damage characteristic curve for each mixture. The viscoplastic model coefficients were determined from either constant crosshead rate tests at high temperatures or creep and recovery tests with varying loading times and stress levels.
The MVEPCD model, developed with the above mentioned testing program, was used to calculate the viscoelastic and viscoplastic strains under random cyclic loading. A comparison of the calculated and the measured strains revealed the accuracy of the MVEPCD model under realistic loading conditions. All of the analysis techniques presented were performed with analysis software developed at NCSU.
|


