U.S. Department of Transportation
Federal Highway Administration
1200 New Jersey Avenue, SE
Washington, DC 20590
202-366-4000
Federal Highway Administration Research and Technology
Coordinating, Developing, and Delivering Highway Transportation Innovations
 |
| This report is an archived publication and may contain dated technical, contact, and link information |
|
Publication Number: FHWA-HRT-08-073 Date: September 2009 |
Chapter 2. Constitutive Modeling with a Multiaxial Viscoelastoplastic Continuum Damage Model2.1. Historical PerspectiveThe foundation for the work presented in this report was laid by researchers at Texas A&M University almost two decades ago.(1) These researchers successfully applied Schapery's nonlinear viscoelastic constitutive theory for materials with distributed damage to describe the behavior of sand asphalt under controlled strain cyclic loading. Later research shows that this theory can also describe the behavior of asphalt concrete under both controlled stress and controlled strain cyclic loading.(2-4) Later research shows that the damage characteristics of a material are independent of the mode of loading and can be determined using simpler tests.(5) Further, verification of the t-TS principle at high levels of damage is an equally significant discovery.(6) These two findings significantly reduce the required testing protocol while simultaneously extending the realm of application for the model. Work by Chehab et al. utilizes Schapery's theory, along with strain decomposition, to account for both viscoelastic and viscoplastic strains. (See references 7 through 11.) The most recent work applies this theory to mixtures tested at the FHWA ALF in Mclean, VA,(12) and successfully demonstrates the application of the modeling principles to both modified and unmodified asphalt concrete mixtures. This work is the basis for the current research. 2.2. Modeling ApproachThe MVEPCD model is a theoretical and phenomenological extension of the uniaxial VEPCD model presented in previous work and briefly reviewed here. These modeling approaches share many of the same principles, such as linear viscoelasticity, elastic-viscoelastic correspondence principle, continuum damage, and strain-hardening plasticity. A complete review of these principles in the uniaxial sense is given elsewhere, and a brief review is given in the following sections.(13) For a more rigorous treatment of the subject, the reader is referred to previous work and to the work of Schapery for linear viscoelasticity and continuum damage mechanics. (See references 1 through 10.) For a detailed review of strain-hardening viscoplasticity, the reader is directed to the work of others.(7,10,14) Linear viscoelastic materials exhibit time- and temperature-dependent properties that make them dependent upon the history of loading, unlike elastic materials. This issue complicates the analysis since many continuum theories have been developed assuming an elastic material. In this report, the elastic-viscoelastic correspondence principle is used so that these elastic theories can be applied to the viscoelastic asphalt concrete mixtures. The correspondence principle uses pseudo strains, a quantity calculated from the actual time-dependent strains, in place of the actual strains. It is a general theory in so much that for purely elastic materials, the pseudo strains may be equal to the physical strains. Many damage theories exist, and in this report Schapery's theory based on energy principles is used. For this theory, consideration is given for both the time-dependent nature of energy availability as well as the time dependence of damage resistance. These arguments are considered within a thermodynamic framework. Finally, strain-hardening plasticity is found to be simple to model and commonly observed viscoplastic phenomenon. A well-known assumption, founded in the theory of plasticity, is that total strain can be decomposed into elastic and plastic strains. Likewise, total strain can be decomposed into elastic strain, plastic strain, and creep strain, according to the theory of viscoplasticity, to account for the rate-dependent plastic strain of materials, as shown equation 1. In some studies that involve such rate-dependent materials, the rate-independent plastic strain and the rate-dependent creep strain are defined as viscoplastic strain because it is difficult to distinguish the plastic deformation from creep deformation. The theoretical background for the viscoplastic strain concept was first discussed by Perzyna, and since then more complicated models have been developed to explain the behavior of a material due to plasticity-creep interaction.(15) Where:
From a similar perspective, Schapery suggests that total strain may be separated into several components, such as elastic, viscoelastic, and viscoplastic strains.(10) For the MVEPCD model, elastic, linear viscoelastic, and strains due to microcracking damage are combined into a single term, and plastic and viscoplastic strains are combined into another, as shown in equation 2.
Where:
2.2.1. Linear ViscoelasticityLinear viscoelastic (LVE) materials exhibit time- and temperature-dependent behavior-the current response is dependent on both the current input and all past input (i.e., the input history). By contrast, the response of an elastic material is only dependent on the current input. Constitutive relationships for LVE materials are typically expressed in the convolution integral form, as follows:
Where: E(t) and D(t) are the relaxation modulus and creep compliance, respectively. In this report, the analytical forms for these functions are given by the common Prony series formulation shown in equation 5 and equation 6. Note that the characterization of LVE behavior is undertaken by performing temperature and frequency sweep tests which are then processed to obtain the coefficients for these functions.(13)
2.2.1.1. Linear Viscoelastic InterconversionThe unit response functions presented in equation 3 and equation 4 are often measured in the frequency domain using the complex modulus test because it is often difficult to obtain measurements in the time domain due to limitations of the testing machine's capacity for testing time. The complex modulus provides the constitutive relationship between the stress and strain amplitudes of a material loaded in a steady-state sinusoidal manner. Then, the storage modulus can be determined from the complex modulus and converted to a time-dependent property, such as E(t) and D(t), according to the theory of linear viscoelasticity. When the storage modulus is expressed in terms of reduced angular frequency,ωR, as shown in equation 7, it can be expressed using the Prony series representation given in equation 8.(16,17)
Where: Ε∞ = Elastic modulus. ωR = Angular frequency (=2πfRΔt). Δt = Time lag between stress and strain. Ei = Modulus of ith Maxwell element (fitting coefficient). ρi = Relaxation time (fitting coefficient). The coefficients determined from this process are then used with equation 5 to find the relaxation modulus. Using the theory of viscoelasticity, the exact relationship between the creep compliance and relaxation modulus is given by equation 9.
If the creep compliance, written in terms of the Prony representation (equation 10), is substituted into equation 9 along with equation 5 and simplified, then the result can be expressed as a linear algebraic system, shown as equation 11. The coefficients {D} are solved by any proper numerical method.
Where:
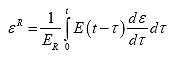
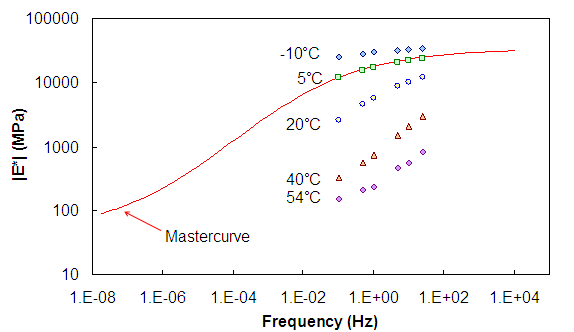
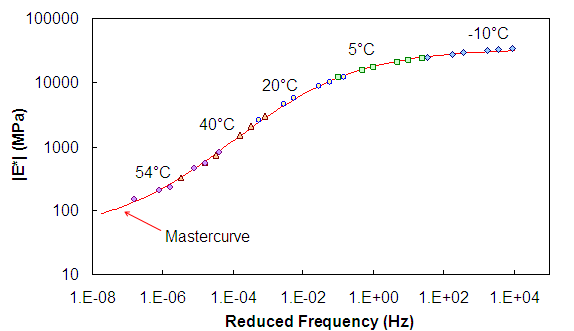
Once the coefficients Dj are determined, they are substituted into equation 10 to find the creep compliance. 2.2.1.2. Linear Viscoelastic Characterization MethodologyNumerous research efforts by the authors have led to a methodology for assessing and analyzing LVE properties through the dynamic modulus. Explicit details of the experimental method are given in subsection 3.4.1; however, it should be known that the test applies cyclic sinusoidal loading at several combinations of frequency and temperature either with or without confining pressure. Load and axial deformations measured at four locations separated by 90-degree intervals are recorded for each combination of frequency and temperature. From these measurements, stresses and strains are calculated based on the specimen area and gauge length of the deformation measurements, respectively. The analysis procedure is the same for both confined and unconfined tests and is given in detail elsewhere.(13,18) Asphalt concrete in the LVE range is known to be thermorheologically simple (TRS) and, as such, the effects of time and temperature can be combined into a joint parameter, reduced time/frequency, through the time-temperature shift factor (aT) using equation 15. In practical terms, this behavior allows for the horizontal shifting of the processed data to form a single curve, the mastercurve, for describing the constitutive behavior of asphalt concrete. The amount of horizontal shift is known as the t-TS shift factor, and the relationship between this factor and temperature is known as the t-TS shift factor function. When combined with the mastercurve, these two functions allow for the prediction of the LVE behavior over a wide range of conditions. The process is shown schematically in figure 1 through figure 3. 2.2.2. Correspondence PrincipleThe damage theory used in this research, which was originally developed for elastic materials, is generalized for viscoelastic materials using the elastic-viscoelastic correspondence principle.(8) In short, this principle states that viscoelastic problems can be solved with elastic solutions when physical strains are replaced by pseudo strains.
Where: ER is a particular reference modulus, typically taken as one. Using pseudo strain in place of physical strain, the uniaxial constitutive relationship presented in equation 3 can be rewritten as follows:
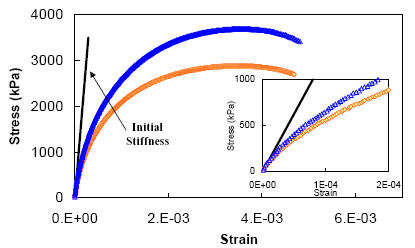
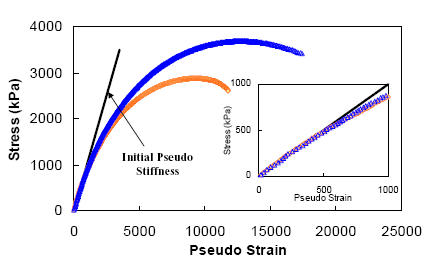
As equation 17 shows, for the uniaxial condition, a form corresponding to that of a linear elastic material (Hooke's Law) is taken when strains are replaced by pseudo strains. Additional theoretical details of this concept can be found elsewhere.(8,19,20) In a practical sense, pseudo strains are simply the LVE stress response to a particular strain input. The most important effect of pseudo strains is seen when plotting with stress, as the time effects are removed from the resulting graph. This property allows the direct quantification of damage independent of any time effects. The results of two typical monotonic tests are presented in figure 4 and figure 5 in both stress strain space and stress-pseudo strain space. The behavior during initial loading is shown as an inset in these figures. In stress-strain space, as seen in figure 4, nonlinearity appears in the initial stage of loading, which might suggest that damage commences from the outset. However, the nonlinearity in this zone is related only to the time effects of the material. When these time effects are removed, as seen in figure 5, it is clear that damage does not commence at the outset of loading and does not begin until the stress level reaches approximately 500 kPa.
Figure 1. Graph. Schematic representation of dynamic modulus shifting process with unshifted data.
Figure 2. Graph. Schematic representation of dynamic modulus shifting process with shifted data.
Figure 3. Graph. Schematic representation of dynamic modulus shifting process with time-temperature shift factor.
Figure 4. Graph. Constant crosshead test results in stress-strain space.
Figure 5. Graph. Constant crosshead test results in stress-pseudo strain space. 2.2.3. Continuum DamageOn the simplest level, continuum damage mechanics considers a damaged body with some stiffness as an undamaged body with reduced stiffness. Continuum damage theories thus attempt to quantify two values: damage and effective stiffness. Further, these theories ignore specific microscale behaviors and instead characterize a material using macroscale observations (i.e., the net effect of microstructural changes on observable properties). The most convenient method to assess the effective stiffness in the macro sense is the instantaneous secant modulus. On the other hand, damage is oftentimes more difficult to quantify and generally relies on macroscale measurements combined with rigorous theoretical considerations. For the model at hand, Schapery's work potential theory, based on thermodynamic principles, is appropriate for the purpose of quantifying damage. Within Schapery's theory, damage is quantified by an internal state variable, S, that accounts for microstructural changes in the material. (See references 8 through 11.) 2.2.4. Viscoelastic Continuum Damage TheoryThe uniaxial viscoelastic continuum damage (UVECD) model combines elements from the preceding sections to arrive at the constitutive relationship. From continuum damage, the stiffness reduction is defined by the pseudo secant modulus (pseudo stiffness). This quantity is typically normalized for specimen-to-specimen variability by the factor I and denoted as C.
The relationship between damage, S, and the normalized pseudo secant modulus, C, is known as the damage characteristic relationship and is a material function independent of loading conditions.(19) With these considerations, the nonlinear constitutive relationships used for this research are given by equation 19 for stresses and equation 20 for strains.
In comparing equation 20 to equation 4, a striking similarity is observed. Equation 4 is the constitutive relationship for linear viscoelasticity with a stress input. The modeling approach uses the given input (σ) to determine the input if no damage has occurred (ΕR) and then utilizes the LVE constitutive relationships to find the response. Equation 20 is solved in this research using the same state variable type of approach used for solving equation 16. These formulations are presented elsewhere.(13) 2.2.4.1. Refinement of Damage Characteristic RelationshipThe work potential theory specifies an internal state variable, S, to quantify damage. This internal state variable quantifies any microstructural changes that result in the observed stiffness reduction. For asphalt concrete in tension, this variable is related primarily to the microcracking phenomenon. This report highlights only components new to this research, as significant theoretical work has been done by others. (See references 2, 7, 20, and 21.) The derivation of the UVECD model begins with an assumption of damage behavior (equation 21) or damage evolution law.
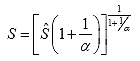
The method used to solve the damage evolution law is a matter of preference; therefore, two different solutions are proposed for solving equation 21. The first transforms the original form of the equation into an integral form, assumes α >> 1, and defines a new parameter,
Where:
The second possible solution shown in equation 24 utilizes the chain rule and makes no assumption regardingα.(3) Both methods have been successfully applied in asphalt concrete research.(7,20,21)
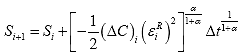
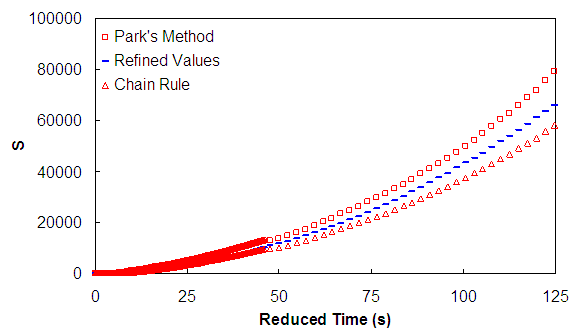
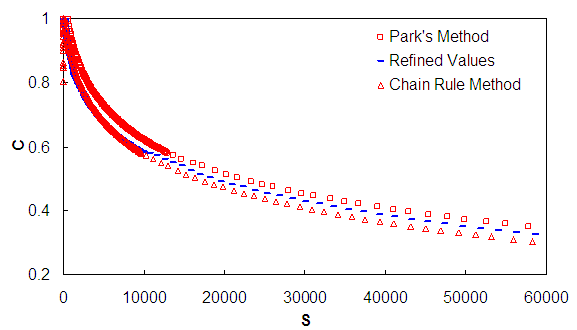
To reconcile the approximations of these methods, an iterative refinement technique is incorporated into this research. In short, this method assumes that the change in material integrity is sufficiently small over some discrete time step. The rate of change of the material integrity with respect to damage is determined at a point near the current value of damage, Si + ∂S, where the extrapolation error is minimized. This refinement process begins with an initial calculation of S by either of the approximate methods, both of which require results from constant crosshead rate tests for the stress-pseudo strain relationship. The initial S values are plotted with the pseudo stiffness values, C, to obtain the damage characteristic curve. This relationship is then fitted to some analytical form, as shown in equation 25.
Returning to equation 21 and noting that the increments of time are generally small, the rate of change in damage can be written as follows:
By substituting this expression into equation 21 and rearranging and writing in the discrete form, equation 27 is established:
For the uniaxial case, the work function, WR, is given by equation 28.(19)
By substituting equation 28 into equation 27 and then simplifying, equation 29 is reached.
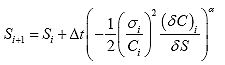
In equation 29, it is assumed that before loading occurs, S and C are zero and 1, respectively. Furthermore, ∂S must be specified and should be significantly less than the change in damage over a time step (typically, 0.1 is used). After calculating the value of damage, Si, and the incremental damage, Si +∂S, at a given time step, the corresponding values of C are found by equation 25. The difference between these values (∂C) is then used to calculate damage at the next time step. The process is repeated until all data points are processed. After completing this first iteration, the new values of S are plotted against the original pseudo stiffness values, and a new analytical relationship is found. The entire process is repeated until the change in successive iterations is small. In this research, eight such iterations were performed, but very little improvement was made after the third or fourth iteration. Figure 6 and figure 7 present the initial S calculated by both approximate techniques along with results from the refinement process. From these figures, it is seen that the refinement process results in S values that fall between the two approximate methods. In these figures, the seed values for the refinement process are obtained by the chain rule method. However, trials show that regardless of the method used to find the seed values, iterations collapse to the same curve. Details regarding this refinement process can be found elsewhere.(22) The final refined values of S are plotted with C to obtain the true damage characteristic curve. As noted before, the benefit of this curve is its mode-of-loading independence; the curve represents a fundamental behavior of the material. From equation 16 and equation 19, if this fundamental relationship is known and the relaxation modulus is given, then the stresses can be directly calculated. Conversely, if this fundamental relationship is known and the creep compliance is given, the strain response can be directly calculated for any stress input using equation 20. Transportation Research Board, National Academy of Science. From Appendixes to National Cooperative Highway Research Program Figure 6. Graph. Comparison of refined and approximate damage calculation techniques.(22)
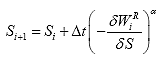
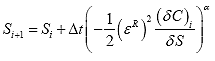
Transportation Research Board, National Academy of Science. From Appendixes to NCHRP Report 547: Figure 7. Graph. Comparison of refined and approximate damage characteristic relationship.(22) 2.2.4.2. Calculation of DamageIn a typical application, the user wants to predict strain from only stress and time using equation 20. However, from the preceding discussion, the user must know the strain to compute
Through equation 30, damage may be incrementally calculated using a technique similar to that used to refine S using only stress and time. 2.2.4.3. Viscoelastic Damage Characterization MethodologyViscoelastic damage characterization refers to the development of the characteristic damage relationship (i.e., the C versus S relationship). Although such characterization can be performed under any loading condition, the simplest method is the constant crosshead rate test.(20) For MVEPCD characterization, both confined and unconfined constant crosshead rate tests are performed. The only requirement for this test is that viscoelastic damage mechanisms dominate the material behavior, such as when the material is at a low temperature or when it is loaded at a very fast rate. In this study, characterization is performed at 5 °C. This temperature is convenient because it allows for moderate strain rates and does not require consideration of any dynamic effects that might be related to extremely high strain rates. In practice, at least three different rates are tested at 5 °C, and if the resulting C versus S curves collapse, it is known that viscoelastic damage mechanisms dominate. The appropriate strain rates are material-dependent. For both VEPCD and MVEPCD characterization, the first step is the calculation of the pseudo strains by equation 16 for the constant rate tests. These values are used along with equation 18 and equation 24 to calculate the initial damage, S, values. The relationship between C and these initial S values are fitted to equation 25 and refined through the aforementioned procedure. The true C versus S relationship is obtained by refitting equation 25 to these refined S values. Results from the tests at different rates are finally averaged to obtain the C versus S relationship for modeling. Typically, each test is sampled at different intervals, which complicates this averaging process. To overcome this difficulty, a common list of C values is compiled, and the corresponding S values are interpolated from the respective test. Averaging can then be easily performed because each test has common C values. 2.3. Multiaxial Viscoelastic Continuum Damage Model2.3.1. Review of Mechanistic PrinciplesThe arguments presented in this section focus on general stress-strain relationships. For notational simplicity, the derivations in this section are given for linear elasticity; however, the arguments remain valid for viscoelastic materials through the elastic-viscoelastic correspondence principle. Much information about this principle has been provided elsewhere; the form given by Schapery is adopted here.(8) For linear elastic materials, the most general constitutive relationship is given by the following:
Cijkl is a fourth-order tensor with 81 constants. Through symmetry arguments, this number is reduced to 21. In matrix form, equation 31 can be viewed as equation 32.
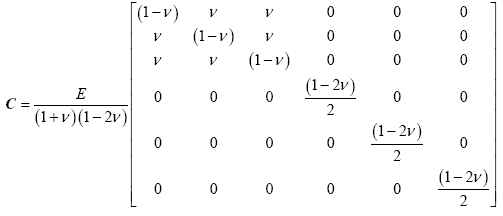
If further assumptions such as orthotropic isotropy, transverse isotropy, and cubical isotropy are assumed, these numbers reduce further. The simplest of these cases is full isotropy, which assumes no directional dependence on the material properties. In this case, two material constants are necessary to describe the constitutive relationship between stress and strain. In general terms, these are called Lame's constants and together define the more commonly recognized fundamental parameters: Poisson's ratio (ν), shear modulus (G), Young's modulus (E), and bulk modulus (K). In terms of compliances, these constants define the shear compliance (J), longitudinal compliance (D), and bulk compliance (B). For a general isotropic case, it can be shown that C11, C22, and C33 are equal; C12, C13, and C23 are equal; and C44, C55, and C66 equal either half of the shear modulus or just the shear modulus depending on the definition used for shear strain. All other terms become zero. Written in full, assuming the shear strain in equation 31 is given as the total angle form, the stiffness matrix for the general isotropic case becomes equation 33.
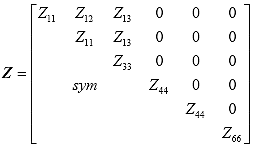
It is seen from equation 31 that the use of equation 33 recovers the common form of Hooke's law.(23) For the problem at hand, however, isotropy is of less concern than transverse isotropy. For this case, it can be shown that the stiffness matrix is given by equation 34. A change in nomenclature from Cijto Zij for general stiffness is made to avoid confusion with later terminology. Also, axis three is assumed to be the axis of symmetry.
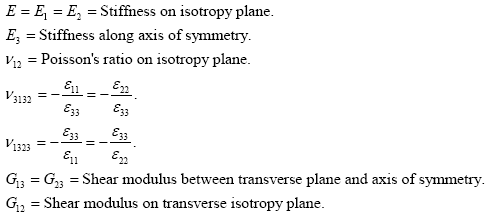
For isotropy, it is seen that the stiffness matrix terms are related to the engineering parameters, Young's modulus and Poisson's ratio. Using similar terminology, transverse isotropy can be considered to have two Young's moduli and three Poisson's ratios. The nomenclature used in this report for these parameters is as follows:
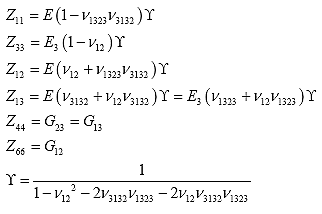
Where: ν1323 is not equal to ν3132; however, for symmetry, ν3132/E3 = ν1323/E. The relationships between Zij and the values defined in equation 35 are as follows:
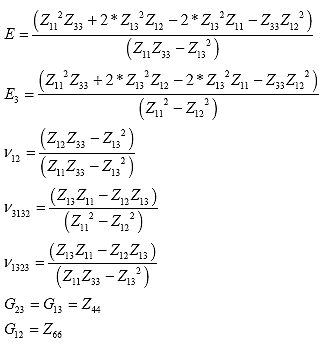
Or, solving for the engineering parameters, the relationships are as follows:
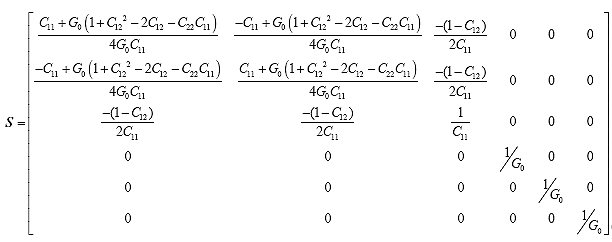
If the compliance matrix with generalized compliances, Sij, is considered, then the resulting relationships are as shown in equation 38.
The compliance matrix is considered here for completeness. Also, the constitutive relationships are more compact and easier to present. 2.3.2. Application of Schapery's Work Potential TheorySchapery's work potential theory model contains parameters that characterize the material integrity with damage growth.(22,11) To clarify the issue of the physical significance of these parameters, a step-by-step process is followed to link the damage functions to the engineering parameters defined in equation 37. In terms of principal strains, the strain energy density function as defined by the terms found in equation 34 is shown in equation 39:
Schapery shows that a more convenient way to express the strain energy density function for transversely isotropic materials is as follows:
Where:
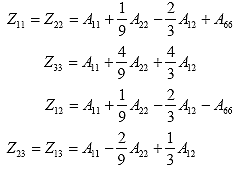
The stiffness values, Aij, in equation 40 can be damage dependent for both the elastic and viscoelastic case. Through an expansion of equation 40, the Aij values correspond to the more recognizable forms in equation 39, thusly:
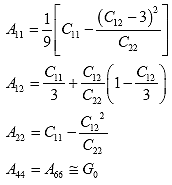
Schapery presents the energy density function as a dual energy density function so that the damage characteristics of a cylindrical body subjected to confining pressure, p, and axial deformation can be more easily characterized. This dual energy density function, as derived by Schapery, is presented in equation 43. To arrive at the relationship presented in equation 43, Schapery assumes that work potential exists and uses the principle of virtual work on a cylindrical specimen subjected to axial loading and confining pressure.(11) Then, he defines a general work potential theory and expands it into a power series, canceling terms to satisfy the initial conditions. The relationships between the Aij terms and the damage-dependent variables, Cij, are presented in equation 44. These relationships must be satisfied for consistency between equation 40 and equation 43. The Cij terms in equation 43 and equation 44 are not the same as those defined in equation 32.
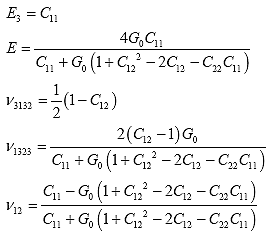
Making substitutions and canceling terms, the engineering parameters in equation 37 are expressed as a function of Cij:
For the compliance matrix, the following can be seen:
It is worthwhile to consider the definitions of stress and strain used in equation 43. Stress is defined as the stress above stress due to pressure (i.e., the deviator stress). According to the definition of strain given in the formulation of the work potential theory presented in the Park dissertation, strain includes all changes in length, even those associated with volume change.(24) In an earlier paper, strain is defined clearly as the change in axial displacement due to load divided by the initial length.(11) To clarify the confusion, virtual work is defined by the following:
In equation 47, Qi are the generalized loads, and qi are the generalized displacements. Whether the strain is defined as the total strain, the evaluated value of equation 47 does not change because the derivative of the strain is independent of these two definitions. Still, the issue does present some consequences in the characterization stage, and so, equation 40 and the relationships in equation 44 will be used to clarify the issue. For a transversely isotropic axial specimen subjected to confining pressure and axial elongation along the axis of symmetry, the following can be shown:
Using the relationships in equation 44, equation 48 can be recast with
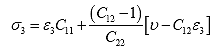
From equation 43, C22 and C12 are related by the following:
If it is assumed that the strain in equation 50 is the total strain,ε3, and that equation 50 is substituted into equation 49 and rearranged, then the following occurs:
Equation 51 is compared to the similar form obtained from equation 43 to achieve equation 52:
Observing that the sign convention for pressure is opposite that of stress above pressure, a comparison of equation 51 and equation 52 indicates that the stress in equation 43 is the deviator stress, and the strain is the total strain. 2.4. Theory of ViscoplasticityThe hot mix asphalt (HMA) mixture is a pavement material that exhibits both viscoelastic and viscoplastic behavior and therefore shows complicated rate-dependent behavior for repetitive traffic loadings. Rutting, one of the major distress types in HMA pavements, is directly related to the rate-dependent permanent deformation behavior of HMA. To predict the rutting performance of HMA, much effort has been made to develop constitutive models capable of describing the rate-dependent permanent strain development in HMA. Some researchers suggest a viscoplastic model with strain-hardening features.(25) As the simplest model, it is also able to describe monotonic behavior in tension, as shown by researchers.(7,10) Others have presented a viscoplastic model for HMA that incorporates Perzyna's flow rule with Desai's yield function.(26,27) While still others suggest a simplified hierarchical single surface (HISS)-Perzyna model that shows a reasonable viscoplastic strain prediction.(28) However, the difficulty in developing a constitutive model for HMA is that hardening rules based on the behavior of metals or soils are not necessarily appropriate to describe both viscoplastic and viscoelastic behaviors of HMA. That is, models developed for metals and soils describe only elastic recovery during unloading, whereas HMA shows nonlinear strain recovery during unloading due to the viscoelastic property of the material. An important observation supporting this phenomenon was made by Saadeh.(29) 2.4.1. Flow RuleThe general concepts behind the constitutive equations for plastic deformation were proposed by Von Mises based on the theory of elasticity.(30) As such, the strain tensor is related to the stress through an elastic potential function, the complementary strain energy, Ue.
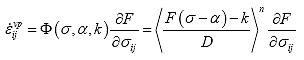
Where: εije= Elastic strain tensor. Ue = Elastic complementary strain energy. σij = Stress tensor. The plasticity theory based on the above flow rule is called the plastic potential theory. When the state of stress reaches the yield criterion, f, plastic strain develops; this mechanism is called plastic flow. To generalize this concept to the plasticity theory, Von Mises proposes that a plastic potential function, g(σij), exists.(30) The plastic strain rate, dεijp, can then be derived from the following flow rule:
Where: dεijp = Plastic strain rate. λ = Positive scalar factor.
In equation 54, λ is a proportional positive scalar factor that can be determined from the yield criterion. For some materials, the plastic potential function, g, and the yield function, f, can be assumed to be the same. These kinds of materials are considered to follow the associative flow rule of plasticity. In other words, the normality rule for this material is associated with the yield criterion, f. However, for other materials, the plastic potential function, g, and the yield function, f, are different. These materials are considered to follow the nonassociative flow rule of plasticity, and the flow rule of the material is derived from a plastic potential, g. In this case, ∂g/ ∂σ ij is not proportional to ∂f/∂σij, and therefore, the plastic strain direction is not normal to the yield surface, f. Basically, the viscoplastic flow rule takes a similar form to the plastic flow rule except that it takes advantage of the over-stress function as a replacement forλ,as shown in equation 55.
Where: Φ = Overstress function. η0 = Viscosity. Figure 8 represents the viscoplastic flow rule using a mechanical analog, which combines a dashpot and a slip element in parallel.(31) In this case, the overstress function in equation 55 is represented by the difference from the applied stress (σ) and the yield stress (G) to the viscosity (η0) in this model.
Figure 8. Illustration. Mechanical analog for the viscoplastic model. 2.4.2. Yield CriterionIn conventional viscoplasticity, the elastic limit of the material can be defined by a surface-in-stress space. Mathematically, the yield surface for general anisotropic materials is expressed as equation 56.
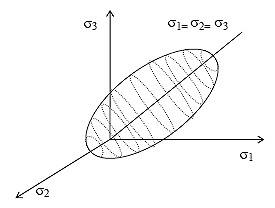
For an isotropic material, the orientation of the principal axis is immaterial, and the principal stresses, σ11, σ22, and σ33, are sufficient to describe the state of stress. The principal stresses form the integrity basis; it is common to use I1, J2, and J3 as the integrity basis. Therefore, the yield function becomes equation 57 for the isotropic material.
Where: I1 = σ 11+ σ 22+σ33 (58)
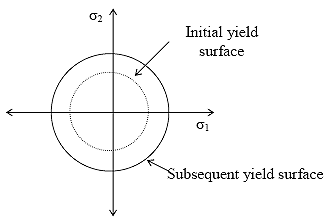
Physically, I1 represents the hydrostatic pressure, and J2 represents the distortional energy in the material; no clear physical meaning is related to J3. Generally, yield criteria can be classified into two subgroups according to their dependence on hydrostatic stress. The isotropic hardening model is the simplest hardening model and is based on the assumption that the yield surface expands isotropically as the plastic strain develops. The typical isotropic hardening model is presented in equation 62 and figure 9. Because the loading surface expands uniformly, it cannot account for the Bauschinger effect observed in various materials, which describes the reduction of compressive yield strength due to a previously applied tensile stress, or vice versa. Therefore, using only the isotropic hardening model frequently limits the characterization of the material behavior when both tension and compression loads are applied.
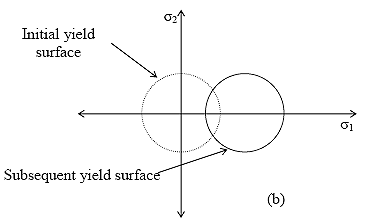
Where: s-ij = Deviatoric stresses. Κ = Isotropic hardening parameter. The kinematic hardening model assumes that during plastic deformation the yield surface translates as a rigid body in the stress space and has the same shape and size as the initial yield surface. The kinematic hardening model is represented by equation 63 and figure 10.
Where: s-ij = Deviatoric stresses. αij = Kinematic hardening parameters (i.e., coordinates of the center of the yield surface in the deviatoric stress space). Equation 64 and equation 65 conceptually represent the classic kinematic hardening rules suggested by Prager, Armstrong-Frederick, and Chaboche, respectively.(32-34) The kinematic hardening rate is a function of the viscoplastic strain rate in these equations, and the hardening rate is always zero when there is no change in viscoplastic strain. Therefore, when a material is subjected to one-directional loading, such as a constant strain-rate test and a repetitive creep and recovery test, the yield stress increases only in the direction of the developed viscoplastic strain and never decreases.
Where: α = Kinematic hardening stress.
Figure 9. Illustration. Isotropic hardening diagram.
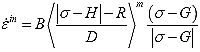
Figure 10. Illustration. Kinematic hardening diagram. 2.5. Viscoplastic Models2.5.1. Simple Strain-Hardening ModelA simple strain-hardening model has been suggested and is shown in equation 66, which assumes that viscosity obeys a power law in viscoplasticity. Researchers have shown that the model is applicable to monotonic behavior in tension.(7,10,25)
Where: g(σ) = Stress function. η = Viscosity. Assuming that η is a power law in the viscoplastic strain, equation 67 becomes the following:
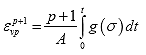
Where: A and p are model coefficients. Rearranging and integrating yield the following:
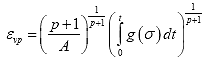
Raising both sides of equation 69 to the 1/(p + 1) power yields the following:
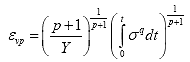
Letting g(σ) = Bσ1q and coupling coefficients A and B into coefficient Y, equation 70 becomes the following:
In the current work, the coefficients, p, q, and Y, are pressure-dependent quantities. Typically, viscoplastic models are characterized using creep and recovery tests. These tests allow relatively easy separation of the viscoplastic and viscoelastic components, as shown in figure 11. However, it is difficult (if not impossible in some machines) to maintain zero load during the recovery period of the creep and recovery test in tension. Therefore, in tension, viscoplastic characterization uses constant rate tests in which the VECD model is used to first predict the viscoelastic strains. These viscoelastic strains are then subtracted from the measured strains to provide the viscoplastic strains that are needed for curve fitting to equation 71. The advantage of this model is that it is easy to implement and does not consume much computational time. This model's ability to predict the HMA behavior under complex loading histories in tension is reported by Underwood et al.(12) However, this model's major weakness is its one-dimensional nature, which is not sufficient to describe the behavior of HMA in pavements. This deficiency is particularly troublesome in compression where the confinement is known to play a major role in permanent deformation behavior of HMA. In the following subsections, more general viscoplastic models are presented.
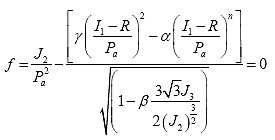
Figure 11. Illustration. Strain decomposition from creep and recovery testing. 2.5.2. HISS-Perzyna ModelThe HISS plasticity model provides a general formulation for the elastoplastic characterization of material behavior. This model, which is potentially able to incorporate isotropic and kinematic hardening and associated and nonassociated plasticity characterizations, can be used to represent a material response based on the continuum plasticity theory. Therefore, the HISS model allows the selection of a more appropriate derivative model for a given material in a specific engineering application. Various well-known plasticity models, such as the Von Mises, Mohr-Coulomb, Drucker-Prager, continuous yielding critical-state, and capped models, can be derived as special cases of the HISS model.(30,32,35) 2.5.2.1. HISS Model Implemented by Delft University of TechnologyEquation 72 represents the HISS criterion.(35) In the criterion, n and α determine the shape of the yield stress in deviatoric-hydrostatic stress space, and γ represents ultimate yield stress. R represents the cohesion of the material and determines the position of the yield stress with respect to the hydrostatic stress axis. Because the yield stress of the HISS criterion varies depending on the first stress invariant, I1, the model exhibits a spindle shape of its yield surface when the shape of the yield surface is assumed to be circular (β =0) in the deviatoric stress space, as shown in figure 12.
Where: γ = Softening parameter. α = Hardening parameter. R = Tensile strength of material when deviatoric stress is zero. n = Parameter determining shape of yield stress. β = Parameter determining shape of yield stress in deviatoric stress space. Pa = Atmosphere pressure.
Figure 12. Illustration. Typical yield surface of HISS model. Researchers using this model suggest an HISS criterion whose parameters are the strain rate-dependent functions for a given HMA mixture.(36) For the characterization, a series of constant strain-rate tests in tension and in compression are performed at several strain rates and temperatures. Then, predictions are made for indirect tension (IDT) specimens subjected to constant strain-rate loading. Because this model requires constant strain-rate testing using several different strain rates and temperatures for characterization, it is important to determine the appropriate range of the strain rates and temperatures to minimize the amount of experimental effort. Although it appears that the model can successfully explain the viscoplastic behavior when subjected to monotonic loading, numerical issues related to parameter determination and prediction still remain. In addition, because the model is characterized using constant strain-rate tests, it cannot fully explain the behavior of HMA under discontinuous loading, such as repetitive creep and recovery loading. 2.5.2.2. HISS Model Implemented by the University of MarylandA viscoplastic model based on the simplified HISS model and using Perzyna's flow rule has also been suggested.(28) Repetitive creep and recovery tests are used for both calibration and prediction, and numerical optimization techniques are adapted for calibrations, unlike Erkens' model.(36) As shown in equation 73, γ, which represents both the ultimate yield stress and the softening of the material, is considered a constant, and R is a function of the viscoplastic strain. In Erkens' study, however, γ and R are functions of the viscoplastic strain rate and temperature.(36)
Where: ζ = Viscoplastic strain trajectory. γ = Softening parameter (constant). α = Hardening parameter (function of viscoplastic strain). R = Tensile strength of material when the deviatoric stress is zero. The main contribution of this research is to apply the t-TS principle to a conventional viscoplastic constitutive model and confirm the validity of the superposition principle. 2.5.3. Unified ModelIn theory of viscoplasticity, the term unified constitutive model refers to models that describe the rate-dependent viscoplastic strain for steel or polymer. However, in other disciplines, the unified constitutive model is used to represent not only viscoplastic strain but also viscoelastic strain. Because this type of model takes a more flexible form of hardening equations than other viscoplastic models, it is worth reviewing the approaches used in the unified model. 2.5.3.1. Linear Kinematic Hardening ModelThe simplest unified constitutive model is the linear kinematic hardening model shown in equation 74 and equation 75.(37) The inelastic strain rate has a linear relationship with the overstress, σ - α. The back stress rate is a function of the back stress in the previous time step and the strain rate in the current time step. Because the model is designed to explain inelastic strain, which is the summation of viscoelastic strain, plastic strain, and viscoplastic strain, the inelastic strain rate can be negative depending on the stress history. The back stress rate,
Where:
α = Back stress. A,B,C = Material constants. 2.5.3.2. Chaboche ModelIn general, the viscoplastic strain of a material obeys a power law, and the hardening of the material can be represented by kinematic and isotropic hardening, as shown in equation 76.
Where: Φ = Magnitude of strain rate. α = Kinematic hardening function (back stress function). k = Isotropic hardening function. The Chaboche model is a viscoplastic model consisting of the above flow rule and hardening function represented by a summation form of back stress.(34) By using decomposed back stress, the model is capable of describing nonlinear hardening with enhanced accuracy for a wider range of viscoplastic strain. Equation 77 shows the back stress function in the Chaboche model; it becomes the Armstrong-Frederick model when n = 1.
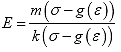
Where: αi--(εvp) = ith back stress, which is a function of the viscoplastic strain. 2.5.3.3. Krempl and Ho ModelsAs an advanced and recent form of the linear kinematic hardening model, some researchers have proposed a viscoplastic model based on the overstress concept.(38,39) The constitutive model also includes a description of the time-dependent recoverable strain of the materials. It begins with the assumption that the coefficients of viscoelasticity are nonlinear functions. Equation 78 is the differential equation used to derive the model.
Where: m(σ-g(ε)) = Positive, bounded and even function. k(σ-g(ε)) = Positive, bounded and even function. g(ε) = Odd function of strain. σ-g(ε) = Overstress. When the functions m(σ - g(ε)) and k(σ - g(ε)) become constant and when g(ε) is linear in ε, equation 78 reduces to the differential equation of a standard linear solid model that represents viscoelastic behavior. The equation can then be expanded to the regular convolution integrals of linear viscoelasticity. Because equation 79 holds true for slow loading, the relationship between the strain rate and stress can be expressed as equation 80, the simplest form of the viscoplastic model.(40)
Where: E = Material elastic modulus.
More complicated model forms are available for describing hardening, dynamic and static softening, and relaxing, as well as negative and positive rate sensitivities. However, as shown in equation 80, Krempl's constitutive models have neither loading or unloading conditions nor the concept of yield stress because they are derived from the concept of general viscoelasticity. Therefore, it is not appropriate to describe only the viscoplastic behavior of HMA, even though the model gives an idea of the rate dependency of viscoplastic properties under unloading conditions. This potential shortcoming is overcome by introducing Macauley's bracket into the second term of equation 80.(41) Because the model is based on equation 80, the back stress function is related to the kinematic stress function, as shown in equation 83.
Where: D = Drag stress. R = Isotropic hardening function. H = Kinematic stress function G = Back stress.
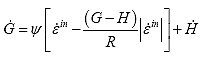
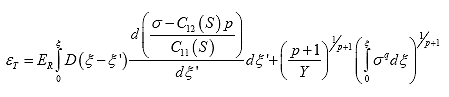
Where: B, m, and ψ = Material constants characterized from experimental results. In contrast to Krempl's model, this model does not allow a change in the material state during unloading because the state of the material is a function only of the viscoplastic strain rate. 2.6. Viscoelastoplastic Continuum Damage ModelIn the previous sections, the viscoelastic and viscoplastic models are developed separately. It has been shown by using a thermodynamic formulation that the total strain is the sum of the viscoelastic and viscoplastic components even in the non-small strain region.(10) Thus, the viscoelastic and viscoplastic models can now be integrated to form the VEPCD model in which the predicted viscoelastic and viscoplastic responses are combined to obtain the total response for a given stress history. The resulting equation from combining equation 20 and equation 71 predicts the total strain history for a general loading history at a reference temperature.
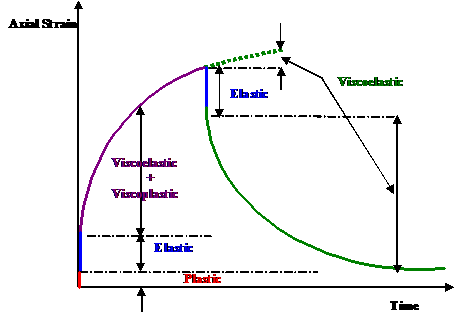
Equation 84 is presented in terms of reduced time, (ζ), due to the verification of the t-TS principle with growing damage. Stated simply, this principle allows the use of time-temperature shift factors determined from LVE characterization to combine the effects of time and temperature at higher levels of damage. This simplification significantly reduces the required testing protocols while simultaneously expanding the realm of application for the model. Section 4.5 and subsection 5.1.3 present the methodology and experimental work used to verify this principle for both tension and compression modes of loading, respectively. |


 (3)
(3)  (4)
(4)  (12)
(12)  (14)
(14)  (16)
(16) 
 (20)
(20)  (21)
(21)  (22)
(22)  (24)
(24)  (27)
(27)  (29)
(29) 
 (30)
(30)  (32)
(32)  (33)
(33) (34)
(34)  (35)
(35) 
 (44)
(44) 
 (47)
(47)  (49)
(49)  (52)
(52)  (54)
(54)  (55)
(55) 
 (61)
(61) 
 (66)
(66)  (67)
(67)  (69)
(69)  (70)
(70)  (71)
(71) 
 (72)
(72) 
 (76)
(76)  (79)
(79)  (81)
(81)  (83)
(83)  (84)
(84)