U.S. Department of Transportation
Federal Highway Administration
1200 New Jersey Avenue, SE
Washington, DC 20590
202-366-4000
Federal Highway Administration Research and Technology
Coordinating, Developing, and Delivering Highway Transportation Innovations
| TECHBRIEF ERRATA |
| This techbrief is an archived publication and may contain dated technical, contact, and link information |
|
| Publication Number: FHWA-HRT-17-118 Date: December 2017 |
Publication Number: FHWA-HRT-17-118 Date: December 2017 |
| Date: | 4-9-2018 |
| Issuing Office: | Federal Highway Administration—Office of Research, Development, and Technology: Office of Infrastructure R&D |
| Address: | Turner-Fairbank Highway Research Center, 6300 Georgetown Pike, McLean, VA 22101 |
| Name of Document: | Fly Ash AEA Adsorption Capacity Estimation as Measured by Fluorescence or Foam Index |
| FHWA Publication No.: | FHWA-HRT-17-118 |
The following changes were made to the document after publication on the Federal Highway Administration website:
| Location | Incorrect Values | Corrected Values |
|---|---|---|
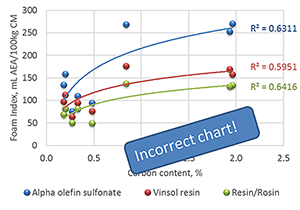
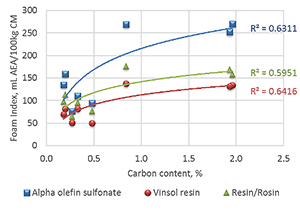
| Page number 9, Figure 12 | 508 text for figure 14 |
Corrected chart. Please find attached spreadsheet with high resolution chart. |
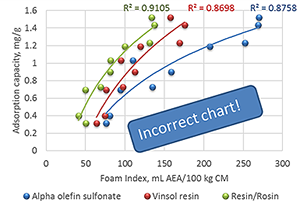
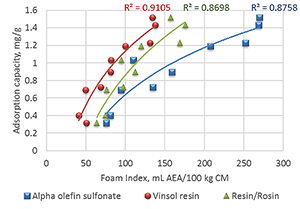
| Page number 10, Figure 14 | Chart color coding was incorrect. |
Corrected chart. Please find attached spreadsheet with high resolution chart. |
| 508 text for figure 12 | Figure 12. Specific Foam Index as a function of the carbon content. A graph showing the relationship between percent of carbon content and the foam index with three different air-entraining agents. The carbon content percent is on the x-axis ranging from 0.0 to 2.5 percent and the foam index values are on the y-axis ranging from 0.0 to 300 milliliters of air-entraining agent per 100 kilograms of cementitious materials. Blue data points and the blue trend line show data for alpha olefin sulfonate. The R2 for these data is defined as 0.6311. Red data points and the red trend line show data for vinsol resin. This R2 is 0.5951. Green data points and the green trend line show resin/rosin data with an R2 of 0.6416. | Figure 12. Specific Foam Index as a function of the carbon content.A graph showing the relationship between percent of carbon content and the foam index with three different air-entraining agents. The carbon content percent is on the x-axis ranging from 0.0 to 2.5 percent and the foam index values are on the y-axis ranging from 0.0 to 300 milliliters of air-entraining agent per 100 kilograms of cementitious materials. Blue squares and the blue trend line show data for alpha olefin sulfonate. The R squared for these data is defined as 0.6311. Red circles and the red trend line show data for vinsol resin. This R squared is 0.6416. Green triangles and the green trend line show resin/rosin data with an R squared of 0.5951. |
| 508 text for figure 14 | Figure 14. Correlations between adsorption capacity and specific index for each AEA used. A graph shows the correlation between foam index values and values obtained from fluorescence. The foam index values are on the x-axis, ranging from 0.0 to 300 milliliters of air-entraining agent per 100 kilograms of cementitious materials. The fluorescence values are on the y-axis, ranging from 0.0 to 1.6 milligrams of surfactant per gram of fly ash. The correlations shown with data points and trend lines are for three different surfactants. Green data points show resin/rosin data with a correlation factor of 0.9105. Red data points show vinsol resin results with a correlation of 0.8698. Blue circles show alpha olefin sulfonate data with a correlation factor of 0.8758. | Figure 14. Correlations between adsorption capacity and specific index for each AEA used. A graph shows the correlation between foam index values and values obtained from fluorescence. The foam index values are on the x-axis, ranging from 0.0 to 300 milliliters of air-entraining agent per 100 kilograms of cementitious materials. The fluorescence values are on the y-axis, ranging from 0.0 to 1.6 milligrams of surfactant per gram of fly ash. The correlations shown with data points and trend lines are for three different surfactants. Green triangles show resin/rosin data with a correlation factor of 0.8698. Red circles show vinsol resin results with a correlation of 0.9105. Blue squares show alpha olefin sulfonate data with a correlation factor of 0.8758. |