U.S. Department of Transportation
Federal Highway Administration
1200 New Jersey Avenue, SE
Washington, DC 20590
202-366-4000
Federal Highway Administration Research and Technology
Coordinating, Developing, and Delivering Highway Transportation Innovations
| TECHBRIEF |
| This techbrief is an archived publication and may contain dated technical, contact, and link information |
| Publication Number: FHWA-HRT-17-118 Date: December 2017 |
Publication Number: FHWA-HRT-17-118 Date: December 2017 |
PDF Version (674 KB)
HTML Version of Errata for FHWA-HRT-17-118
PDF files can be viewed with the Acrobat® Reader®
The following changes were made to the document after publication on the Federal Highway Administration website:
| Location | Corrected Values | URL |
|---|---|---|
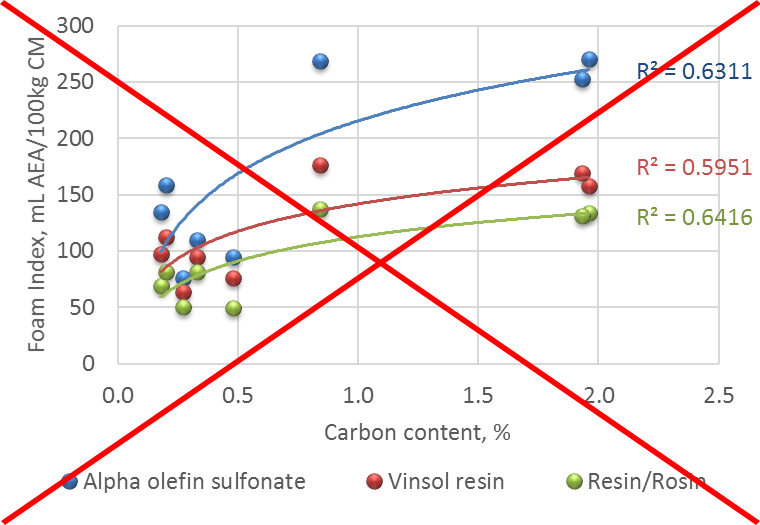
| Page number 9, Figure 12 | Corrected chart. Please find attached spreadsheet with high resolution chart. |
/publications/research/infrastructure/pavements/17118/index.cfm#fig12 |
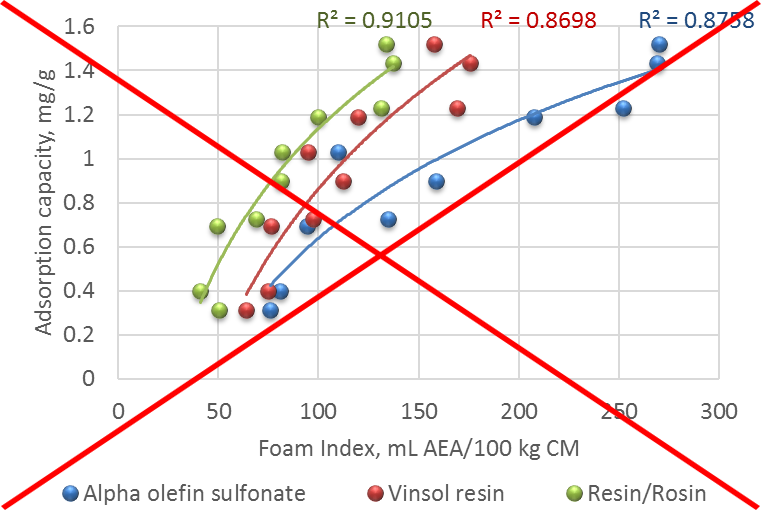
| Page number 10, Figure 14 | Corrected chart. Please find attached spreadsheet with high resolution chart. |
/publications/research/infrastructure/pavements/17118/index.cfm#fig14 |
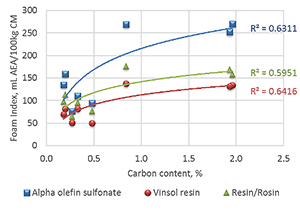
| 508 text for figure 12 | Figure 12. Specific Foam Index as a function of the carbon content. A graph showing the relationship between percent of carbon content and the foam index with three different air-entraining agents. The carbon content percent is on the x-axis ranging from 0.0 to 2.5 percent and the foam index values are on the y-axis ranging from 0.0 to 300 milliliters of air-entraining agent per 100 kilograms of cementitious materials. Blue squares and the blue trend line show data for alpha olefin sulfonate. The R squared for these data is defined as 0.6311. Red circles and the red trend line show data for vinsol resin. This R squared is 0.6416. Green triangles and the green trend line show resin/rosin data with an R squared of 0.5951. | /publications/research/infrastructure/pavements/17118/index.cfm#fig12 |
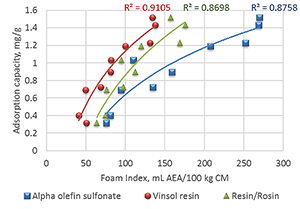
| 508 text for figure 14 | Figure 14. Correlations between adsorption capacity and specific index for each AEA used. A graph shows the correlation between foam index values and values obtained from fluorescence. The foam index values are on the x-axis, ranging from 0.0 to 300 milliliters of air-entraining agent per 100 kilograms of cementitious materials. The fluorescence values are on the y-axis, ranging from 0.0 to 1.6 milligrams of surfactant per gram of fly ash. The correlations shown with data points and trend lines are for three different surfactants. Green triangles show resin/rosin data with a correlation factor of 0.8698. Red circles show vinsol resin results with a correlation of 0.9105. Blue squares show alpha olefin sulfonate data with a correlation factor of 0.8758. | /publications/research/infrastructure/pavements/17118/index.cfm#fig14 |
| FHWA Contact: Ahmad Ardani, HRDI-10, 202–493–3422, ahmad.ardani@dot.gov. |
This TechBrief provides an executive summary of a study that was conducted by the Federal Highway Administration’s concrete laboratory at Turner-Fairbank Highway Research Center (TFHRC) related to the feasibility of using the fluorescence method to accurately and quantitatively determine the adsorption capacity of fly ash.
Figure 1 shows a classic freeze-thaw (F-T) problem at Castlewood Canyon’s structure on State Highway 83 in Colorado.(1) As shown, the F-T action has inflicted significant damage to the arch, causing the concrete to delaminate and exposing the reinforcing steel to corrosion.
One of the best ways to significantly improve concrete’s ability to resist the detrimental impact of F-T action is through deliberately incorporating air-entraining agents (AEAs). When properly incorporated in fresh concrete, air-entraining admixtures stabilize small bubbles of air that are produced in concrete during mixing. These well-distributed stabilized bubbles, in turn, play an essential role in providing long term F-T durability and scaling resistance for concrete infrastructures in cold regions. Depending on concrete’s degree of exposure and the nominal maximum size of the aggregate used, typically 4–8 percent total air is required to combat the F-T durability problems in concrete. Petrographic examination of the cores extracted from the Castlewood Canyon’s bridge showed the total air to be less than 3 percent—way below the limit for Colorado’s climate at this location, explaining the observed deterioration shown in figure 1.
Many State departments of transportation (DOTs) use fly ash as a supplementary cementitious material (SCM) in their concrete mixtures. Typically, 20–30 percent of portland cement mass is substituted by fly ash. Proper incorporation of fly ash in concrete mixtures is environmentally friendly, reduces permeability, improves durability, and overall has the potential of improving fresh and hardened concrete properties. However, one of the drawbacks of using fly ash is its adverse impact on the efficiency of the AEAs. Fly ash with high carbon content or powder-activated carbon (PAC) has the propensity to adsorb the AEAs in fresh concrete, hindering the bubbles’ stabilization and potentially reducing the air content necessary to protect against damages from repeated freeze-thaw cycles. Since the carbon content of fly ashes is not commonly reported, loss on ignition (LOI) is used instead to indicate the potential effect of a fly ash on the AEA efficiency. But, the form of carbon present in the fly ash is the main contributor to AEA entrainment problems and LOI does not distinguish between different carbon forms, so fly ashes with similar LOI can present considerably different adsorption capacities.(2)

Figure 1. Freeze-thaw deterioration at Castlewood Canyon.1
To address the air content issues in binary or ternary mixtures, the practitioners have no other option but to increase the dosage of AEAs to compensate for the adsorption loss. However, determining the proper increase in AEA dosage is not a trivial task. To date, there are no available standardized devices that can be used to properly quantify the effect of fly ash on the AEAs dosages, so that the dosage can be adjusted. One of the widely used empirical methods of assessing the dosage rate of AEAs in mixtures containing fly ash has been the Foam Index (FI) test—a subjective test with a very high degree of variability depending on the operator’s experience and the device used.
A promising method developed by Headwaters Resources, Inc. was evaluated by the Concrete Laboratory at TFHRC for its potential in measuring the adsorption capacity of fly ashes. The method uses fluorescence to indirectly but quantitatively measure fly ash adsorption. A known amount of fly ash is mixed with a solution containing a surrogate surfactant called nonylphenol ethoxylate (or P10 for short). A portion of P10 is adsorbed by the fly ash, and the rest remains in the slurry (P10 solution and fly ash). The amount of P10 that remains in the slurry is detected and quantified by fluorescence.
The primary objectives of this study are to:
Headwaters Resources identified and provided 10 sources of fly ash from 8 different States for this study. Table 1 shows source State, classification, calcium oxide (CaO) content, carbon content, and LOI for these fly ashes.
For the foam index tests, a type I/II portland cement and three different AEAs were used. The AEAs were selected based on previous research by Sutter, Hooton, and Scholorholtz and correspond to the following classification:(2)
Since one of the objectives of the study was to compare the results obtained with the fluorescence method to the results obtained with the foam index, foam index tests were also carried out with the P10 solution.
The adsorption capacity test based on fluorescence was conducted following the procedures developed and provided by Headwaters Resources. Figure 2 shows the components of the device used in this study and also provided by Headwaters Resources.
The test methodology involved mixing distilled water with the P10 solution to create a 150-parts-per-million (ppm) P10 solution. Then, 400 mL of this solution is mixed in a magnetic stirrer for 10 minutes. Next, 20 grams of fly ash are mixed into the solution for 10 more minutes, creating a slurry. During this process, a portion of P10 is adsorbed by the fly ash, and a portion remains in solution. The slurry rests for 2 minutes to allow the suspended fly ash particles to settle, so that a solid-free slurry can be poured into the measuring chamber. An attached fluorescence probe is used to determine the concentration of the surfactant remaining in the slurry. The P10 solution fluoresces when excited by UV light.
| ID |
State |
Class |
CaO |
Carbon |
LOI |
|---|---|---|---|---|---|
| 16045 |
Alabama |
Class C |
22.23 |
0.33 |
0.45 |
| 16046 |
Ohio |
Class F |
3.36 |
1.96 |
2.66 |
| 16047 |
Florida |
Class F |
6.53 |
1.93 |
3.03 |
| 16050 |
Mississippi |
Class F |
19.99 |
0.84 |
1.01 |
| 16052 |
Arkansas |
Class F |
10.99 |
0.18 |
0.28 |
| 16053 |
Texas |
Class C |
23.16 |
0.2 |
0.39 |
| 16054 |
Texas |
Class C |
22.69 |
0.48 |
0.61 |
| 16057 |
North Dakota |
Class F |
13.12 |
0.27 |
0.29 |
| 16058 |
Arkansas |
Class F |
14.9 |
na |
na |
| 16066 |
Georgia |
na |
na |
na |
na |

Figure 2. Components of the device used to measure adsorption capacity.
The fluorescence intensity is proportional to the concentration of P10 in the slurry. Thereby, the measured fluorescence in any concentration is converted to the corresponding concentration in ppm.
The amount of surfactant adsorbed by the carbon present in the fly ash is the difference between the initial surfactant concentration and the remaining surfactant in the slurry. A total of 10 fly ashes were tested using this methodology with 4 replicates for each fly ash.
The FI test is used to estimate the potential effect of a specific fly ash on the air entrainment of concrete prepared with a specific cement and air-entraining admixture combination. The FI test involves the addition of AEAs (drop-by-drop) to a shaken slurry of cement, fly ash, and water and visual observation of the stability of the foam produced. The number of drops of AEA required to form a stable foam on the surface of the slurry depends on the AEA properties and the type of fly ash used. The FI is a measure of the volume of AEA added. The FI is then used as a relative measure of interaction between a specific fly ash and a specific AEA, allowing practitioners to adjust AEA dosages in a concrete mixture to maintain proper air content.
The FI test was conducted following ASTM procedure WK47452.(3) In a tightly sealed container, 8 grams of cement, 2 grams of fly ash, and 25 mL of distilled water are combined and agitated for 30 seconds using a wrist action shaker. Prior to running the FI test, the wrist action shaker was modified by extending the arm to about 6 inches (figure 3), so that the mixing intensity of the shaker would replicate that of vigorous manual hand-shake mixing.

As described above, an AEA is added drop by drop to the mixed slurry sample until a complete layer of foam is formed at the air-slurry interface (also called stable foam). A typical view of three stages of the air-slurry interface (no foam, foam stability in progress, foam stability achieved) is shown in figure 4.
Since the higher the AEA concentration, the faster the foam stability is achieved, the testing procedure uses AEA concentrations of 2, 6, 10, and 15 percent air-entraining admixture by volume as standard solutions, so that the foam stability can be achieved in 12–18 minutes per Note 4 of ASTM WK47572.(3)
The number of drops of AEA required to form this foam layer is converted into solution volume or foam index.
The fluorescence device measures the fluorescence of the surfactant solution before the fly ash has been added and after adsorption has taken place. The initial and final concentrations are then used to calculate the adsorption capacity of fly ash; this is expressed in milligrams of surfactant adsorbed by a gram of fly ash. Figure 5 shows the adsorption capacity results of fly ashes with a typical standard deviation bar based on four replicates in each test. The measured adsorption capacities ranged from 0.26 mg/g to 1.52 mg/g.

Figure 6 shows the coefficient of variation (CoV) based on four replicate tests as a function of the measured adsorption capacity of the fly ashes. Fly ashes with 15 percent. However, two of the fly ashes (20 percent of the tested samples) whose adsorption capacities were below 0.5 mg/g, showed CoVs of 31 percent and 43 percent.

Figure 5. Adsorption capacity results with a typical standard deviation bar based on four replicate tests.

Figure 6. Adsorption capacity results v. coefficient of variation based on four replicate tests for each data point.
This suggests the precision of the device needs improvement to evaluate fly ashes with an adsorption capacity of 0.5 mg/g or below. On the other hand, fly ashes with higher adsorption capacity are the ones that pose the most concern and require AEA dosage to be adjusted for proper air content in concrete. Fly ashes with low adsorption capacity may have lesser air problems with an air-entraining admixture in concrete.
Figure 7 shows that the adsorption capacity of fly ashes is, to some extent, proportional to its carbon content; but the carbon content and the form of available carbon are both important, and these do not necessarily correlate with one another. As a result, carbon content may not be a good indicator of possible air entrainment problems.


Figure 8. Adsorption capacity results v. LOI of fly ashes.
As shown in figure 8, no relation between adsorption capacity and LOI could be found for the fly ashes tested. LOI proved an unreliable way to identify fly ashes that may adversely impact the efficiency of AEA, as previously shown by others.(2)
At present, the fluorescence device can measure the adsorption capacity of fly ash using the P10 as surrogate surfactant. However, once fully evolved, it should have the potential to be used with any available air entraining admixtures in the market.
Figure 9 shows the foam index test results expressed as the specific foam index (SFI) with a typical standard deviation bar based on three replicate tests. SFI is expressed as a dose of an undiluted air-entraining admixture in mL per 100 kg cementitious material, which is relevant to air-entraining admixture dosage rate.
As observed, the SFI can vary significantly for the same fly ash and portland cement, depending on the AEA used. This confirms the need to determine the adsorption capacity of a specific cementitious system with a specific AEA. The SFI may also vary with the fly ash content, but since the test methodology uses a constant fly ash volume, this effect was not evaluated in this study. The most significant absolute SFI variations were obtained using fly ashes 16046, for which the vinsol resin AEA SFI was 134 mL AEA/100Kg and the alpha olefin sulfonate AEA SFI was 270 mL AEA/100Kg; and fly ash 16050, for which the vinsol resin AEA SFI was 138 mL AEA/100Kg and the alpha olefin sulfonate AEA SFI was 269 mL AEA/100Kg.
Since the index test is a visual rating system, the foam stability observed by one operator may not be the same as the one observed by another operator. Figure 10 shows the foam stability observations from two operators using the same samples. The SFI was similar between the two operators except when SFI values were higher than 200 mL per 100 kg of cementitious material as shown in figure 10. Both operators were American Concrete Institute (ACI) certified with more than 5 years of testing experience.
The effect of the AEA concentration was also investigated: using a high-strength solution tends to overestimate the result as compared to a low-strength solution even when the stable foam is formed within the time limit of 12-18 minutes. Figure 11 shows the SFI results tested with 6 and 10 percent strength solutions (medium and high concentrations, respectively) compared to the same fly ashes tested with 2 percent strength solution (low concentration). As seen in the figure, the SFI results between the low and the medium to high strengths are plotted mostly over the line of equality (LOE), indicating a good estimation of AEA adsorption regardless of the solution strength. Looking at the data more closely, the SFI results for the resin/rosin and fatty acid AEA were consistently over the LOE. This suggests a systematic overestimation due to the use of higher strength solutions. So, the effect of the solution’s strength on the SFI seems to be dependent on the AEA used. Therefore, the results of the foam index should be interpreted carefully when obtained using high-strength solutions.

Figure 9. Specific Foam index with a typical standard deviation bar based on three replicate tests.

Figure 10. Specific Foam Index observations between two operators.
The relationship between SFI and the carbon content is relatively good (see figure 12), considering the subjectivity and variability of the foam index test and that the carbon content does not differentiate the form of carbon present. In addition, it is clear that the relationship between SFI and carbon content is different for each AEA.
When using P10 solution, foam stability could not be maintained over 15 seconds indicating that it should not be used for foam index testing. Figure 13 shows a typical foam formation with the P10 surfactant solution.

Figure 11. Specific Foam Index tested with 6 and 10 percent strength solutions, compared to the same fly ashes tested with a 2 percent strength solution.


Figure 13. Typical foam formation of P10 solution.
Although adsorption measured by fluorescence and the foam index are different approaches for evaluating the adsorption capacity of fly ash in the aqueous solution, figure 14 shows good correlations (R2>0.86) between them. Nevertheless, it is clear that the relation between each AEA and adsorption measured by fluorescence is different.
This study examined the feasibility of using fluorescence-based technology to quantitatively measure the adsorption capacity of fly ashes and compared the results obtained by fluorescence with those obtained from the foam index test. The fluorescence-based device quantifies the adsorption capacity of a standard solution (P10) at a specific concentration (150 ppm) by fluorescence. The foam index test relies on the visual evaluation of the operator—i.e., subjective evaluation—to estimate the adsorption capacity of a specific AEA using a specific portland cement and fly ash combination. Although the foam index test evaluates specific combinations of AEA and cementitious materials that are to be used for the job mixture, this still relies on a fixed fly ash content and not necessarily the content proposed in the job mixture design.


Figure 14. Correlations between adsorption capacity and specific foam index for each AEA used.
The observations presented herein reflect the materials used in this research, especially the fly ashes, which had a LOI ranging between 0.29 and 3.03 percent, much lower than the maximum allowed by ASTM C618.(4) The behavior of higher LOI fly ashes may vary from those presented in this study.
Neither carbon content nor LOI seemed to be able to reflect the adsorption behavior of the fly ashes, because some forms of carbon are more prone to adsorbing AEA than others, and neither carbon content or LOI differentiate the form of carbon present. Some observations regarding the use of adsorption measured by fluorescence to measure fly ash adsorption capacity include:
These are some additional observations regarding the foam index test:
The authors would like to acknowledge the provision of materials by Headwaters Resources, Master Builders Solutions, and GCP Applied Technologies.
Certain commercial products are identified in this paper to specify the materials used and procedures employed. In no case does such identification imply endorsement or recommendation by the Federal Highway Administration nor does it indicate that the products are necessarily the best available for the purpose.
Researchers—This study was performed by H. Kim and M. Nicolaescu, SES Group and Associates and A. Ardani, FHWA.
Distribution—This TechBrief is being distributed according to a standard distribution. Direct distribution is being made to the Divisions and Resource Center.
Availability—This TechBrief may be obtained from the FHWA Product Distribution Center by e-mail to report.center@fhwa.dot.gov, by fax to (814) 239–2156, by phone to (814) 239–1160, or online at https://www.fhwa.dot.gov/research.
Key Words—fly ash, adsorption, foam index, fluorescence.
Notice—This document is disseminated under the sponsorship of the U.S. Department of Transportation in the interest of information exchange. The U.S. Government assumes no liability for the use of the information contained in this document. The U.S. Government does not endorse products or manufacturers. Trademarks or manufacturers’ names appear in this report only because they are considered essential to the objective of the document.
Quality Assurance Statement—The Federal Highway Administration (FHWA) provides high-quality information to serve Government, industry, and the public in a manner that promotes public understanding. Standards and policies are used to ensure and maximize the quality, objectivity, utility, and integrity of its information. FHWA periodically reviews quality issues and adjusts its programs and processes to ensure continuous quality improvement.