U.S. Department of Transportation
Federal Highway Administration
1200 New Jersey Avenue, SE
Washington, DC 20590
202-366-4000
Federal Highway Administration Research and Technology
Coordinating, Developing, and Delivering Highway Transportation Innovations
 |
| This report is an archived publication and may contain dated technical, contact, and link information |
|
Publication Number: FHWA-RD-02-029 Date: October 2002 |
|
by Kevin D. Stuart and Walaa S. Mogawer, Ph.D., P.E. |
This report documents the effects of polymer- modified asphalt binders on moisture sensitivity. It is part of a research study titled "Understanding the Performance of Modified Asphalt Binders in Mixtures." Funding for this study is from National Cooperative Highway Research Program (NCHRP) Project 90- 07. The objective of NCHRP 90- 07 is to determine if asphalt binder performance is captured by the Superpave asphalt binder specification developed under the 1987 to 1993 Strategic Highway Research Program, with an emphasis on evaluating the performances of mixtures containing polymer- modified asphalt binders with identical Superpave performance grades but varied chemistries. Asphalt binder tests developed under NCHRP Project 09- 10, titled "Superpave Protocols for Modified Asphalt Binders," are also being evaluated. NCHRP Project 09- 10 was completed in February 2001.
T. Paul Teng, P.E.
Director, Office of Infrastructure
Research and Development
Notice
This document is disseminated under the sponsorship of the
U.S. Department of Transportation in the interest of information exchange. The
U.S. Government assumes no liability for the use of the information contained in this document.
The
U.S. Government does not endorse products or manufacturers. Trademarks or manufacturers' names appear in this report only because they are considered essential to the objective of the document.
Quality Assurance Statement
The Federal Highway Administration (FHWA) provides high-quality information to serve Government, industry, and the public in a manner that promotes public understanding. Standards and policies are used to ensure and maximize the quality, objectivity, utility, and integrity of its information. FHWA periodically reviews quality issues and adjusts its programs and processes to ensure continuous quality improvement.
Technical Report Documentation Page
| 1. Report No. FHWA-RD-02-029 |
2. Government Accession No. | 3 Recipient's Catalog No. | ||
| 4. Title and Subtitle UNDERSTANDING THE PERFORMANCE OF MODIFIED ASPHALT BINDERS IN MIXTURES: EVALUATION OF MOISTURE SENSITIVITY |
5. Report Date
|
|||
| 6. Performing Organization Code | ||||
| 7. Author(s) Kevin D. Stuart, John S. Youtcheff, and Walaa S. Mogawer |
8. Performing Organization Report No.
|
|||
|
9. Performing Organization Name and Address Office of Infrastructure Research and Development |
10. Work Unit No. (TRAIS) |
|||
| 11. Contract or Grant No.
In-House Report |
||||
| 12. Sponsoring Agency Name and Address Office of Infrastructure Research and Development |
13. Type of Report and Period Covered Final Report |
|||
|
14. Sponsoring Agency Code
|
||||
| 15. Supplementary Notes
FHWA Contact: Kevin D. Stuart, HRDI-11 |
||||
| 16. Abstract
The effect of 11 asphalt binders on the moisture sensitivity of a mixture were measured using the Hamburg Wheel- Tracking Device (Hamburg WTD). The Hamburg WTD tests a slab of hot- mix asphalt submerged in hot water by rolling a steel wheel across its surface. The binders consisted of two unmodified asphalt binders, an air- blown asphalt binder, and eight polymer- modified asphalt binders. The continuous high- temperature performance grades (PG's) ranged from 67 to 77. Two aggregates were used: diabase and limestone. The mixture results using the limestone aggegate could not be used to evaluate the asphalt binders because the Hamburg WTD crushed the limestone aggregate. A test temperature of 58 degrees Celcius was chosen for the diabase mixtures based on trial tests using the air- blown and unmodified PG 70- 22 asphalt binders. It was expected that most of the mixtures with polymer- modified asphalt binders would have greater resistance to moisture damage than the mixture with the unmodified PG 70- 22 asphalt binder because they would provide increased adhesion to the aggregate or create a network within the asphalt that was more resistant to water penetration. However, only one polymer- modified asphalt binder provided a greater resistance at a 5- percent level of significance. Some of the asphalt binders provided significantly different resistances to moisture damage that were not related to differences in cohesive strength as measured by the asphalt binder parameter G*/sin(delta) at 58 degrees Celcius. It was concluded that polymer- modified asphalt binders having the same G*/sin(delta) can provide different adhesive strengths and/or different resistances to water penetration. Reasons for these differences need to be determined. |
||||
| 17. Key Words Superpave, moisture susceptibility, moisture damage, Hamburg Wheel- Tracking Device, polymer- modified asphalt binders |
18. Distribution Statement No restrictions. This document is available to the public through the National Technical Information Service, Springfield, Virginia 22161. |
|||
|
19. Security Classification Unclassified |
20. Security Classification Unclassified |
21. No. of Pages 17 |
22. Price | |
| Form DOT F 1700.7 | Reproduction of completed page authorized |
SI* (Modern Metric) Conversion Factors
Section
4. Conclusions Provided by the Diabase Mixture at 58°C
LIST OF FIGURES
Figure No.
2. Rut depth vs. wheel passes from the Hamburg WTD at 58°C
3. Wheel passes from the Hamburg WTD at 58°C and a 5.0- mm rut depth vs. G*/sind at 58°C
4. Wheel passes from the Hamburg WTD at 58°C and a 5.0- mm rut depth vs. high- temperature PG
5. Wheel passes from the Hamburg WTD at 58°C and a 10.0- mm rut depth vs. G*/sind at 58°C
6. Wheel passes from the Hamburg WTD at 58°C and a 10.0- mm rut depth vs. high- temperature PG
LIST OF TABLES
Table No.
3. Hamburg WTD results at 58°C
4. Hamburg WTD results at 58°C vs. base asphalt binder
PERSONNEL
Kevin D. Stuart and John S. Youtcheff, FHWA, Turner- Fairbank Highway Research Center, 6300 Georgetown Pike, McLean, VA 22101- 2296
Walaa S. Mogawer, Civil and Environmental Engineering Department, University of Massachusetts Dartmouth, North Dartmouth, MA 02747
Naga Shashidhar, Susan Needham, Scott Parobeck, and Frank Davis, SaLUT, Turner- Fairbank Highway Research Center, 6300 Georgetown Pike, McLean, VA 22101- 2296
Aroon Shenoy, Senior Research Fellow, FHWA, Turner- Fairbank Highway Research Center, 6300 Georgetown Pike, McLean, VA 22101- 2296
Evaluation of Moisture Sensitivity
1. Objective and Background
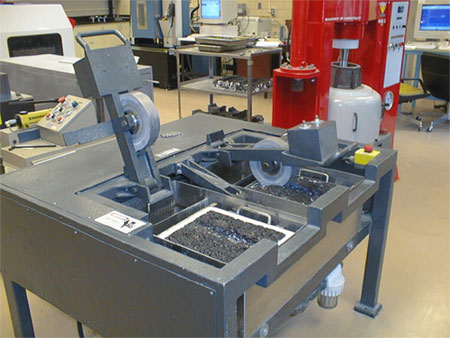
The objective of this study was to determine the effects of 11 asphalt binders on the moisture sensitivity of a mixture using the Hamburg Wheel- Tracking Device (Hamburg WTD). The Hamburg WTD tests a slab of hot- mix asphalt submerged in hot water by rolling a steel wheel across its surface.The slabs tested in this study had a length of 320 mm, a width of 260 mm, and a thickness of 80 mm. Thicknesses up to 120 mm can be tested, and the thickness should be at least three times the nominal maximum aggregate size. The device tests two slabs simultaneously using two reciprocating solid steel wheels, each having a width of 47 mm. The applied load is 685 N and the average speed is 1.1 km/h. The rut depth in each slab is measured continuously over a length of 200 mm by a linear variable differential transformer. This rut depth does not include any upward heaving outside the wheelpath. After each user- specified increment of wheel passes is applied, the device stores the maximum rut depth along the 200- mm wheelpath relative to a rut depth of zero for the first wheel pass. It does not calculate an average rut depth. The standard maximum number of wheel passes is 20,000. This requires approximately 6.5 h. The pass/fail rut depth is 10 mm at 20,000 passes. Additional information on the Hamburg WTD is given elsewhere.(1- 4) The device is shown in figure 1.
Each mixture was short- term oven aged (STOA) for 2 h at 135°C prior to compaction. Two hours of STOA was found to provide the average amount of short- term aging that occurred in pavements constructed with similar materials for the Federal Highway Administration (FHWA) Superpave Validation Study.(1) Two slabs were compacted per mixture at a 7.0 ±0.5- percent air- void level. Each pair was tested at the same time. This meant that the test temperatures for the two slabs were identical, and each mixture was tested by both wheels, which accounts for any small differences in loading provided by them. The number of replicate specimens was insufficient for randomizing the tests. All slabs were tested 48 h after compaction.
The customary test temperature for the Hamburg WTD is 50°C, which was developed in Europe for a climate close to a Superpave high- temperature performance grade (PG) of 58. The test temperature used in this study was based on the amount of damage provided by trial tests using the air- blown asphalt and the unmodified PG 70- 22 asphalt control binder. Temperatures from 50 to 64°C were evaluated, and a temperature of 58°C seemed to be the optimum temperature for determining the effects of the asphalt binders on moisture resistance. This was based on both the rate of failure and the amount of visually stripped aggregate. At 58°C, the mixture with the PG 70- 22 asphalt binder reached a rut depth of 10 mm at 10,860 wheel passes, while the mixture with the air- blown asphalt reached a rut depth of 10 mm at 19,550 wheel passes. Both mixtures failed the test, although the mixture with the air- blown asphalt was close to passing. Because water is used to control the test temperature, no slabs could be tested under dry conditions at 58°C.
The data from the Hamburg WTD at 58°C using a diabase aggregate are shown in figure 2. This aggregate without an antistripping additive is moderately susceptible to moisture damage in Superpave high- temperature climates around 58 to 64°C. Tables 1 and 2 provide the average wheel passes based on rut depths of 5.0 and 10.0 mm, respectively. The replicate data are given in table 3. Normally, the rut depths at 20,000 wheel passes are evaluated. In this study, most of the mixtures performed poorly. Hence, most of the tests had to be terminated before 20,000 wheel passes.
Tables 1 and 2 show that at both rut depths, the mixture with Elvaloy had the highest resistance to deformation based on the average number of wheel passes, followed by the mixtures with the air- blown asphalt and chemically modified crumb rubber asphalt (CMCRA). Two additional slabs using CMCRA were tested because of the high variability of the data. Table 3 shows that the wheel passes from the additional tests were also highly variable. Additional slabs were also tested using the unmodified PG 70- 22 asphalt binder to confirm its performance relative to the polymer- modified asphalt binders. The wheel passes for this mixture were highly variable.
The statistical rankings in tables 1 and 2 show that many of the mixtures performed similarly. For example, table 2 shows that 7 of the 11 mixtures fell into group D. Because of the empirical nature of the Hamburg WTD, it is recommended that the performances of mixtures within a group not be compared. Performances within a group are not significantly different at a 5- percent level of significance. However, the wheel passes in table 3 have unequal variances and display some heteroscedasticity, which would cause the statistical analysis to rank the poorest performing mixtures the same. Heteroscedasticity is when the standard deviation for each set of data tends to increase with an increase in the average. Heteroscedasticity violates an assumption of the statistical analyses, although the rankings in tables 1 and 2 agree with a qualitative assessment of the data in that many of the mixtures performed the same: very poorly. Table 2 shows that only the mixture with Elvaloy passed the 10- mm rut depth criterion, which is applied at 20,000 wheel passes. Table 3 shows that only 7 of 28 individual slabs passed this criterion. Additional analyses of the data, for example, on the data for group D mixtures in table 2, were not necessary.
The statistical ranking in table 2 shows that only the mixture with Elvaloy performed better than the PG 70- 22 control mixtureat a 5- percent level of significance. This ranking was confirmed by comparing the averages using t- tests. As previously stated, the test temperature of 58°C was chosen based on trial tests using the air- blown and unmodified PG 70- 22 asphalt binders. It was expected that the polymer- modified asphalt binders would provide significantly better performances than the PG 70- 22 asphalt binder. Figure 2 and table 2 show that this was not the case.
Besides aggregate structure, the rut depths from the Hamburg WTD are affected by: (1) the internal cohesive strength of the asphalt binder, and (2) the adhesive strength between the asphalt binder and the aggregates. Asphalt binders with higher G*/sind's should have higher cohesive strengths. Therefore, the relatively high G*/sind at 58°C for Elvaloy, being 639 Pa, could be partially responsible for its good performance. However, table 2 shows that the mixtures with ethylene vinyl acetate (EVA) and EVA Grafted had the highest G*/sind's, but these two asphalt binders did not prevent moisture damage. G*/sind's at a frequency of 0.125 rad/s were used in this comparison because this frequency accounts for the slow speed of the Hamburg WTD.(1) Asphalt binder properties given in the tables were measured in accordance with Association of State Highway and Transportation Officials (AASHTO) Test Method TP5.(5)
Figures 3 through 6 show that the relationships between wheel passes and asphalt binder properties were poor, although the r2 for figure 4 depends on whether or not the data point for ESI is considered an outlier. All four figures show that the various resistances to moisture damage provided by the asphalt binders were not simply related to differences in cohesive strength as measured by G*/sind. A good correlation between moisture damage and G*/sind would not be expected if the asphalt binders provide different adhesive strengths to the aggregate. Adhesive characteristics are not evaluated by the Superpave asphalt binder specification. Furthermore, asphalt binder films can be weakened internally due to the penetration of water, and the amount of weakening may vary with the type of asphalt binder and type of modification. The high variability of the wheel passes for some of the mixtures could be another reason why the correlations are poor, although the data in table 2 and figure 5 clearly show that some mixtures performed significantly better than other mixtures, and these differences cannot be explained by G*/sind. G*/sind's at other frequencies were also evaluated, but the use of a different frequency did not improve the correlation between wheel passes and G*/sind.
The r2's for figures 5 and 6 are lower than for figures 3 and 4 because the wheel passes for some of the mixtures have spread further apart at a rut depth of 10 mm compared to 5.0 mm. Note that the scale for the y- axis goes to 20,000 wheel passes in figures 3 and 4 and to 40,000 wheel passes in figures 5 and 6. The r2's in figures 3 and 4 are based on a power model of the form y = axb because this model provided higher r2's than untransformed linear regressions. Most relationships between high- temperature asphalt binder and asphalt mixture performance properties are curvilinear, although the power model did not significantly increase the r2's for the data shown in figures 5 and 6.
Table 4 gives mixture performance vs. the percentage of base asphalt binder used when formulating the polymer- modified asphalt binders. The hypothesis evaluated was that a higher percentage of the stiffer PG 67- 28 asphalt binder would provide more resistance to moisture damage. The data for Elvaloy and CMCRA show that this was not true. Elvaloy performed better than CMCRA even though the base asphalt binder for CMCRA was 100- percent PG 67- 28, compared to 50 percent for Elvaloy. No overall trend was provided by the data.
Tests were performed at 58°C using a limestone aggregate with Elvaloy, ethylene styrene interpolymer (ESI), and the unmodified PG 70- 22 asphalt binder. These asphalt binders were chosen because their wheel passes were significantly different at a rut depth of 10.0 mm using the diabase aggregate. Reportedly, the limestone aggregate is not susceptible to moisture damage. Even so, all three mixtures failed rapidly. The pass/fail rut depth of 10 mm was exceeded in less than 4,000 wheel passes and binder type had no effect on performance. In all cases, the Hamburg WTD crushed the limestone aggregate. To determine whether the test could be performed at a lower temperature, the mixture with the PG 70- 22 asphalt binder was retested at 46°C. The rut depth was 8.0 mm at 20,000 passes. No stripping was observed and it appeared that some of the aggregate was crushed. Therefore, no further tests were performed using the limestone aggregate.
4. Conclusions Provided by the Diabase Mixture at 58°C
Figure 1. Hamburg WTD without water.
Table 1. Hamburg WTD results with the
materials listed from highest to
lowest resistance to moisture damage based on a rut depth of 5.0 mm.
| Asphalt Binder or Mixture Designation |
Asphalt Binder Property After Rolling Thin- Film Oven Aging |
Wheel Passes at 58°C and a Rut Depth of 5.0 mm |
Ranking for Wheel Passes |
|||
|---|---|---|---|---|---|---|
| High-
Temp PG (°C) |
G*/sind, 0.125 rad/s at 58°C (Pa) |
|||||
| Elvaloy | 77 | 639 | 15,800 | A | ||
| Air Blown | 74 | 387 | 10,150 | A | B | |
| CMCRA | 76 | 482 | 9,420 | B | ||
| EVA | 75 | 751 | 6,180 | B | C | |
| SBS Linear Grafted | 72 | 297 | 5,600 | B | C | |
| PG 70- 221 | 71 | 213 | 5,020 | C | ||
| EVA Grafted | 74 | 727 | 4,660 | B | C | |
| SBS Radial Grafted | 71 | 249 | 4,290 | B | C | |
| SBS Linear | 72 | 248 | 2,520 | C | ||
| ESI | 76 | 321 | 2,380 | C | ||
| PG 64- 28 | 67 | 114 | 1,250 | C | ||
1PG 70- 22 does not fall into group B because the additional specimens tested for this mixture provided more confidence in the average value.
Table 2. Hamburg WTD results with the
materials listed from highest to
lowest resistance to moisture damage based on a rut depth of 10.0 mm.1
| Asphalt Binder or Mixture Designation |
Asphalt Binder Property After Rolling Thin- Film Oven Aging | Wheel Passes at 58°C and a Rut Depth of 10.0 mm |
Ranking for Wheel Passes |
||||
|---|---|---|---|---|---|---|---|
| High-
Temp PG (°C) |
G*/sind, 0.125 rad/s at 58°C (Pa) |
||||||
| Elvaloy | 77 | 639 | 30,950 | A | |||
| Air Blown | 74 | 387 | 19,550 | B | |||
| CMCRA | 76 | 482 | 17,900 | B | |||
| PG 70- 22 | 71 | 213 | 14,990 | B | C | ||
| SBS Linear Grafted | 72 | 297 | 10,380 | B | C | D | |
| EVA | 75 | 751 | 8,750 | C | D | ||
| SBS Radial Grafted | 71 | 249 | 8,740 | C | D | ||
| SBS Linear | 72 | 248 | 6,400 | D | |||
| EVA Grafted | 74 | 727 | 6,120 | D | |||
| ESI | 76 | 321 | 5,260 | D | |||
| PG 64- 28 | 67 | 114 | 4,070 | D | |||
1The averages in tables 1 and 2 may be slightly different from those shown in figure 2. Tables 1 and 2 give the wheel passes at average rut depths of 5.0 and 10.0 mm, respectively, while figure 2 shows the average rut depth for a given number of wheel passes. For example, the data used to generate figure 2 showed that a 10.0- mm average rut depth was obtained at 10,690 wheel passes using the SBS Linear Grafted asphalt binder. At 10,690 wheel passes, the rut depth in one slab was 8.3 mm while the rut depth in the other slab was 11.7 mm. Table 2 shows that the average wheel passes based on a rut depth of 10.0 mm in each slab was 10,380. Table 3 shows that the test had applied 9,075 wheel passes when the rut depth in one slab reached 10.0 mm, while the other slab needed 11,680 wheel passes to reach a 10.0- mm rut depth.
Table 3. Hamburg WTD results at 58°C.
| Asphalt Binder or Mixture Designation |
Wheel Passes at a Rut Depth of 5.0 mm |
Wheel Passes at a Rut Depth of 10.0 mm |
||||||
|---|---|---|---|---|---|---|---|---|
| Slab 1 | Slab 2 | s | CV | Slab 1 | Slab 2 | s | CV | |
| Elvaloy | 14,200 | 17,400 | 2,300 | 15 | 27,000 | 34,900 | 5,600 | 18 |
| Air Blown | 7,400 | 12,900 | 3,900 | 38 | 21,440 | 17,660 | 2,700 | 14 |
| CMCRA | 14,600 | 5,100 | 5,400 | 57 | 24,000 | 12,700 | 5,600 | 31 |
| CMCRA (repeat) | 13,500 | 4,480 | 21,300 | 13,600 | ||||
| PG 70- 221 | 3,390 | 4,200 | 2,450 | 49 | 8,010 | 13,705 | 6,450 | 43 |
| PG 70- 22 (repeat)1 | 2,270 | 7,280 | 9,895 | 24,000 | ||||
| PG 70- 22 (repeat)1 | 8,700 | 4,300 | 21,700 | 12,650 | ||||
| SBS Linear Grafted | 7,130 | 4,065 | 2,200 | 39 | 11,680 | 9,075 | 1,800 | 17 |
| EVA | 7,615 | 4,750 | 2,000 | 32 | 6,890 | 10,610 | 2,600 | 30 |
| SBS Radial Grafted | 5,400 | 3,175 | 1,600 | 37 | 11,155 | 6,325 | 3,400 | 39 |
| SBS Linear | 3,115 | 1,925 | 840 | 33 | 5,340 | 7,450 | 1,500 | 23 |
| EVA Grafted | 4,600 | 4,720 | 85 | 2 | 5,700 | 6,550 | 600 | 10 |
| ESI | 2,460 | 2,300 | 110 | 5 | 5,795 | 4,730 | 750 | 14 |
| PG 64- 28 | 1,260 | 1,245 | 11 | 1 | 3,795 | 4,340 | 390 | 10 |
1The wheel passes for this mixture were tested for outliers using Dixon- Thompson and Chauvenet's statistical methods. No value can be considered an outlier.
s= Standard deviation of wheel passes; variance = s2.
CV = Coefficient of variation, percent = (s ÷ average)*100.
Table 4. Hamburg WTD results at 58°C vs. base asphalt binder.
| Asphalt Mixture |
Base Asphalt Binder | Wheel Passes at a Rut Depth of 10.0 mm |
Ranking for Wheel Passes |
|||
|---|---|---|---|---|---|---|
| Percent PG 54- 33 |
Percent PG 67- 28 |
|||||
| Elvaloy | 50 | 50 | 30,950 | A | ||
| CMCRA | 0 | 100 | 17,900 | B | ||
| SBS Linear Grafted | 59 | 41 | 10,380 | C | ||
| EVA | 100 | 0 | 8,750 | C | ||
| SBS Radial Grafted | 59 | 41 | 8,740 | C | ||
| SBS Linear | 59 | 41 | 6,400 | C | ||
| EVA Grafted | 100 | 0 | 6,120 | C | ||
| ESI | 100 | 0 | 5,260 | C | ||