U.S. Department of Transportation
Federal Highway Administration
1200 New Jersey Avenue, SE
Washington, DC 20590
202-366-4000
Federal Highway Administration Research and Technology
Coordinating, Developing, and Delivering Highway Transportation Innovations
 |
| This report is an archived publication and may contain dated technical, contact, and link information |
|
Publication Number: FHWA-RD-02-042 Date: October 2000 |
6. Cumulative Permanent Shear Strain
Cumulative permanent shear strain was measured at 7.0-percent air voids, 50°C, and 5,000 cycles. The applied shear stress was 69 ±5 kPa. The loading time was 0.1 s and the rest time was 0.6 s. Three replicate specimens were tested per mixture. Cumulative permanent shear strain is generally a better measure of rutting resistance compared to G* and G*/sind because it accounts for changes in the amount of damage from cycle to cycle. Lower cumulative permanent shear strains indicate more resistance to rutting.
The average data for all asphalt binders and mixtures are given in table 9. Rankings for the 11 asphalt mixtures are given in table 10. CMCRA fell into three groups: A, B, and C. Six of the 11 mixtures fell into group C. Six mixtures also fell into group D. This means that even though some of the mixtures had significantly different cumulative permanent shear strains, the range in the strains is relatively low compared to the variability of the strains from replicate specimen to replicate specimen. Table 10 also shows that grafting did not improve the rutting resistance of EVA, and its effect on SBS was not significant.
The replicate strains are given in table 11. The coefficients of variation range from 8.2 to 24.1 percent. Coefficients around 20 percent and lower are generally desirable for asphalt mixture tests. The data indicate that studies on the SST should be done to determine if testing four or five replicate specimens decreases the range in the coefficient of variation.
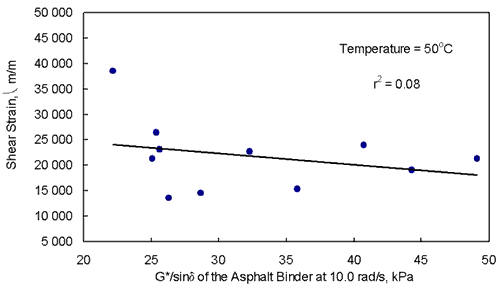
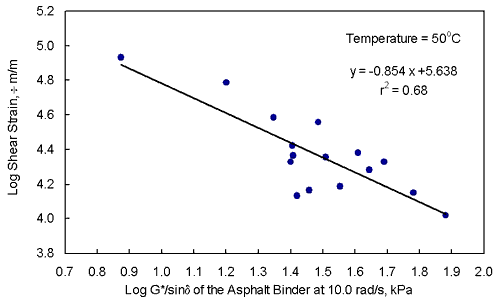
Figure 11 shows that there was no correlation between the cumulative permanent shear strains and the G*/sind's of the asphalt binders at 50°C and 10.0 rad/s. The r2 was 0.08. The r2 using the data from all 16 materials was 0.43, which is also poor.A log-log transformation increased the r2 to 0.68. As shown by figure 12, the log-log relationship provided a trend of decreasing cumulative permanent shear strain with increasing G*/sind.
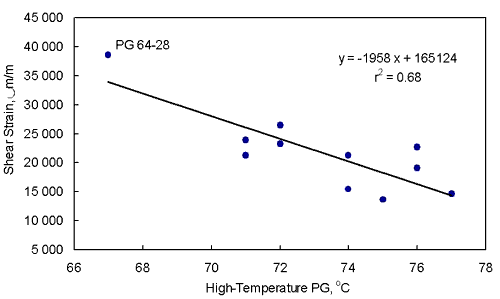
The high-temperature PG's provided relationships as good or better than those provided by G*/sind at 50°C, even though the PG's were 17 to 27°C higher than the SST test temperature of 50°C. The r2 was 0.68 for the 11 materials. The data are shown in figure 13. However, the data for the PG 64-28 materials might have inflated the r2. Without this data point, the r2 was only 0.39.
The r2 between high-temperature PG and cumulative permanent shear strain for all 16 materials was 0.69 using no transformation and 0.76 using a log-log transformation. The latter relationship, given in figure 14, shows that there is a trend of decreasing cumulative permanent shear strain with increasing G*/sind. Based on this relationship, an increase of one high-temperature PG, from 70 to 76, would decrease the cumulative permanent shear strain from 28 750 to 18 100 mm/m at 50°C, which is a 37-percent reduction.
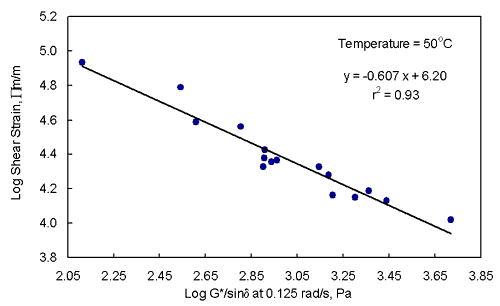
The time-temperature superposition principle indicates that data taken at high temperatures and short loading times can be used to calculate data at lower temperatures and longer loading times. This principle and the higher r2's provided by the high-temperature PG's compared to G*/sind at 50°C and 10 rad/s indicate that G*/sind's at a frequency lower than 10.0 rad/s should correlate better with cumulative permanent shear strain. G*/sind's for the 16 materials at 50°C and 10.0, 2.0, and 0.125 rad/s are given in table 12. The latter two frequencies were chosen because the G*/sind's of the five asphalt binders used in the Superpave Validation Study were measured at these frequencies. For the 11 materials, frequencies of 10.0, 2.0, and 0.125 rad/s provided r2's of 0.06, 0.55, and 0.89, respectively, using log-log transformations. For the 16 materials, frequencies of 10.0, 2.0, and 0.125 rad/s provided r2's of 0.68, 0.83, and 0.93, respectively, using log-log transformations. The relationships using 0.125 rad/s are shown in figures 15 and 16. To avoid having a negative log G*/sind, the unit for G*/sind in these two figures was changed from kPa to Pa.
Table 2. Descriptions of the asphalt binders.
| Name of Asphalt | Percent Polymer | PG of Base Asphalt | Description Provided by the Source | Trade Name | Source |
|---|---|---|---|---|---|
| Unmodified Asphalts |
0 | Not Applicable | PG 52-34, PG 64-28, PG 70-22 | Not Applicable | Citgo Asphalt Refining Co. |
| Air-Blown Asphalt |
0 | 52-34 | Air-Blown Asphalt Without Catalyst | Not Applicable | Trumbull and Owens Corning |
| Elvaloy | 2.2 | 50% 52-34 50% 64-28 |
Ethylene Terpolymer | Elvaloy | DuPont |
| SBS Linear | 3.75 | 58.9% 52-34 41.1% 64-28 |
Styrene-Butadiene-Styrene | Dexco Vector 2518 |
TexPar Labs and Johns Manville |
| SBS Linear Grafted | 3.75 | 58.9% 52-34 41.1% 64-28 |
Styrene-Butadiene-Styrene and 0.05% Additive |
Dexco Vector 2518 |
TexPar Labs and Johns Manville |
| SBS Radial Grafted | 3.25 | 58.9% 52-34 41.1% 64-28 |
Styrene-Butadiene-Styrene and 0.05% Additive |
Shell 1184 | TexPar Labs and Johns Manville |
| EVA | 5.5 | 52-34 | Ethylene Vinyl Acetate | Exxon Polybilt 152 |
TexPar Labs and Johns Manville |
| EVA Grafted |
5.5 | 52-34 | Ethylene Vinyl Acetate and 1.35% Additive |
Exxon Polybilt 152 |
TexPar Labs and Johns Manville |
| ESI | 5.0 | 52-34 | Ethylene Styrene Interpolymer | ESI | Dow and PRI |
| CMCRA | 5.0 | 64-28 | Chemically Modified Crumb Rubber Asphalt |
CMCRA | FHWA |
Table 3. Performance grade (PG) for each asphalt binder.
| Trade Name: | PG 52 Unmodified | PG 64 Unmodified | PG 70 Unmodified | Air-Blown Asphalt | Elvaloy | EVA | EVA Grafted |
|---|---|---|---|---|---|---|---|
| PG: | 52-28 | 64-28 | 70-28 | 70-28 | 76-28 | 70-28 | 70-28 |
| Continuous PG:1 | 54-33 | 67-28 | 71-28 | 74-28 | 76-31 | 70-31 | 73-31 |
| PG From the Supplier: | 52-34 | 64-28 | 70-22 | 73-28 | 74-29 | 73-31 | 75-31 |
| Original Asphalt Binder | |||||||
| Temperature at a G*/sind of 1.00 kPa and 10 rad/s, C | 55 | 67 | 73 | 74 | 76 | 70 | 76 |
| RTFO Residue | |||||||
| Temperature at a G*/sind of 2.20 kPa and 10 rad/s, C | 54 | 67 | 71 | 74 | 77 | 75 | 74 |
| RTFO/PAV Residue | |||||||
| Temperature at a G*sind of 5000 kPa and 10 rad/s, C | 8.1 | 20 | 24 | 21 | 14 | 13 | 14 |
| BBR Temperature at a Creep Stiffness of 300 MPa and 60 s, C + 10°C | -33 | -28 | -28 | -29 | -31 | -31 | -32 |
| BBR Temperature at an m-value of 0.30 and 60 s, C + 10°C | -36 | -30 | -29 | -28 | -33 | -31 | -31 |
| Critical Cracking Temperature From the BBR and Direct Tension, C | -35 | -28 | -27 | -28 | -34 | -31 | -33 |
1The low-temperature continuous PG is the PG provided by the BBR.
Table 3. Performance grade (PG) for each asphalt binder (continued).
| Trade Name: | SBS Linear | SBS Linear Grafted | SBS Radial Grafted | ESI | CMCRA |
| PG: | 70-28 | 70-28 | 70-28 | 76-28 | 76-28 |
|---|---|---|---|---|---|
| Continuous PG:1 | 72-31 | 72-33 | 71-32 | 76-31 | 76-29 |
| PG from the Supplier: | 72-28 | 74-29 | 73-28 | Unknown | 76-28 |
| Original Asphalt Binder | |||||
| Temperature at a G*/sind of 1.00 kPa and 10 rad/s, C | 75 | 75 | 74 | 77 | 76 |
| RTFO Residue | |||||
| Temperature at a G*/sind of 2.20 kPa and 10 rad/s, C | 72 | 72 | 71 | 76 | 76 |
| RTFO/PAV Residue | |||||
| Temperature at a G*sind of 5000 kPa and 10 rad/s, C | 18 | 15 | 16 | 9.2 | 18 |
| BBR Temperature at a Creep Stiffness of 300 MPa and 60 s, C + 10°C | -32 | -33 | -32 | -31 | -29 |
| BBR Temperature at an m-value of 0.30 and 60 s, C + 10°C | -31 | -34 | -32 | -31 | -29 |
| Critical Cracking Temperature From the BBR and Direct Tension, C | -33 | -34 | -34 | -29 | -29 |
1The low-temperature continuous PG is the PG provided by the BBR.
Table 4. Aggregate properties for the diabase.
| Aggregate Gradations, Percent Passing: | |||||
|---|---|---|---|---|---|
| Sieve Size (mm) |
61% No. 68 Diabase | 30% No. 10 Diabase | 8% Natural Sand | 1% Hydrated Lime | Blend |
| 25.0 |
100.0 | 100.0 | |||
| 19.0 |
97.9 | 98.7 | |||
| 12.5 |
60.7 | 76.0 | |||
| 9.5 | 37.7 | 100.0 | 100.0 | 62.0 | |
| 4.75 | 9.2 | 99.2 | 95.8 | 44.0 | |
| 2.36 | 2.2 | 75.6 | 88.2 | 32.1 | |
| 1.18 | 1.7 | 52.5 | 74.8 | 23.8 | |
| 0.600 | 1.4 | 37.8 | 46.0 | 16.9 | |
| 0.300 | 1.3 | 27.9 | 14.1 | 11.3 | |
| 0.150 | 1.1 | 19.6 | 4.8 | 7.9 | |
| 0.075 | 0.9 | 12.5 | 2.9 | 100.0 | 5.5 |
| Specific Gravities and Percent Absorption: |
|||||
| Bulk Dry |
2.943 | 2.914 | 2.565 | 2.892 | |
| Bulk SSD |
2.962 | 2.945 | 2.601 | 2.916 | |
| Apparent | 2.999 |
3.007 | 2.659 | 2.262 | 2.961 |
| % Abs | 0.6 |
1.1 | 1.4 | 0.8 | |
| Flat and Elongated Particles at a 3-to-1 Length-to-Thickness Ratio, Percent by Mass: |
|||||
21 |
NA | NA | |||
| Los Angeles Abrasion, Percent Loss by Mass: |
|||||
| 14 | NA | NA | |||
| Fine Aggregate Angularity: | |||||
| NA | 49 | 45 | |||
Bulk Dry = Bulk Dry Specific Gravity
Bulk SSD = Bulk Saturated-Surface Dry Specific Gravity
Apparent = Apparent Specific Gravity
% Abs = Percent Water Absorption
NA = Not Applicable
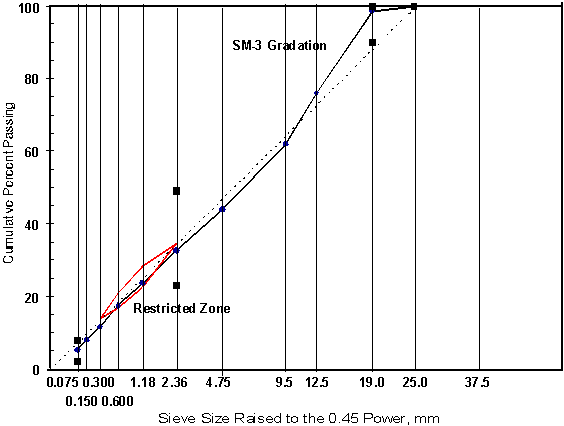
Figure 2. Aggregate gradation.
Table 5. Volumetric properties of the mixture.
| Mixture Property | Diabase Mixture Without Hydrated Lime | Specification |
|---|---|---|
| Asphalt Binder Content |
||
| Total Asphalt Binder Content, Percent by Mixture Mass | 4.85 | |
| Effective Asphalt Binder Content, Percent by Mixture Mass | 4.15 | |
| Asphalt Binder Absorption, Percent by Mixture Mass | 0.7 | |
| Effective Asphalt Binder Content, Percent by Total Volume | 10.8 | |
| Voids Analyses |
||
| Maximum Specific Gravity of the Mixture | 2.702 | |
| Effective Specific Gravity of the Aggregate | 2.948 | |
| Total Air Voids, Percent by Volume | 3.2 | 4.0 |
| Voids in the Mineral Aggregate (VMA), Percent by Total Volume | 14.0 | Minimum of 13.0 |
| Voids Filled With Asphalt (VFA), Percent by Total Volume | 77 | 65 to 78 |
| Dust Content |
||
| Dust Content, Percent Finer Than 75 m by Aggregate Mass | 5.5 | |
| Dust-to-Binder Ratios |
||
| Dust by Aggregate Mass to Total Binder Content by Mixture Mass | 1.1 | |
| Dust by Aggregate Mass to Effective Binder Content by Mixture Mass | 1.3 | 0.6 to 1.6 |
| Dust by Mixture Mass to Effective Binder Content by Mixture Mass | 1.2 | |
| Dust by Volume to Effective Binder Content by Volume | 0.42 | |
Table 6. G*/sind's
of all binders and mixtures with the
materials listed from the highest to lowest mixture G*/sind.
| Asphalt Binder or Mixture Designation | Binder | Mixture | ||
|---|---|---|---|---|
| High Temp. PG | G*/sind, 50°C (kPa) | G*/sind, 50°C (MPa) | G*,50°C (MPa) | |
| 10.0 rad/s | 10.0 rad/s | 10.0 Hz | 10.0 Hz | |
| Novophalt (Validation Study) | 77 | 60.2 | 101.5 | 84.5 |
| Styrelf (Validation Study) | 88 | 76.0 | 98.1 | 78.5 |
| EVA Grafted | 74 | 35.8 | 87.0 | 74.5 |
| Air-Blown | 74 | 49.1 | 85.8 | 75.8 |
| PG 70-22 | 71 | 40.7 | 83.9 | 78.9 |
| EVA | 75 | 26.3 | 83.9 | 72.0 |
| ESI | 76 | 32.3 | 75.1 | 65.9 |
| CMCRA | 76 | 44.3 | 71.6 | 61.5 |
| SBS Radial Grafted | 71 | 25.1 | 55.1 | 50.1 |
| AC-20 (Validation Study) | 70 | 30.7 | 50.5 | 46.7 |
| SBS Linear Grafted | 72 | 25.6 | 47.8 | 43.9 |
| SBS Linear | 72 | 25.4 | 47.8 | 43.7 |
| Elvaloy | 77 | 28.7 | 46.4 | 39.7 |
| PG 64-28 | 67 | 22.2 | 43.8 | 41.0 |
| AC-10 (Validation Study) | 65 | 15.9 | 29.1 | 26.9 |
| AC-5 (Validation Study) | 59 | 7.5 | 19.9 | 17.6 |
| Unmodified Asphalt Binders Only | ||||
| PG 70-22 | 71 | 40.7 | 83.9 | 78.9 |
| AC-20 (Validation Study) | 70 | 30.7 | 50.5 | 46.7 |
| PG 64-28 | 67 | 22.2 | 43.8 | 41.1 |
| AC-10 (Validation Study) | 65 | 15.9 | 29.1 | 26.9 |
| AC-5 (Validation Study) | 59 | 7.5 | 19.9 | 17.6 |
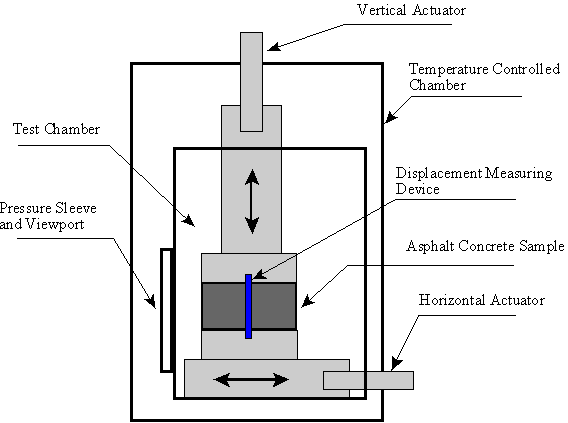
Figure 3. Diagram of SST chamber.
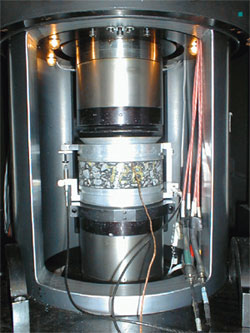
Figure 4. Superpave Shear Tester.
Table 7. G*/sind's
of the 11 binders and mixtures with the
materials listed from the highest to lowest mixture G*/sind.
| Asphalt Binder or Mixture Designation | Binder | Mixture | ||||||||
|---|---|---|---|---|---|---|---|---|---|---|
| High Temp. PG | G*/sind 50°C (kPa) | G*/sind at 50°C (MPa) | ||||||||
| 10.0 rad/s | 10.0 rad/s | 10.0 Hz | ||||||||
| EVA Grafted | 74 | 35.8 | 87.0 | A | ||||||
| Air-Blown | 74 | 49.1 | 85.8 | A | ||||||
| PG 70-22 | 71 | 40.7 | 83.9 | A | ||||||
| EVA | 75 | 26.3 | 83.9 | A | ||||||
| ESI | 76 | 32.3 | 75.1 | B | ||||||
| CMCRA | 76 | 44.3 | 71.6 | B | ||||||
| SBS Radial Grafted | 71 | 25.1 | 55.1 | C | ||||||
| SBS Linear Grafted | 72 | 25.6 | 47.8 | C | D | |||||
| SBS Linear | 72 | 25.4 | 47.8 | C | D | |||||
| Elvaloy | 77 | 28.7 | 46.4 | D | ||||||
| PG 64-28 | 67 | 22.2 | 43.8 | D | ||||||
| 10.0 rad/s | 2.0 rad/s | 2.0 Hz | ||||||||
| EVA Grafted | 74 | 14.3 | 41.1 | A | ||||||
| EVA | 75 | 12.1 | 39.3 | A | B | |||||
| Air-Blown | 74 | 14.2 | 38.6 | A | B | |||||
| CMCRA | 76 | 13.9 | 37.8 | B | ||||||
| ESI | 76 | 8.9 | 34.5 | C | ||||||
| PG 70-22 | 71 | 10.2 | 29.9 | D | ||||||
| Elvaloy | 77 | 10.0 | 25.5 | E | ||||||
| SBS Radial Grafted | 71 | 7.6 | 24.9 | E | F | |||||
| SBS Linear Grafted | 72 | 8.0 | 21.1 | F | G | |||||
| PG 64-28 | 67 | 5.4 | 20.5 | G | ||||||
| SBS Linear | 72 | 7.7 | 20.4 | G | ||||||
Table 8. Replicate data for G*/sind at 50oC.
| Asphalt Binder or Mixture Designation | Specimen No. 1 | Specimen No. 2 | Specimen No. 3 | Average (MPa) | CV1(percent) |
| Frequency = 10.0 Hz | |||||
|---|---|---|---|---|---|
| EVA Grafted | 85.5 | 91.3 | 84.3 | 87.0 | 4.3 |
| Air-Blown | 86.0 | 86.8 | 84.5 | 85.8 | 1.4 |
| PG 70-22 | 94.0 | 69.9 | 87.8 | 83.9 | 14.9 |
| EVA | 79.5 | 84.3 | 87.8 | 83.9 | 5.0 |
| ESI | 80.3 | 71.1 | 73.8 | 75.1 | 6.3 |
| CMCRA | 68.1 | 76.9 | 69.7 | 71.6 | 6.5 |
| SBS Radial Grafted | 56.6 | 55.3 | 53.5 | 55.1 | 2.8 |
| SBS Linear Grafted | 41.8 | 51.4 | 50.3 | 47.8 | 11.0 |
| SBS Linear | 48.7 | 45.8 | 48.8 | 47.8 | 3.6 |
| Elvaloy | 45.0 | 46.1 | 48.1 | 46.4 | 3.4 |
| PG 64-28 | 41.5 | 41.8 | 48.2 | 43.8 | 8.6 |
| Frequency = 2.0 Hz | |||||
| EVA Grafted | 41.1 | 42.7 | 39.4 | 41.1 | 4.0 |
| EVA | 38.1 | 39.2 | 40.7 | 39.3 | 3.3 |
| Air-Blown | 38.5 | 39.6 | 37.8 | 38.6 | 2.3 |
| CMCRA | 35.9 | 40.7 | 37.3 | 37.8 | 6.5 |
| ESI | 37.0 | 33.1 | 33.4 | 34.5 | 6.3 |
| PG 70-22 | 28.1 | 27.6 | 34.1 | 29.9 | 12.1 |
| Elvaloy | 24.1 | 26.1 | 26.3 | 25.5 | 4.8 |
| SBS Radial Grafted | 25.2 | 25.5 | 24.1 | 24.9 | 3.0 |
| SBS Linear Grafted | 20.5 | 23.0 | 22.8 | 21.1 | 6.3 |
| PG 64-28 | 20.9 | 19.5 | 21.0 | 20.5 | 4.1 |
| SBS Linear | 20.9 | 19.7 | 20.7 | 20.4 | 3.1 |
1CV = Coefficient of Variation, percent = (standard deviation ÷ average)*100.
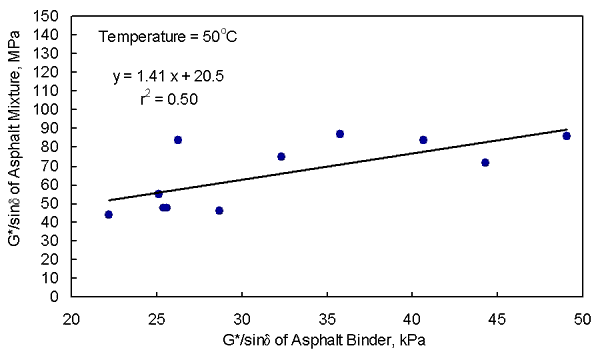
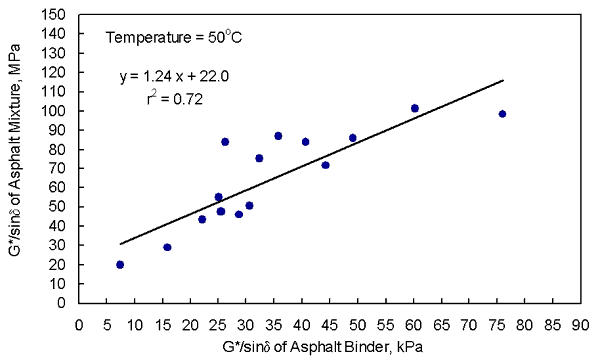
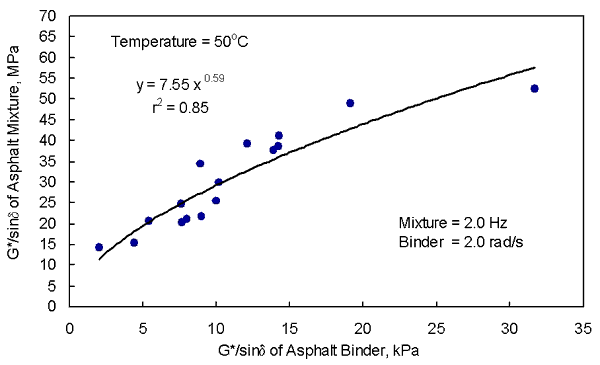
Figure 5. G*/sind of the asphalt
mixture vs. G*/sind
of the asphalt binder using the 11 asphalt binders.
Figure 6. G*/sind of the
asphalt mixture vs. G*/sind
of the asphalt binder using all 16 asphalt binders.
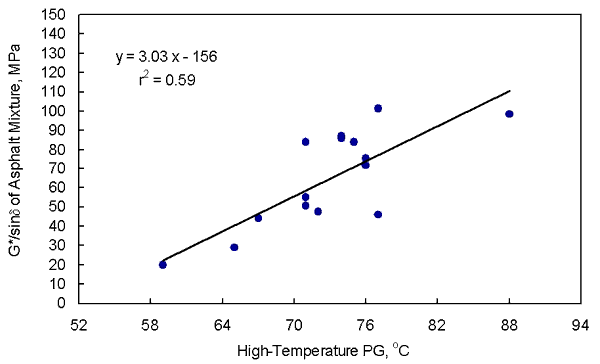
Figure 7. G*/sind of the asphalt
mixture at 50°C vs.
high-temperature PG using the 11 asphalt binders.
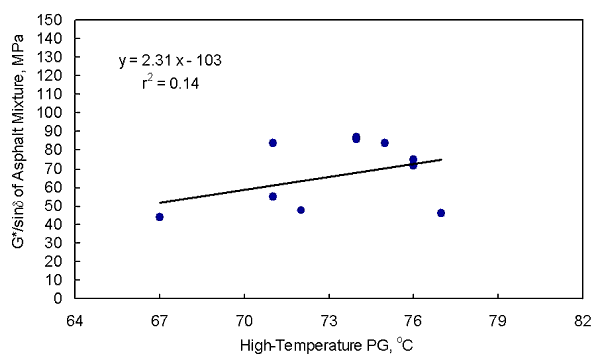
Figure 8. G*/sind of the asphalt
mixture at 50oC vs.
high-temperature PG using all 16 asphalt binders.
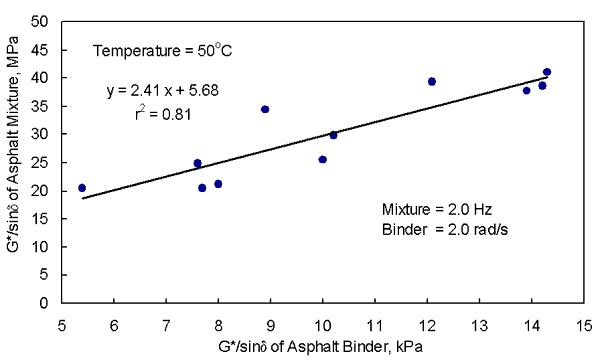
Figure 9. G*/sind of the asphalt
mixture at 2.0 Hz vs. G*/sind
of the asphalt binder at 2.0 rad/s using the 11 asphalt binders.
Figure 10. G*/sind of the asphalt
mixture at 2.0 Hz vs. G*/sind
of the asphalt binder at 2.0 rad/s using all 16 asphalt binders.
Table 9. G*/sind's of the asphalt binders vs. cumulative permanent shear strain.
| Asphalt Binder or Mixture Designation | Binder | Mixture | Pavement | |
|---|---|---|---|---|
| High Temp. PG | G*/sind, 10.0 rad/s, 50°C (kPa) | Shear Strain, 50°C (mm/m) | Relative ALF Rut Depth (mm) | |
| Styrelf (Validation Study) | 88 | 76.0 | 10 500 | 6.1 |
| EVA | 75 | 26.3 | 13 600 | 7.3 |
| Novophalt (Validation Study) | 77 | 60.2 | 14 100 | 7.5 |
| Elvaloy | 77 | 28.7 | 14 600 | 7.7 |
| EVA Grafted | 74 | 35.8 | 15 400 | 8.0 |
| CMCRA | 76 | 44.3 | 19 100 | 9.7 |
| SBS Radial Grafted | 71 | 25.1 | 21 300 | 10.4 |
| Air-Blown | 74 | 49.1 | 21 300 | 10.4 |
| ESI | 76 | 32.3 | 22 700 | 11.0 |
| SBS Linear Grafted | 72 | 25.6 | 23 200 | 11.2 |
| PG 70-22 | 71 | 40.7 | 23 900 | 11.4 |
| SBS Linear | 72 | 25.4 | 26 500 | 12.5 |
| AC-20 (Validation Study) | 70 | 30.7 | 36 200 | 16.4 |
| PG 64-28 | 67 | 22.2 | 38 600 | 17.3 |
| AC-10 (Validation Study) | 65 | 15.9 | 61 300 | 26.4 |
| AC-5 (Validation Study) | 59 | 7.5 | 85 500 | 36.1 |
| Unmodified Asphalt Binders Only |
||||
| PG 70-22 | 71 | 40.7 | 23 900 | 11.4 |
| AC-20 (Validation Study) | 70 | 30.7 | 36 200 | 16.4 |
| PG 64-28 | 67 | 22.2 | 38 600 | 17.3 |
| AC-10 (Validation Study) | 65 | 15.9 | 61 300 | 26.4 |
| AC-5 (Validation Study) | 59 | 7.5 | 85 500 | 36.1 |
Table 10. Statistical rankings
for the 11 asphalt
mixtures based on cumulative permanent shear strain.
| Asphalt Binder or Mixture Designation |
Binder | Mixture | |||||||
|---|---|---|---|---|---|---|---|---|---|
| High Temp. PG | G*/sind, 10.0 rad/s, 50°C (kPa) | Cumulative Permanent Shear Strain, 50°C (mm/m) | |||||||
| EVA | 75 | 26.3 | 13 600 | A | |||||
| Elvaloy | 77 | 28.7 | 14 600 | A | |||||
| EVA Grafted | 74 | 35.8 | 15 400 | A | B | ||||
| CMCRA | 76 | 44.3 | 19 100 | A | B | C | |||
| SBS Radial Grafted | 71 | 25.1 | 21 300 | B | C | D | |||
| Air-Blown | 74 | 49.1 | 21 300 | B | C | D | |||
| ESI | 76 | 32.3 | 22 700 | C | D | ||||
| SBS Linear Grafted | 72 | 25.6 | 23 200 | C | D | ||||
| PG 70-22 | 71 | 40.7 | 23 900 | C | D | ||||
| SBS Linear | 72 | 25.4 | 26 500 | D | |||||
| PG 64-28 | 67 | 22.2 | 38 600 | E | |||||
Table 11. Replicate data for the cumulative permanent shear strains.
| Asphalt Mixture | Cumulative Permanent Shear Strain at 50°C (mm/m) | CV1 (percent) | |||
|---|---|---|---|---|---|
| Specimen No. 1 | Specimen No. 2 | Specimen No. 3 | Average | ||
| EVA | 15 100 | 12 900 | 12 800 | 13 600 | 9.6 |
| Elvaloy | 13 300 | 14 400 | 16 000 | 14 600 | 9.3 |
| EVA Grafted | 13 800 | 17 100 | 15 300 | 15 400 | 10.7 |
| CMCRA | 22 200 | 16 620 | 18 490 | 19 100 | 14.9 |
| SBS Radial Grafted | 16 200 | 21 400 | 26 300 | 21 300 | 23.7 |
| Air-Blown | 16 100 | 22 200 | 25 700 | 21 300 | 22.8 |
| ESI | 20 580 | 24 040 | 23 510 | 22 700 | 8.2 |
| SBS Linear Grafted | 21 500 | 18 600 | 29 400 | 23 200 | 24.1 |
| PG 70-22 | 18 200 | 26 000 | 27 500 | 23 900 | 20.9 |
| SBS Linear | 29 500 | 23 400 | 26 700 | 26 500 | 11.5 |
| PG 64-28 | 41 290 | 42 030 | 32 410 | 38 600 | 13.9 |
1CV = Coefficient of Variation, percent = (standard deviation ÷ average)*100.
Figure 11. Cumulative permanent shear strain vs. G*/sind
of the asphalt binder at 10.0 rad/s using the 11 asphalt binders.
Figure 12. Log cumulative permanent shear strain vs. log
G*/sind
of the asphalt binder at 10.0 rad/s using all 16 asphalt binders.
Figure 13. Cumulative permanent shear strain at 50°C
vs. high-temperature PG using the 11 asphalt binders.
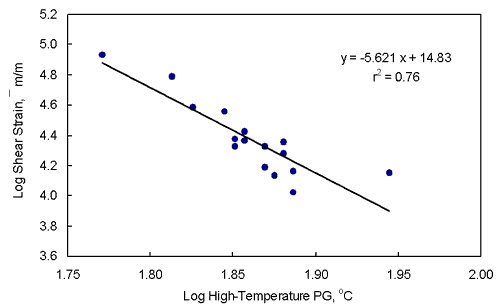
Figure 14. Log cumulative permanent shear strain at 50°C
vs. log high-temperature PG using all 16 asphalt binders.
Table 12. G*/sind's
of the asphalt binders at 10.0, 2.0, and 0.125 rad/s with
the asphalt binders listed from highest to lowest G*/sind using 0.125 rad/s.
| Asphalt Binder | G*/sind at 50°C (kPa) | ||
|---|---|---|---|
| 10.0 rad/s | 2.0 rad/s | 0.125 rad/s | |
| Styrelf (Validation Study) | 76.0 | 31.8 | 5.230 |
| EVA | 26.3 | 12.1 | 2.744 |
| EVA Grafted | 35.8 | 14.3 | 2.312 |
| Novophalt (Validation Study) | 60.2 | 19.1 | 2.000 |
| Elvaloy | 28.7 | 10.0 | 1.597 |
| CMCRA | 44.3 | 13.9 | 1.541 |
| Air-Blown | 49.1 | 14.2 | 1.390 |
| SBS Linear Grafted | 25.6 | 8.0 | 0.917 |
| ESI | 32.3 | 8.9 | 0.868 |
| SBS Linear | 25.4 | 7.7 | 0.811 |
| PG 70-22 | 40.7 | 10.2 | 0.808 |
| SBS Radial Grafted | 25.1 | 7.6 | 0.802 |
| AC-20 (Validation Study) | 30.7 | 9.0 | 0.635 |
| PG 64-28 | 22.2 | 5.4 | 0.405 |
| AC-10 (Validation Study) | 15.9 | 4.4 | 0.348 |
| AC-5 (Validation Study) | 7.5 | 2.1 | 0.130 |
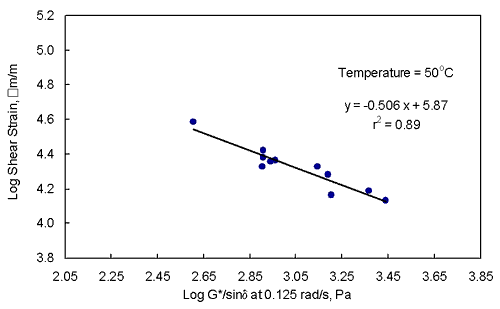
Figure 15. Log cumulative permanent shear strain vs. log
G*/sind
of the asphalt binder at 0.125 rad/s using the 11 asphalt binders.
Figure 16. Log cumulative permanent shear strain vs. log
G*/sind
of the asphalt binder at 0.125 rad/s using all 16 asphalt binders.
The following equation was provided by the five asphalt binders used in the Superpave Validation Study:
RD = 1.87 + 0.0004 (CPSS) |
r2 = 0.92 | (2) |
where:
RD = Rut depth in the asphalt pavement layer at 58°C, mm.
CPSS = Cumulative permanent shear strain at 5,000 cycles and 50°C, mm/m.
The rut depths provided by equation 2 are included in table 9. Substituting the cumulative permanent shear strains of 28 750 to 18 100 mm/m into equation 2 provided rut depths of 13.4 and 9.1 mm, respectively. Therefore, an increase in PG from 70 to 76 provides a 32-percent reduction in rut depth. In the Superpave Validation Study, a change in strain from 28 750 to 18 100 mm/m would have provided a 50-percent reduction in rut depth. The applicability of equation 2 is questionable, but both studies indicate that an increase in PG from 70 to 76 should provide a significant decrease in the rate of pavement rutting for the particular mixture tested in this study.
In the Superpave Validation Study, Novophalt had the lowest cumulative permanent shear strain at 40°C at a 95-percent level of significance. Novophalt also had the highest resistance to pavement rutting at the three pavement test temperatures that were used: 58, 70, and 76°C. The data at 50°C in table 9 shows that Styrelf is ranked above Novophalt, although the strains for these two mixtures are not significantly different. Because the Novophalt mixture was more resistant to rutting according to both RSCH at 40°C and the pavement tests at 58, 70, and 76°C, it should have been more resistant to rutting when tested by RSCH at 50°C. This suggests that the change in ranking was the result of substituting diabase dust for hydrated lime. This change in ranking decreases the confidence in equation 2, even though the r2 of 0.92 is high.
The French PRT tests a slab for permanent deformation using a smooth, rubber tire inflated to 600 ±30 kPa.(1) Each slab had a length of 500 mm, a width of 180 mm, and a thickness of 50 mm. The applied load was 5000 ±50 N and the test temperature was 70°C. The air-void level was 7.0 percent. The test normally ends at 6,000 wheel passes. In this study, the test was continued to 20,000 wheel passes to provide supplementary information. The French PRT is shown in figures 17 and 18.
Table 13 gives the rankings from Fisher's LSD for the average rut depths at 6,000 wheel passes. Only the mixture with the PG 64-28 asphalt binder had a significantly different average rut depth. The rut depths at 20,000 wheel passes provided the same ranking. The analysis indicated that the rut depths at 6,000 wheel passes need to differ by at least 2.1 mm for them to be different at a 5-percent level of significance.
The replicate data are given in table 14. Only one mixture, SBS Radial Grafted, had a high coefficient of variation. The coefficients are remarkably low for testing only two specimens per mixture.
For the 11 materials, figure 19 shows that the correlation between the rut depth at 6,000 wheel passes and G*/sind at 0.9 rad/s was poor. The r2 was 0.52. A DSR frequency of 0.9 rad/s was used because it accounts for the slow speed of the French PRT.(1) The r2 increased from 0.52 to 0.70 using a log-log transformation, which indicates that there is a general trend of decreasing rut depth with increasing G*/sind. The log-log relationship is shown in figure 20. Without EVA, the r2 would be 0.88.
Figure 21 shows that the correlation using the data from all asphalt binders and mixtures was poor. However, the relationship is curvilinear. Figure 22 shows the same data using a log-log transformation. The r2 increased from a poor value of 0.52 to a high value of 0.88. Without EVA, the r2 would be 0.93.
The high-temperature PG's provided fair to good correlations with the rut depths. Figure 23 shows that the r2 for the 11 asphalt binders and mixtures was 0.80. After excluding the data for the PG 64-28 materials, the r2 dropped to 0.71 and the range in the rut depths at 6,000 passes was only 6.5 to 8.5 mm.
Figure 24 shows that the r2 using all asphalt binders and mixtures was 0.80. The data for Styrelf was eliminated to determined if this would decrease the r2. The r2 increased to 0.85. Based on the relationship given in figure 24, an increase of one high-temperature PG, from 70 to 76, would decrease the rut depth from 9.1 to 7.2 mm at 70°C, which is a 21-percent reduction. This is less than the 37-percent reduction provided by the cumulative permanent shear strains at 50°C. This may be due to the difference in test temperature or stress level. It is desirable that an increase of one PG be beneficial. However, a large difference in rutting performance would mean that the performances of asphalt binders within a grade could be significantly different. A decrease in rut depth of 20 to 40 percent with a change in PG seems reasonable.
In the Superpave Validation Study, Novophalt had the highest resistance to rutting according to the French PRT and ALF pavement tests.(1) The French PRT data in table 13 shows that Styrelf is ranked above Novophalt, although the rut depths for these two mixtures are not different at a 5-percent level of significance. No conclusion concerning the possible effect of hydrated lime could be made based on these results because both the test temperature and slab thickness were changed. A test temperature of 60°C and a slab thickness of 100 mm were used in the Superpave Validation Study, compared to 70°C and 50 mm in this study.