U.S. Department of Transportation
Federal Highway Administration
1200 New Jersey Avenue, SE
Washington, DC 20590
202-366-4000
Federal Highway Administration Research and Technology
Coordinating, Developing, and Delivering Highway Transportation Innovations
 |
| This report is an archived publication and may contain dated technical, contact, and link information |
|
Publication Number: FHWA-RD-02-042 Date: October 2000 |
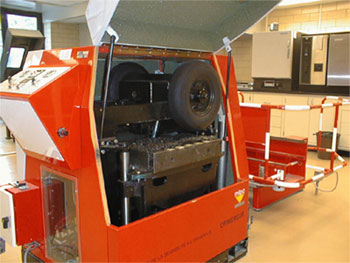
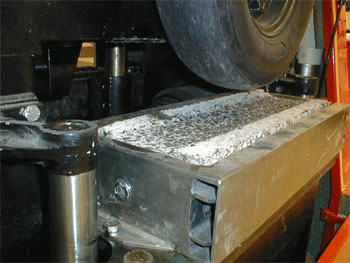
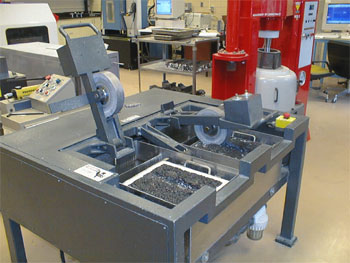
The Hamburg WTD tests a slab of hot-mix asphalt submerged in hot water by rolling a steel wheel across its surface. The slabs tested in this study had a length of 320 mm, a width of 260 mm, and a thickness of 80 mm. Thicknesses up to 120 mm can be tested, and the thickness should be at least three times the nominal maximum aggregate size. The device tests two slabs simultaneously using two reciprocating solid steel wheels, each having a width of 47 mm. The applied load is 685 N and the average speed is 1.1 km/h. The rut depth in each slab is measured continuously over a length of 200 mm by a linear variable differential transformer. This rut depth does not include any upward heaving outside the wheelpath. After each user-specified increment of wheel passes is applied, the device stores the maximum rut depth along the 200-mm wheelpath relative to a rut depth of zero for the first wheel pass. It does not calculate an average rut depth. The standard maximum number of wheel passes is 20,000. This requires approximately 6.5 h. The pass/fail rut depth is 10 mm at 20,000 passes. Additional information on the Hamburg WTD is given elsewhere.(1,5-7) The device is shown in figure 25. The rut depths as a function of wheel passes are given in figure 26.
The creep slope from this device, which is the number of wheel passes needed to create a 1-mm rut depth, was used to evaluate the mixtures for their resistance to rutting. The creep slope is a measure of rutting resistance before moisture starts to significantly damage the specimen. Even so, some moisture damage may be included in the creep slope. Higher creep slopes indicate more resistance to rutting.
Two slabs were compacted per mixture at a 7.0 ±0.5-percent air-void level. Each pair was tested at the same time. This meant that the test temperatures for the two slabs were identical, and each mixture was tested by both wheels, which accounts for any small differences in loading provided by them. The number of replicate specimens was insufficient for randomizing the tests.
The customary test temperature for the Hamburg WTD is 50°C, which was developed in Europe for a climate close to a Superpave high-temperature PG of 58. The test temperature used in this study was based on the amount of moisture damage provided by trial tests using the air-blown and unmodified PG 70-22 asphalt binders. The test temperature was not based on the creep slopes. Temperatures from 50 to 64°C were evaluated, and a temperature of 58°C seemed to be the optimum temperature for determining the effects of the asphalt binders on moisture resistance. This was based on both the rate of failure and the amount of visually stripped aggregate. Because water is used to control the test temperature, no slabs could be tested under dry conditions at 58°C. The effects of the asphalt binders on moisture sensitivity are reported elsewhere.(8)
Figure 17. French Pavement Rutting Tester.
Figure 18. French PRT wheel and slab.
Table 13. G*/sind's
of the asphalt binders vs. the French PRT with the
materials listed from the lowest to highest rut depth at 6,000
wheel passes.
| Asphalt Binder or Mixture Designation | Binder | Mixture | |||
|---|---|---|---|---|---|
| High Temp. PG | G*/sind, 0.9 rad/s, 70°C (Pa) | Rut Depth at 70°C (mm) | |||
| 2,000 Passes | 6,000 Passes | 20,000 Passes | |||
| Styrelf (Validation Study) | 88 | 2360 | 3.6 | 4.8 | 6.2 |
| Novophalt (Validation Study) | 77 | 1020 | 5.0 | 6.0 | 7.2 |
| Elvaloy | 77 | 753 | 4.9 | 6.5 A | 7.9 |
| Air-Blown | 74 | 439 | 5.4 | 6.8 A | 9.0 |
| CMCRA | 76 | 566 | 5.4 | 6.8 A | 9.7 |
| EVA Grafted | 74 | 394 | 5.7 | 7.5 A | 10.4 |
| ESI | 76 | 500 | 5.5 | 7.6 A | 9.2 |
| EVA | 75 | 203 | 6.0 | 7.6 A | 10.1 |
| SBS Linear Grafted | 72 | 361 | 6.7 | 8.2 A | 10.3 |
| SBS Radial Grafted | 71 | 312 | 6.7 | 8.2 A | 10.4 |
| PG 70-22 | 71 | 260 | 6.9 | 8.3 A | 10.6 |
| SBS Linear | 72 | 309 | 7.0 | 8.5 A | 10.5 |
| AC-20 (Validation Study) | 70 | 219 | 7.7 | 9.7 | 12.9 |
| AC-10 (Validation Study) | 65 | 118 | 8.8 | 10.7 | 15.1 |
| PG 64-28 | 67 | 151 | 9.8 | 12.1 B | 16.0 |
| Unmodified Asphalt Binders Only | |||||
| PG 70-22 | 71 | 260 | 6.9 | 8.3 | 10.6 |
| AC-20 (Validation Study) | 70 | 219 | 7.7 | 9.7 | 12.9 |
| AC-10 (Validation Study) | 65 | 118 | 8.8 | 10.7 | 15.1 |
| PG 64-28 | 67 | 151 | 9.8 | 12.1 | 16.0 |
Table 14. Replicate data for the French PRT.
| Asphalt Mixture | Rut Depth at 6,000 wheel passes and 70°C (mm) | CV1 (percent) | ||
|---|---|---|---|---|
| Specimen No. 1 | Specimen No. 2 | Average | ||
| Styrelf (Validation Study) | 4.3 | 5.2 | 4.8 | 13.4 |
| Novophalt (Validation Study) | 6.0 | 5.9 | 6.0 | 12.9 |
| Elvaloy | 5.9 | 7.0 | 6.5 | 12.1 |
| Air-Blown | 6.4 | 7.1 | 6.8 | 7.3 |
| CMCRA | 6.6 | 6.9 | 6.8 | 3.1 |
| EVA Grafted | 7.0 | 8.1 | 7.5 | 10.3 |
| ESI | 8.3 | 6.8 | 7.6 | 14.0 |
| EVA | 6.8 | 8.5 | 7.6 | 15.7 |
| SBS Linear Grafted | 8.6 | 7.7 | 8.2 | 7.8 |
| SBS Radial Grafted | 6.5 | 9.9 | 8.2 | 29.3 |
| PG 70-22 | 8.0 | 8.6 | 8.3 | 5.1 |
| SBS Linear | 8.6 | 8.4 | 8.5 | 1.7 |
| AC-20 (Validation Study) | 9.7 | 9.7 | 9.7 | 0.0 |
| AC-10 (Validation Study) | 10.6 | 10.8 | 10.7 | 1.3 |
| PG 64-28 | 11.7 | 12.4 | 12.1 | 4.1 |
1CV = Coefficient of Variation, percent = (standard deviation ÷ average)*100.
Figure 19. French PRT rut depth vs. G*/sind of the
asphalt binder at 0.9 rad/s using the 11 asphalt binders.
Figure 20. Log French PRT rut depth vs. log G*/sind
of the asphalt binder at 0.9 rad/s using the 11 asphalt binders.
Figure 21. French PRT rut depth vs. G*/sind of the
asphalt binder at 0.9 rad/s using all asphalt binders.
Figure 22. Log French PRT rut depth vs. log G*/sind
of the asphalt binder at 0.9 rad/s using all asphalt binders.
Figure 23. French PRT rut depth at 70°C vs.
high-temperature PG using the 11 asphalt binders.
Figure 24. French PRT rut depth at 70oC vs.
high-temperature PG using all asphalt binders.
Figure 25. Hamburg Wheel-Tracking Device without water.
Figure 26. Rut depth vs. wheel passes from the Hamburg WTD at 58ºC.
Table 15 provides the creep slopes. Three of the five asphalt binders used in the Superpave Validation Study were tested. The AC-5 and AC-10 asphalt binders were not tested because, in the former study, the mixtures with these binders failed rapidly. Both binders provided creep slopes at less than 700 passes/mm at 50°C, which was 8°C lower than the test temperature of 58°C used in this study.
Table 16 provides the replicate creep slopes. Many of the coefficients of variation are very poor, being above 30 percent. This is why 8 of the 11 mixtures fell into one group (group C) in table 15. The coefficients indicate that more slabs would have to be tested in order to have confidence in the averages.
The correlation between the creep slopes and G*/sind at 0.125 rad/s for the 11 materials was poor. The r2 was 0.44. A frequency of 0.125 rad/s was used because it accounts for the slow speed of the Hamburg WTD.(1) G*/sind's at other DSR frequencies were also evaluated, but they did not provide higher r2's. There was no correlation between the creep slopes and high-temperature PG. The r2 was zero. This lack of a correlation could be expected based on the poor repeatability of the creep slopes.
The r2's from regression analyses using all 14 asphalt binders and mixtures were higher than for the 11 asphalt binders and mixtures. This was solely due to the inclusion of the data for Styrelf, which had the highest G*/sind and creep slope. Without Styrelf, the r2's were poor.
9. Evaluation of Data Without Statistical Analysis
Table 17 provides rankings for the average cumulative permanent shear strains from RSCH and the average rut depths from the French PRT. These two tests were the primary tests used to evaluate rutting resistance. Rankings are also given for G*/sind and the high-temperature PG's. The rankings in table 17 do not consider whether the differences in the averages are significant at a particular confidence level. Evaluating the rankings is also subjective.
Table 18 shows the results in terms of numerical rankings, where the ranking for each mixture test is considered the correct ranking. The rankings show that cumulative permanent shear strain correlates better with G*/sind at 0.125 rad/s and 50°C than with high-temperature PG. The main discrepancy provided by G*/sind at 0.125 rad/s is that the ranking for SBS Radial Grafted (No. 5) is low. However, SBS Radial Grafted is not an outlier based on the relationship shown in figure 15. All of the other numerical rankings for G*/sind are not more than two positions away from where they should be based on the shear strains.
Table 18 shows that the main discrepancies provided by the French PRT are that the G*/sind at 0.9 rad/s for EVA (No. 6) is low, and the high-temperature PG for the air-blown asphalt binder (No. 2) may be slightly low. The former discrepancy is supported by the relationship shown in figure 20, and also by figure 22. All of the other rankings are not more than two positions away from where they should be (based on the rut depths).
10. Comparison of Mixture Tests
Table 19 provides r2's from regression analyses performed on the data from the 11 mixtures. All of the r2's are poor except for the correlation between RSCH and the French PRT. The r2 is 0.75. This relationship is shown in figure 27. The r2 for the relationship without the PG 64-28 mixture is poor (0.40).
Table 20 provides r2's from regression analyses performed on the data from all mixtures. All of the r2's are poor, except for the correlations between RSCH and French PRT and between RSCH and FSCH using log-log transformations. The r2's are 0.76 and 0.73, respectively. The relationships are shown in figures 28 and 29, respectively. These relationships should not be used to predict one property from the other. The r2's are too low for prediction purposes. Table 20 shows that the next highest r2 was 0.69 between the French PRT and the Hamburg WTD.