U.S. Department of Transportation
Federal Highway Administration
1200 New Jersey Avenue, SE
Washington, DC 20590
202-366-4000
Federal Highway Administration Research and Technology
Coordinating, Developing, and Delivering Highway Transportation Innovations
 |
| This report is an archived publication and may contain dated technical, contact, and link information |
|
Publication Number: FHWA-RD-03-093
Date: August 2006 |
||||||||||||||||||||||||||||||||||||||||||||||||||||||||||||||||||||||||||||||||||||||||||||||||||||||||||||||||||||||||||||||||||||||||||||||||||||||||||||||||||||||||||||||||||||||||||||||||||||||||||||||||||||||||||||||||||||||
Study of Long-Term Pavement Performance (LTPP): Pavement DeflectionsChapter 3. Inconsistent FWD Deflection BasinsIntroduction to Data Screening for Consistency of Measured DeflectionsThe most basic and obvious type of FWD data error is associated with a random type of data anomaly. In this case, when one deflection, normalized to a uniform or target load level, is appreciably different from the other deflections taken at the same time and test point, a random error or a faulty deflection sensor are likely causes. The Dynatest® Model 8000 FWD, with either the 8600 or 9000 system processor, is the only FWD device currently owned and operated by LTPP. These models advertise a deflection accuracy of ±2 percent ±2 micrometers (mm) (microns), with the 2 percent figure representing the potential systematic error (or bias) and the 2mm figure representing the random error (or precision). Since both relative and reference calibrations carried out from time to time have indicated that this claim is generally true, it was determined that using a combination of potential random and systematic error sources may be useful in finding inconsistent drop-to-drop deflection data in the database. Inconsistent Deflection Basin Identification CriteriaThe ±2 mm random variation associated with deflection measurements is generally stated as a one standard deviation limit, not an absolute limit. Therefore, it was immediately clear that a larger limit was necessary so as not to identify potentially good data as a random error or an inconsistent deflection basin. As an end result, the following was carried out:
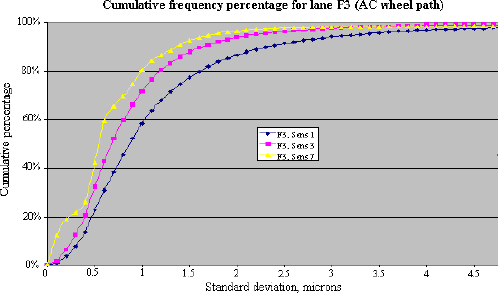
These marked and flagged data were an uncommon occurrence in the database. For example, figure 1 shows a typical distribution of the calculated (load-normalized) standard deviations for all AC type pavements tested along the wheelpath (designated in the database as “lane F3”).
Figure 1. Graph. Frequency distribution of standard deviations for repeated deflections. The task of identifying the distribution of standard deviations was facilitated by shifting the standard deviation limits by 1 percent of the deflection reading. As shown, a standard deviation level of 4 mm or greater (after the 1 percent of adjustment) only exists in 1 to 2 percent of the entire pre-autumn 1998 FWD load-deflection database. After a careful review of the data, the correlation and standard deviation criteria were set for various categories or lanes of tested pavements. The data that caused the most extreme outliers were immediately flagged, while the other data were identified and marked for further assessment. These criteria are shown in table 2.
Creation of LTPP Feedback ReportsThe transformed basin, or SLIC method described in chapter 5 (see also appendix B) was subsequently used to reexamine the marked and flagged data selected by the automatic identification method described above. Although the method of transformed basins was developed primarily to identify sensor position errors, random errors and anomalies can also be detected from these graphs. The SLIC technique had not been developed before the automatic identification method for inconsistent deflection basins was employed. Also, responses to our original Feedback Report (called RNS–4) of September 1999 suggested that the automatic identification method, on occasion, improperly identified suspect data, and in fact the set of drop heights used to identify anomalous data was sometimes itself a potentially anomalous set of data. Such a situation could occur, for example, when data from all four drops at a particular height were spurious but consistent with each other. These data would then pass the random error screen based on standard deviations, and then be used not only to confirm a record of anomalous data, but all the other records at that same drop height, some of which were potentially correct. After a reexamination of all 7,045 data records originally recommended for final flagging in Feedback Report RNS–4, and with the aid of the transformed basin graphs, some of the identified data records were reclassified as good or at least okay. In addition, many of the original RNS–4 Feedback Report recommendations have by now been flagged in the current database, as so-called nondecreasing deflections (strictly speaking, these are increasing deflections, as adjacent but equal deflections are not flagged). These currently flagged data records were relabeled accordingly. Accordingly, the new criteria only marked the most extreme anomalies or outliers. As an example, section 12–4154 tested on November 9, 1990, is shown in table 3, using the autoidentification criteria listed in table 2.
In this example, the criteria presented in table 2 were applied, and as a result the last line of data from the fourth drop height was marked. The average of the third drop height was used to compare the basins from the fourth drop height. As can be seen in table 3, it appears that deflection sensor #7 had too low a deflection (by about 14 mm) while #6 had too high a deflection, though by a lesser amount. Such magnitudes of deviation can have a significant impact on backcalculated moduli or other basin shape factors. There were some cases in which none of the drop heights used at a given test point passed the 4 mm less 1 percent of reading standard deviation test, so none of the drop heights could be used for automated comparisons. In these cases, marking was accomplished visually, since in all instances at least a few of the deflection basins seemed reasonable from most or all of the four drop heights. Visual marking was an attempt to avoid flagging data that may, in fact, be acceptable and useable. An attempt was made to always have data from at least one drop left, after marking, at a given test point and drop height, although this could not be achieved 100 percent of the time. As previously mentioned, the unbound material tests conducted directly on the subgrade or granular base layers (denoted by an S = subgrade or a G = granular in the lane designation) were too variable to separate real errors or anomalies from the actual pavement response. There were several causes for this problem; those causes are described in the following paragraphs. The FWD equipment provided to SHRP and the LTPP program was not specifically designed to test unbound materials, although with careful handling it can be used successfully for unbound material tests. The load plate on the LTPP program’s FWD equipment is not segmented or split. When unbound materials are tested, the mean pressure under the loading plate should be reduced to a level similar to what that particular layer will experience, under traffic, after the bound layers are in place. In most cases when unbound materials were tested, not only was the small 300-millimeter (mm) (117-inch) loading plate used in lieu of the provided 450-mm (136.5-inch) loading plate, but the ordinary weight package and standard drop heights used for bound material tests were occasionally employed as well. This often resulted in deflections that were too large, sometimes even exceeding the physical limits of the FWD’s ~2,100 mm sensor range. Further, this problem not only occurred on a regular basis for the center deflection, but for sensors 2 and 3 from time to time, especially in the case of subgrade tests. Use of the 450-mm (136.5-inch) plate results in better confinement of the materials under test, which is more realistic. All of these factors contributed to several spurious deflection readings observed throughout the S- and G-tests conducted for the LTPP program and later uploaded as level E data into the database. In addition, unbound materials often behave nonelastically, with plastic deformations, punching, and shear deformations taking place simultaneously on a fairly regular basis. Nevertheless, no flags or other changes to the data are recommended to the S- and G-data, because some of the deflection readings—particularly those between d2 and d5—often appear to be reasonable. These data alone may prove to be valuable for analysis of unbound material tests, since backcalculation is not likely to be used to derive stiffness data for one, or at the most two, layer(s) in the pavement structure. Except for the unbound material test data, the automated and manual (visual) processes described in the foregoing paragraphs were applied to all of the pre-autumn 1998 load-deflection data from all four regions. A list of recommended flags was developed, and a revision of Feedback Report RNS–4 was created, called RNS–4M (shown in appendix A). Table 4 shows the number of recommended flagged records versus the approximate number of records in the corresponding pre-autumn 1998 “*.M06” files in the LTPP database.
As shown in table 4, on a percentage basis the overall number of recommended flags is very small. The errors identified were possibly attributable to equipment operators not noticing when something was wrong with a particular sensor or sensors. Much of the flagged data was sequential (i.e., from the same day and along the same test section). It is also possible that there were intermittent problems with the equipment that could not be immediately rectified in the field. Finally, it should be noted that other flags were originally recommended in Feedback Report RNS–4; however, most of these were corrected or changed through other screening methods, such as the visual SLIC method (see chapter 5) or the use of the nondecreasing deflections flag mentioned above. With respect to the use of flags in the load-deflection tables, such as those recommended in Feedback Report RNS–4M (see appendix A), a Feedback Report designated RNS–7 was submitted. This feedback report is also presented in appendix A.
|
||||||||||||||||||||||||||||||||||||||||||||||||||||||||||||||||||||||||||||||||||||||||||||||||||||||||||||||||||||||||||||||||||||||||||||||||||||||||||||||||||||||||||||||||||||||||||||||||||||||||||||||||||||||||||||||||||||||