U.S. Department of Transportation
Federal Highway Administration
1200 New Jersey Avenue, SE
Washington, DC 20590
202-366-4000
Federal Highway Administration Research and Technology
Coordinating, Developing, and Delivering Highway Transportation Innovations
 |
| This report is an archived publication and may contain dated technical, contact, and link information |
|
Publication Number: FHWA-RD-03-094
Date: March 2005 |
|||||||||||||||||||||||||||||||||||||||||||||||||||||||||||||||||||||||||||||||||||||||||||||||||||||||||||||||||||||||||||||||||||||||||||||||||||||||||||||||||||||||||||||||||||||||||||||||||||||||||||||||||||||||||||||||||||||||||||||||||||||||||||||||||||||||||||||||||||||||||||||||||||||||||||||||||||||||||||||||||||||||||||||||||||||||||||||||||||||||||||||||||||||||||||||||||||||||||||||||||||||||||||||||||||||||||||||||||||||||||||||||||||||||||||||||||||||||||||||||||||||||||||||||||||||||||||||||||||||||||||||||||||||||||||||||||||||||||||||||||||||||||||||||||||||||||||||||||||||||||||||||||||||||||||||||||||||||||||||||||||||||||||||||||||||||||||||||||||||||||||||||||||||||||||||||||||||||||||||||||||||||||||||||||||||||||||||||||||||||||||||||||||||||||||||||||||||||||||||||||||||||||||||||||||||||||||||||||||||||||||||||||||||||||||||||||||||||||||||||||||||||||||||||||||||||||||||||||||||||||||||||||||||||||||||||||||||||||||||||||||||||||||||||||||||||||||||||||||||||
Estimating Cumulative Traffic Loads, Volume II: |
|||||||||||||||||||||||||||||||||||||||||||||||||||||||||||||||||||||||||||||||||||||||||||||||||||||||||||||||||||||||||||||||||||||||||||||||||||||||||||||||||||||||||||||||||||||||||||||||||||||||||||||||||||||||||||||||||||||||||||||||||||||||||||||||||||||||||||||||||||||||||||||||||||||||||||||||||||||||||||||||||||||||||||||||||||||||||||||||||||||||||||||||||||||||||||||||||||||||||||||||||||||||||||||||||||||||||||||||||||||||||||||||||||||||||||||||||||||||||||||||||||||||||||||||||||||||||||||||||||||||||||||||||||||||||||||||||||||||||||||||||||||||||||||||||||||||||||||||||||||||||||||||||||||||||||||||||||||||||||||||||||||||||||||||||||||||||||||||||||||||||||||||||||||||||||||||||||||||||||||||||||||||||||||||||||||||||||||||||||||||||||||||||||||||||||||||||||||||||||||||||||||||||||||||||||||||||||||||||||||||||||||||||||||||||||||||||||||||||||||||||||||||||||||||||||||||||||||||||||||||||||||||||||||||||||||||||||||||||||||||||||||||||||||||||||||||||||||||||||||||
|
Data Presence
|
||
|---|---|---|
 |
 |
 |
|
a. Data presence total sites. |
b. Data presence GPS sites. |
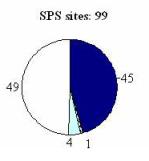
c. Data presence SPS sites. |
|
Data Usability for Projection
|
||
|---|---|---|
|
|
|
|
|
d. Data usability total sites.
|
e. Data usability GPS sites.
|
f. Data usability SPS sites.
|
 |
 |
|
|
Data Quality for
Projection
|
||
|---|---|---|
|
|
|
|
|
g. Data quality total sites.
|
h. Data quality GPS sites.
|
i. Data quality SPS sites.
|
 |
||
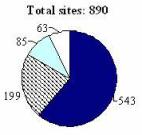
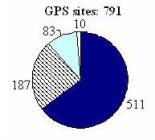
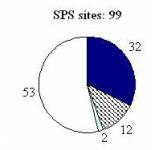
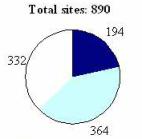
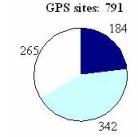
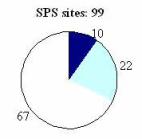
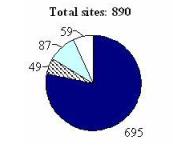
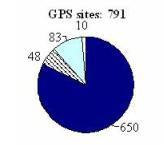
Figure 20. Summary of LTPP sites sorted by data presence and data usability for projection.
The availability of traffic projections for the LTPP sites is also summarized in table 7. Of the 890 sites, 194 (21.8 percent) were assigned an acceptable projection confidence code and 364 (40.9 percent) were assigned a questionable projection confidence. For 269 sites (30.2 percent), only the projection of annual truck volumes was provided, and for 63 sites (7.1 percent), no traffic projections were carried out because of lack of data.
Table 7. Availability of traffic projections.
| Projection Result | All Sites | All Sites | GPS | SPS | ||||
|---|---|---|---|---|---|---|---|---|
| No. of Sites | % | No. of Sites | % | No. of Sites | % | No. of Sites | % | |
|
Acceptable |
194 |
21.8 |
558 |
62.7 |
184 |
23.3 |
10 |
10.1 |
|
Questionable |
364 |
40.9 |
342 |
43.2 |
22 |
22.2 |
||
|
Truck Volume |
269 |
30.2 |
332 |
37.3 |
255 |
32.2 |
14 |
14.1 |
|
None |
63 |
7.1 |
10 |
1.3 |
53 |
53.5 |
||
|
TOTAL |
890 |
100 |
890 |
100 |
791 |
100 |
99 |
100 |
|
Projection Results:
Acceptable = projection confidence code was "Initial Acceptable" or "Reviewed Acceptable"; Questionable = projection confidence code was "Initial Questionable" or "Reviewed Questionable"; Truck Volume = only the projection of annual truck volumes was carried out; None = no traffic projection was carried out. |
||||||||
Considering that only about 23 percent of all GPS sites and about 10 percent of all SPS sites had acceptable axle load estimates, greater attention should be paid to the quality of traffic data. About 37 percent (332 sites) of all sites had insufficient site–specific truck class and/or axle weight distribution data to carry out axle load projections. To obtain axle load estimates for these 332 sites, new traffic monitoring data must be collected or surrogate data must be used. Chapter 5 outlines the proposed LTPP PLG that would facilitate the projection of traffic loads for these sites.
The projection results provided here are for LTPP sites with unique traffic identification numbers. The total number of all LTPP sections is larger than the number of the LTPP sites because one site may provide traffic data for several sections.
Table 8 shows the availability of traffic projections by the experiment type and the projection confidence code. For the GPS experiment types with more the 10 sites, the percentage of sites without axle load projections (projection confidence code N) ranges from 16.1 percent for GPS–7B to 40.8 percent for GPS–6A. As already indicated in figure 20, the percentage of sites without traffic projections is higher for SPS experiments than for GPS experiments.
Table 8. Availability of traffic projections by experiment type and projection confidence code.
| Experiment Type | Total Number of Sites | Projection Confidence Code | |||||
|---|---|---|---|---|---|---|---|
| A | Q | N | |||||
| Number of Sites |
Percent of Sites |
Number of Sites |
Percent of Sites |
Number of Sites |
Percent of Sites |
||
|
GPS–1 |
161 |
29 |
18.0 |
69 |
42.9 |
63 |
39.1 |
|
GPS–2 |
90 |
11 |
12.2 |
43 |
47.8 |
36 |
40.0 |
|
GPS–3 |
129 |
42 |
32.6 |
46 |
35.7 |
41 |
31.8 |
|
GPS–4 |
53 |
14 |
26.4 |
29 |
54.7 |
10 |
18.9 |
|
GPS–5 |
72 |
21 |
29.2 |
31 |
43.1 |
20 |
27.8 |
|
GPS–6A |
49 |
8 |
16.3 |
21 |
42.9 |
20 |
40.8 |
|
GPS–6B |
83 |
12 |
14.5 |
38 |
45.8 |
33 |
39.8 |
|
GPS–6C |
14 |
5 |
35.7 |
5 |
35.7 |
4 |
28.6 |
|
GPS–6D |
4 |
1 |
25.0 |
1 |
25.0 |
2 |
50.0 |
|
GPS–6S |
43 |
12 |
27.9 |
17 |
39.5 |
14 |
32.6 |
|
GPS–7A |
22 |
7 |
31.8 |
11 |
50.0 |
4 |
18.2 |
|
GPS–7B |
31 |
11 |
35.5 |
15 |
48.4 |
5 |
16.1 |
|
GPS–7C |
1 |
1 |
100.0 |
– |
– |
– |
– |
|
GPS–7D |
2 |
– |
– |
2 |
100.0 |
– |
– |
|
GPS–7S |
11 |
4 |
36.4 |
4 |
36.4 |
3 |
27.3 |
|
GPS–9 |
26 |
6 |
23.1 |
10 |
38.5 |
10 |
38.5 |
|
SPS–1 |
18 |
2 |
11.1 |
5 |
27.8 |
11 |
61.1 |
|
SPS–2 |
13 |
2 |
15.4 |
5 |
38.5 |
6 |
46.2 |
|
SPS–4 |
2 |
– |
– |
– |
– |
2 |
100.0 |
|
SPS–5 |
12 |
2 |
16.7 |
4 |
33.3 |
6 |
50.0 |
|
SPS–6 |
12 |
3 |
25.0 |
5 |
41.7 |
4 |
33.3 |
|
SPS–7 |
4 |
1 |
25.0 |
2 |
50.0 |
1 |
25.0 |
|
SPS–8 |
16 |
– |
– |
– |
– |
16 |
100.0 |
|
SPS–9 |
22 |
– |
– |
1 |
4.5 |
21 |
95.5 |
|
TOTAL
|
890 |
194 |
21.8 |
364 |
40.9 |
332 |
37.3 |
The availability of traffic projections for LTPP sites according to the highway functional classification is presented in table 9. Of the 890 total sites, 635 (71.3 percent) are located on rural interstates or on rural principal arterial highways. Typically, highway functional classes that are expected to have large truck volumes have the higher percentage of sites with the acceptable projection confidence code. For example, 34.8 percent of all sites on rural interstates had an acceptable projection confidence code, while only 6.9 percent of the sites on rural minor arterial highways were in the acceptable category. This trend is likely caused by larger samples of trucks weighted on major highways, and by the inclination of the participating agencies to install traffic monitoring equipment on major highways rather than on local highways.
The presence of different types of traffic data for sites located in the four LTPP regions is summarized in table 10. More than 70 percent of sites for all LTPP regions had monitoring axle weight, truck class, andtruck volume data. The availability of traffic projections in the four regions is shown in table 11. The highest percentage of sites with acceptable axle load projections was in the Western region (29.4 percent); the lowest percentage (12.1 percent) was in the Southern region. The percentage of sites without traffic load projection ranged from about 30 in the North Central region to 45 in the Southern region.
Table 9. Availability of traffic projections by highway functional class and projection confidence codes.
| FHWA Highway Functional Class | Total Number of Sites | Projection Confidence Code | |||||
|---|---|---|---|---|---|---|---|
| A | Q | N | |||||
| Number of Sites | Percent of Sites | Number of Sites | Percent of Sites | Number of Sites | Percent of Sites | ||
|
Rural Principal Arterial–Interstate |
282 |
98 |
34.8 |
104 |
36.9 |
80 |
28.4 |
|
Rural Principal Arterial–Other |
353 |
62 |
17.6 |
157 |
44.5 |
134 |
38.0 |
|
Rural Minor Arterial |
72 |
5 |
6.9 |
43 |
59.7 |
24 |
33.3 |
|
Rural Major Collector |
19 |
2 |
10.5 |
8 |
42.1 |
9 |
47.4 |
|
Rural Minor Collector |
3 |
– |
– |
1 |
33.3 |
2 |
66.7 |
|
Rural Local Collector |
8 |
– |
– |
– |
– |
8 |
100.0 |
|
Urban Principal Arterial–Interstate |
56 |
13 |
23.2 |
23 |
41.1 |
20 |
35.7 |
|
Urban Principal Arterial–Other Freeways or Expressways |
24 |
6 |
25.0 |
8 |
33.3 |
10 |
41.7 |
|
Urban Other Principal Arterial |
42 |
7 |
16.7 |
19 |
45.2 |
16 |
38.1 |
|
Urban Minor Arterial |
4 |
1 |
25.0 |
1 |
25.0 |
2 |
50.0 |
|
Urban Collector |
2 |
– |
– |
– |
– |
2 |
100.0 |
|
Unclassified |
25 |
– |
– |
– |
– |
25 |
100.0 |
|
TOTAL |
890 |
194 |
21.8 |
364 |
40.9 |
332 |
37.3 |
Table 10. Presence of traffic data by LTPP region.
| LTPP Region | Total Number of Sites | Sites with Traffic Data | Sites with No Traffic Data | |||
|---|---|---|---|---|---|---|
| Weight, Class, and Truck Volumes | Only Class and Truck Volumes | Only Historical Truck Volumes | ||||
| Number | % | |||||
|
North Atlantic
|
149
|
117
|
78.5 |
2 |
21
|
9
|
|
North Central
|
247 |
207
|
83.8
|
6
|
12 |
22
|
|
Southern
|
290
|
230
|
79.3
|
30
|
8
|
22
|
|
Western
|
204
|
141
|
69.1
|
11
|
46
|
6
|
| TOTAL |
890
|
695
|
78.1
|
49
|
87
|
59
|
Table 11. Availability of traffic projections by LTPP region and projection confidence codes.
| LTPP Region | Total Number of Sites | Projection Confidence Code | |||||
|---|---|---|---|---|---|---|---|
| A | Q | N | |||||
| Number of Sites | Percent of Sites |
Number of Sites | Percent of Sites | Number of Sites | Percent of Sites | ||
|
North Atlantic |
149 |
39 |
26.2 |
57 |
38.3 |
53 |
35.6 |
|
North Central |
247 |
60 |
24.3 |
114 |
46.2 |
73 |
29.6 |
|
Southern |
290 |
35 |
12.1 |
125 |
43.1 |
130 |
44.8 |
|
Western |
204 |
60 |
29.4 |
68 |
33.3 |
76 |
37.3 |
|
TOTAL |
890 |
194 |
21.8 |
364 |
40.9 |
332 |
37.3 |
The availability of traffic projections for all participating agencies, in terms of projection confidence codes, is summarized in table 12. For agencies with 10 or more LTPP sites, the percentage of sites with the acceptable projection confidence code ranged from 1.1 percent in Texas to 79.3 percent in Arizona.
Table 12. Availability of traffic projections by participating agencies and projection confidence codes.
| State/Province | Total Number of Sites | Projection Confidence Code | |||||
|---|---|---|---|---|---|---|---|
| A | Q | N | |||||
| Number of Sites | Percent of Sites | Number of Sites | Percent of Sites | Number of Sites | Percent of Sites |
||
|
Alabama |
19 |
3 |
15.8 |
10 |
52.6 |
6 |
31.6 |
|
Alaska |
6 |
– |
– |
6 |
100.0 |
– |
– |
|
Arizona |
29 |
23 |
79.3 |
5 |
17.2 |
1 |
3.4 |
|
Arkansas |
19 |
7 |
36.8 |
7 |
36.8 |
5 |
26.3 |
|
California |
38 |
9 |
23.7 |
12 |
31.6 |
17 |
44.7 |
|
Colorado |
20 |
1 |
5.0 |
8 |
40.0 |
11 |
55.0 |
|
Connecticut |
5 |
1 |
20.0 |
2 |
40.0 |
2 |
40.0 |
|
Delaware |
7 |
– |
– |
– |
– |
7 |
100.0 |
|
District of Columbia |
1 |
– |
– |
– |
– |
1 |
100.0 |
|
Florida |
33 |
– |
– |
21 |
63.6 |
12 |
36.4 |
|
Georgia |
24 |
– |
– |
1 |
4.2 |
23 |
95.8 |
|
Hawaii |
4 |
– |
– |
– |
– |
4 |
100.0 |
|
Idaho |
13 |
3 |
23.1 |
10 |
76.9 |
– |
– |
|
Illinois |
19 |
10 |
52.6 |
7 |
36.8 |
2 |
10.5 |
|
Indiana |
18 |
6 |
33.3 |
9 |
50.0 |
3 |
16.7 |
|
Iowa |
16 |
1 |
6.3 |
7 |
43.8 |
8 |
50.0 |
|
Kansas |
19 |
– |
– |
10 |
52.6 |
9 |
47.4 |
|
Kentucky |
7 |
2 |
28.6 |
4 |
57.1 |
1 |
14.3 |
|
Louisiana |
4 |
– |
– |
2 |
50.0 |
2 |
50.0 |
|
Maine |
8 |
– |
– |
– |
– |
8 |
100.0 |
|
Maryland |
6 |
1 |
16.7 |
– |
– |
5 |
83.3 |
|
Massachusetts |
3 |
– |
– |
1 |
33.3 |
2 |
66.7 |
|
Michigan |
17 |
2 |
11.8 |
13 |
76.5 |
2 |
11.8 |
|
Minnesota |
36 |
21 |
58.3 |
8 |
22.2 |
7 |
19.4 |
|
Mississippi |
28 |
14 |
50.0 |
8 |
28.6 |
6 |
21.4 |
|
Missouri |
27 |
1 |
3.7 |
20 |
74.1 |
6 |
22.2 |
|
Montana |
10 |
– |
– |
– |
– |
10 |
100.0 |
|
Nebraska |
17 |
10 |
58.8 |
6 |
35.3 |
1 |
5.9 |
|
Nevada |
11 |
6 |
54.5 |
4 |
36.4 |
1 |
9.1 |
|
New Hampshire |
1 |
– |
– |
– |
– |
1 |
100.0 |
|
New Jersey |
10 |
3 |
30.0 |
4 |
40.0 |
3 |
30.0 |
|
New Mexico |
16 |
2 |
12.5 |
7 |
43.8 |
7 |
43.8 |
|
New York |
7 |
1 |
14.3 |
3 |
42.9 |
3 |
42.9 |
|
North Carolina |
27 |
5 |
18.5 |
17 |
63.0 |
5 |
18.5 |
|
North Dakota |
5 |
– |
– |
3 |
60.0 |
2 |
40.0 |
|
Ohio |
14 |
3 |
21.4 |
6 |
42.9 |
5 |
35.7 |
Table 12. Availability of traffic projections by participating agencies and projection confidence codes (continued).
| State/Province | Total Number of Sites | Projection Confidence Code | |||||
|---|---|---|---|---|---|---|---|
| A | Q | N | |||||
| Number Of Sites | Percent of Sites | Number Of Sites | Percent of Sites | Numberof Sites | Percent of Sites | ||
|
Oklahoma |
23
|
7
|
30.4
|
8
|
34.8
|
8
|
34.8
|
|
Oregon |
12 |
7 |
58.3 |
4 |
33.3 |
1 |
8.3 |
|
Pennsylvania |
21 |
11 |
52.4 |
9 |
42.9 |
1 |
4.8 |
|
Rhode Island |
1 |
– |
– |
1 |
100.0 |
– |
– |
|
South Carolina |
9 |
– |
– |
7 |
77.8 |
2 |
22.2 |
|
South Dakota |
16 |
1 |
6.3 |
2 |
12.5 |
13 |
81.3 |
|
Tennessee |
16 |
1 |
6.3 |
10 |
62.5 |
5 |
31.3 |
|
Texas |
95 |
1 |
1.1 |
44 |
46.3 |
50 |
52.6 |
|
Utah |
15 |
– |
– |
– |
– |
15 |
100.0 |
|
Vermont |
5 |
3 |
60.0 |
2 |
40.0 |
– |
– |
|
Virginia |
13 |
6 |
46.2 |
5 |
38.5 |
2 |
15.4 |
|
Washington |
21 |
9 |
42.9 |
9 |
42.9 |
3 |
14.3 |
|
West Virginia |
5 |
3 |
60.0 |
– |
– |
2 |
40.0 |
|
Wisconsin |
22 |
3 |
13.6 |
11 |
50.0 |
8 |
36.4 |
|
Wyoming |
14 |
2 |
14.3 |
10 |
71.4 |
2 |
14.3 |
|
Puerto Rico |
4 |
– |
– |
– |
– |
4 |
100.0 |
|
Alberta |
7 |
– |
– |
– |
– |
7 |
100.0 |
|
British Columbia |
4 |
– |
– |
– |
– |
4 |
100.0 |
|
Manitoba |
6 |
– |
– |
4 |
66.7 |
2 |
33.3 |
|
New Brunswick |
4 |
– |
– |
3 |
75.0 |
1 |
25.0 |
|
Newfoundland |
3 |
– |
– |
– |
– |
3 |
100.0 |
|
Nova Scotia |
1 |
1 |
100.0 |
– |
– |
– |
– |
|
Ontario |
7 |
1 |
14.3 |
3 |
42.9 |
3 |
42.9 |
|
Prince Edward Island |
3 |
– |
– |
2 |
66.7 |
1 |
33.3 |
|
Quebec |
11 |
3 |
27.3 |
5 |
45.5 |
3 |
27.3 |
|
Saskatchewan |
8 |
– |
– |
4 |
50.0 |
4 |
50.0 |
|
TOTAL |
890 |
194 |
21.8 |
364 |
40.9 |
332 |
37.3 |
The geographical distribution of the LTPP sites with the acceptable projection confidence code is shown in figure 21. In addition, the sites in figure 21 were identified as "Urban" or "Rural," depending on their highway functional class. Because there were no sites with the acceptable projection confidence code in Alaska, Hawaii, Puerto Rico, and most of the Canadian provinces, these jurisdictions were not included in the figure 21.
Figure 21. Geographical distribution of LTPP sites with acceptable projection confidence codes.
Table 13 provides an overview of the traffic characteristics for the 558 LTPP sites with the acceptable and questionable projection confidence codes.
The minimum AADT truck volume ranges from 30 trucks per day for a site located on rural minor collector highways to 6310 trucks per day for a site located on an urban interstate. The mean annual growth of truck volumes during the period of 1994 to 1998, disregarding one site on rural minor collector highway, ranged from 6.5 percent for urban freeways and expressways to 3.0 percent for rural minor arterial highways.
The TFs provided in table 13 show considerable variation within different highway functional classes, particularly for interstates and principal arterial highways. A part of the variation in TFs can be attributed to the influence of the site–specific pavement type and pavement thickness used in the ESAL calculation.
The vehicle class distribution for LTPP sites with acceptable and questionable projection confidence codes for different highway functional classes is shown in table 14 and in figures 22 and 23. (Vehicle classes were defined in table 1.) As expected, Class 9 vehicles (5–axle single trailer trucks) dominate vehicle class distribution on interstates and other major highways. On rural major collector and rural minor arterial highways, the dominant truck class is 5 (2–axle single unit trucks).
Of the 10 vehicle classes representing buses and trucks, classes 5, 6, 8, and 9 typically account for more than 90 percent of all vehicles. Vehicles in the remaining classes (4, 7, 10, 11, 12, and 13) are typically less than 3 percent, on average.
Table 14 also shows the mean and standard deviation (SD) for unclassified vehicles (Vehicle Class 14). The mean number of unclassified vehicles has not exceeded 7 percent for any functional class. However, the percentage of unclassified vehicles on some individual sites and for some years was considerably higher. Also, data presented in table 14 are only for sites with acceptable and questionable projection confidence codes.
Vehicle classification data presented in table 14 and in figures
22 and 23 are useful for assessing whether the truck distribution
data are reasonable and for estimating truck class distributions if
site–specific data are not available.
Table 13. Traffic characteristics of LTPP
sites with acceptable
and questionable projection confidence codes.
| AADT Truck Volumes (1998 or Last Projection Year) | |||||
|---|---|---|---|---|---|
| FHWA Highway Functional Class | Number of Sites | Mean | Standard Deviation (SD) | Min. | Max. |
|
Rural Principal Arterial–Interstate |
202 |
1921 |
1027 |
160 |
5340 |
|
Rural Principal Arterial–Other |
219 |
558 |
467 |
50 |
4320 |
|
Rural Minor Arterial |
48 |
338 |
274 |
30 |
1100 |
|
Rural Major Collector |
10 |
178 |
151 |
50 |
540 |
|
Rural Minor Collector |
1 |
90 |
n/a |
90 |
90 |
|
Urban Principal Arterial–Interstate |
36 |
1821 |
1155 |
390 |
6310 |
|
Urban Principal Arterial–Other Freeways or Expressways |
14 |
925 |
407 |
270 |
1490 |
|
Urban Other Principal Arterial |
26 |
775 |
654 |
138 |
2920 |
|
Urban Minor Arterial |
2 |
225 |
n/a |
190 |
260 |
| Annual Growth Rate in Truck Volumes (1994 to 1998) | |||||
| FHWA Highway Functional Class | Number of Sites | Mean | SD | Min. | Max. |
|
Rural Principal Arterial–Interstate |
202 |
4.6 |
3.8 |
–17.2 |
17.0 |
|
Rural Principal Arterial–Other |
219 |
3.9 |
3.9 |
–10.8 |
21.2 |
|
Rural Minor Arterial |
48 |
3.0 |
4.2 |
–13.8 |
14.1 |
|
Rural Major Collector |
10 |
3.8 |
3.2 |
0.0 |
11.4 |
|
Rural Minor Collector |
1 |
0.0 |
n/a |
0.0 |
0.0 |
|
Urban Principal Arterial–Interstate |
36 |
4.6 |
3.2 |
0.0 |
12.0 |
|
Urban Principal Arterial–Other Freeways or Expressways |
14 |
6.4 |
5.3 |
1.2 |
22.0 |
|
Urban Other Principal Arterial |
26 |
3.3 |
4.4 |
–7.5 |
11.4 |
|
Urban Minor Arterial |
2 |
3.5 |
n/a |
2.0 |
5.1 |
| Truck Factor | |||||
| FHWA Highway Functional Class | Number of Sites | Mean | SD | Min. | Max. |
|
Rural Principal Arterial–Interstate |
202 |
1.3 |
0.5 |
0.4 |
3.0 |
|
Rural Principal Arterial–Other |
219 |
0.9 |
0.5 |
0.2 |
4.8 |
|
Rural Minor Arterial |
48 |
0.7 |
0.3 |
0.3 |
1.7 |
|
Rural Major Collector |
10 |
0.8 |
0.4 |
0.3 |
1.5 |
|
Rural Minor Collector |
1 |
0.8 |
n/a |
0.8 |
0.8 |
|
Urban Principal Arterial–Interstate |
36 |
1.1 |
0.4 |
0.5 |
2.1 |
|
Urban Principal Arterial–Other Freeways or Expressways |
14 |
0.9 |
0.4 |
0.4 |
1.6 |
|
Urban Other Principal Arterial |
26 |
0.9 |
0.4 |
0.2 |
2.5 |
|
Urban Minor Arterial |
2 |
0.5 |
n/a |
0.5 |
0.6 |
Table 14. Truck class distribution by
highway functional classes for LTPP sites with
acceptable and questionable projection confidence
codes.
| Highway Functional Class | Number of Sites | Statistic | Vehicle Class | ||||||||||
|---|---|---|---|---|---|---|---|---|---|---|---|---|---|
| 4 | 5 | 6 | 7 | 8 | 9 | 10 | 11 | 12 | 13 | 14 | |||
|
Rural Principal Arterial–Interstate |
202 |
Mean |
1.7 |
12.3 |
3.7 |
0.4 |
7.8 |
60.3 |
2.4 |
4.6 |
1.1 |
2.9 |
1.9 |
|
SD |
1.6 |
8.7 |
3.4 |
0.7 |
4.8 |
17.0 |
4.4 |
3.7 |
1.6 |
5.1 |
5.9 |
||
|
Rural Principal Arterial–Other |
219 |
Mean |
2.6 |
21.9 |
7.5 |
0.8 |
9.3 |
45.2 |
2.8 |
1.8 |
0.5 |
2.0 |
5.4 |
|
SD |
3.4 |
12.3 |
5.6 |
1.3 |
6.0 |
17.9 |
4.3 |
4.5 |
0.8 |
4.0 |
11.8 |
||
|
Rural Major Collector |
48 |
Mean |
3.2 |
36.7 |
15.0 |
3.4 |
7.5 |
25.8 |
2.6 |
0.5 |
0.3 |
6.7 |
0.1 |
|
SD |
4.1 |
19.3 |
8.9 |
3.5 |
4.4 |
13.1 |
2.6 |
0.7 |
0.6 |
19.8 |
0.6 |
||
|
Rural Minor Arterial |
10 |
Mean |
3.2 |
35.2 |
9.2 |
1.0 |
10.6 |
29.5 |
2.5 |
1.3 |
1.1 |
2.8 |
4.7 |
|
SD |
3.8 |
21.5 |
5.9 |
1.0 |
8.3 |
16.7 |
3.2 |
2.8 |
6.6 |
5.1 |
8.1 |
||
|
Rural Minor Collector |
1 |
Mean |
2.0 |
22.2 |
7.2 |
0.0 |
13.9 |
54.2 |
0.5 |
0.0 |
0.0 |
0.0 |
0.0 |
|
Urban Principal Arterial–Interstate |
36 |
Mean |
3.2 |
19.6 |
10.3 |
1.3 |
11.3 |
44.6 |
2.3 |
2.1 |
0.8 |
1.3 |
3.2 |
|
SD |
2.6 |
12.2 |
8.1 |
1.7 |
10.0 |
16.8 |
2.6 |
1.9 |
1.8 |
2.8 |
9.4 |
||
|
Urban Principal Arterial–Other Freeways or Expressways |
14 |
Mean |
4.5 |
23.8 |
8.3 |
3.2 |
7.9 |
41.6 |
1.5 |
2.5 |
0.3 |
0.4 |
3.1 |
|
SD |
7.3 |
9.7 |
3.3 |
5.0 |
4.0 |
17.3 |
1.9 |
2.5 |
0.6 |
1.7 |
6.7 |
||
|
Urban Other Principal Arterial |
26 |
Mean |
3.0 |
26.5 |
9.6 |
1.3 |
11.0 |
35.2 |
3.0 |
1.8 |
0.5 |
2.4 |
4.8 |
|
SD |
2.6 |
15.1 |
5.5 |
1.5 |
8.0 |
15.5 |
3.4 |
2.0 |
0.8 |
3.4 |
10.9 |
||
|
Urban Minor Arterial |
2 |
Mean |
4.9 |
31.3 |
9.6 |
0.1 |
9.0 |
23.4 |
6.3 |
0.5 |
1.1 |
6.9 |
6.9 |
Note: Not included are rural minor collector and rural local collector because of insufficient data.
Figure 22. Mean vehicle class
distribution for LTPP sites with acceptable and
questionable projection confidence codes located on rural
highways.
Note: Not included is urban minor arterial because of insufficient data.
Figure 23. Mean vehicle class
distribution for LTPP sites with acceptable
and questionable projection confidence codes located on urban
highways.
A historical perspective on the availability of monitoring axle load data is provided in table 15 and figure 24. Table 15 shows the number of sites for which axle load distributions are stored in the IMS database for specific years, and the corresponding number of sites with axle load distributions that were used for the projection. For example, in 1993, there were 446 sites in the IMS database that had (monitoring) annual axle load spectra. Of these 446 sites, 94 (21.1 percent) have axle load spectra that could be used for projections yielding the acceptable projection confidenece code and 137 (30.7 percent) have axle load spectra yielding traffic projections with the Questionable projection confidence code. In total, 231 sites (51.8 percent) had axle load spectra yielding acceptable or questionable traffic projections.
Data given in table 15 are plotted in figure 24 to illustrate the overall historical trend in the available axle load spectra. After the peak of 446 sites was reached in 1993, the number of sites with existing axle load spectra declined to 287 sites in 1998. These numbers refer to the existence of the spectra only. The number of spectra that could be used for the projection of axle loads declined from the peak of 231 sections in 1993 to 150 sections in 1998. In other words, in 1998, of the 890 sites, only 150 (16.8 percent) had axle load spectra that could be used for projection of axle loads yielding acceptable or questionable projections. Only 51 sites in 1998 (5.7 percent of all sites) had axle loads yielding acceptable axle load projections.
The ratio between axle load spectra available in the database and the axle load spectra that were used for the projection has been relatively constant over the years and was in therange of about 52 to 56 percent. For example, in 1991, 201 sites had axle load spectra in the database; of these, 109 sites (54.2 percent) were used for the projection of axle loads. The corresponding percentage in 1998 was 52.3. In other words, just over 50 percent of annual axle load spectra obtained by WIM scale measurements could be used in the projection. That this percentage is not improving with time indicates the need to improve the quality of traffic data.
According to figure 20, 543 of 890 sites (61 percent) had axle load spectra yielding acceptable or questionable projections. This percentage is higher than the percentages reported in table 15. The higher percentages reported in table 7 resulted from combining several annual axle load spectra to obtain traffic projections for one site.
For the sites with acceptable and questionable projection confidence codes, the number of years with annual axle load data per site varied from 1 to 8. On average, about 4.5 years of annual data were available for each site, and about 2.8 years of annual data were used for the computation of the base annual spectra.
The steady decline in the amount of monitoring axle load data shown in figure 24 highlights the need for renewed data collection efforts. It also highlights the importance of traffic modeling and projections, and the need for the proposed LTPP PLG for estimating traffic loads on LTPP sites without site–specific truck class and axle load distributions.
Table 15. Availability of annual axle weight data and their use for projection.
| Annual Axle Load Spectra | Number of Sites | ||||||||||
|---|---|---|---|---|---|---|---|---|---|---|---|
| 1990 | 1991 | 1992 | 1993 | 1994 | 1995 | 1996 | 1997 | 1998 | Total | ||
|
Available in IMS |
58 |
201 |
314 |
446 |
410 |
412 |
383 |
370 |
287 |
2881 |
|
|
Used for Projection |
Conf. Code A |
9 |
33 |
76 |
94 |
109 |
106 |
88 |
82 |
51 |
648 |
|
Conf. Code Q |
17 |
76 |
93 |
137 |
120 |
124 |
112 |
121 |
99 |
899 |
|
|
Total |
26 |
109 |
169 |
231 |
229 |
230 |
200 |
203 |
150 |
1547 |
|
|
Total Percent Used for Projection |
44.8 |
54.2 |
53.8 |
51.8 |
55.9 |
55.8 |
52.2 |
54.9 |
52.3 |
53.7 |
|
Figure 24. Trends in the number of monitoring axle load spectra.
Questionable or missing data identified during the study were reported to FHWA using data analysis/operations feedback reports. The feedback reports are not concerned with engineering validity of the data, but only with issues connected with data storage and operations. Table 16 provides a list of data analysis/operations items identified in the course of the study and provides recommendations to resolve problems.
Table 16. Summary of data analysis/operations feedback reports prepared during the study.
| Report Number | Subject | Recommended Action |
|---|---|---|
|
ERES_BW_82 |
"Zero" data in table TRF_MONITOR_AXLE_DISTRIB |
(1) Use "null" data type for future data processing when no axle count data are available; (2) review records that are already in the IMS table TRF_MONITOR_AXLE_DISTRIB and eliminate years where all axle count records are set to "zero" or change data type from "zero" to "null." |
|
ERES_BW_99 |
Multiple monitoring traffic data entries for the same year |
The identified records with multiple entries should be deleted.Only records with the highest modification numbers should be left in IMS data tables. |
|
ERES_BW_100 |
Missing data in the TRF_MONITOR_BASIC_INFO table |
The identified records should be reviewed and either added to the TRF_MONITOR_BASIC_INFO table or excluded from the TRF_MONITOR_AXLE_DISTRIB and TRF_MONITOR_VEHICLE_DISTRIB tables. |
|
ERES_BW_101 |
All–zero traffic data entries in the TRF_MONITOR_* tables |
The identified records should be reviewed and either added to the TRF_MONITOR_BASIC_INFO table or excluded from the TRF_MONITOR_AXLE_DISTRIB and TRF_MONITOR_VEHICLE_DISTRIB tables. |
|
ERES_BW_102 |
Missing records in TRF_EST_ANL_TOT_LTPP_LN table |
RCOs should review the identified records and the TRF_EST_ANL_TOT_LTPP_LN table should be updated. |
|
ERES_BW_103 |
Missing records in TRF_BASIC_INFO table |
The identified GPS sites and SPS experiments should be reviewed by RCOs and the TRF_BASIC_INFO table should be updated. |
|
ERES_BW_107 |
Sites with questionable pavement types in 1998 in table TRF_MONITOR_BASIC_INFO |
The identified records should be reviewed and the IMS table TRF_MONITOR_BASIC_INFO should be updated. |
|
ERES_BW_108 |
Sites with questionable class distribution in TRF_MONITOR_VEHICLE_DISTRIB table |
The identified records should be reviewed and updated or deleted from the IMS table TRF_MONITOR_VEHICLE_DISTRIB. |
|
ERES_BW_109 |
Sites with extremely low axle load counts in IMS table TRF_MONITOR_AXLE_DISTRIB |
The identified records should be reviewed and updated or deleted from the IMS table TRF_MONITOR_VEHICLE_DISTRIB. |
| Previous | Table of Contents | Next |