U.S. Department of Transportation
Federal Highway Administration
1200 New Jersey Avenue, SE
Washington, DC 20590
202-366-4000
Federal Highway Administration Research and Technology
Coordinating, Developing, and Delivering Highway Transportation Innovations
 |
| This report is an archived publication and may contain dated technical, contact, and link information |
|
Publication Number: FHWA-RD-03-094
Date: March 2005 |
||||||||||||||||||||||||||||||||||||||||||||||||||||||||||||||||||||||||||||||||||||||||||||||||||||||||||||||||||||||||||||||||||||||||||||||||||||||||||||||||||||||||||||||||||||||||||||||||||||||||||||||||||||||||||||||||||||||||||||||||||||||||||||||||||||||||||||||||||||||||||||||||||||||||||||||||||||||||||||||||||||||||||||||||||||||||||||||||||||||||||||||
Estimating Cumulative Traffic Loads, Volume II: |
||||||||||||||||||||||||||||||||||||||||||||||||||||||||||||||||||||||||||||||||||||||||||||||||||||||||||||||||||||||||||||||||||||||||||||||||||||||||||||||||||||||||||||||||||||||||||||||||||||||||||||||||||||||||||||||||||||||||||||||||||||||||||||||||||||||||||||||||||||||||||||||||||||||||||||||||||||||||||||||||||||||||||||||||||||||||||||||||||||||||||||||
 |
(3)
|
Where:
|
ESALs year
|
= | Total annual number of ESALs for a base year. |
|---|---|---|
| i | = | Truck class number. |
| n | = | Number of truck classes. |
| ADTVi | = | Average daily volume of truck class i. |
| TFi | = | Truck factor for truck class i. |
| 365 | = | Constant to convert daily traffic to annual traffic. |
To obtain the number of ESALs for an entire pavement design period, the annual number of ESALs estimated for a base year is factored to account for traffic that will occur during the entire design pavement service period.
For LTPP traffic projection purposes, the projection is not done in terms of ESALs but in terms of axle load spectra. Thus, instead of the representative TFs for different truck classes used in equation 3, we need to use the representative axle load spectra for different truck classes. The overall concept of classifying trucks into classes, assigning a representative load–related factor to each truck class (i.e., axle load spectra or TFs), and combining the result remains the same.
Using the axle load spectra instead of TFs, equation 3 can be written as follows.
|
|
(4)
|
Where:
|
ALS year
|
= | (Annual) combined axle load spectra (for single, tandem, triple axles) for a base year. |
|---|---|---|
| i | = | Truck class number. |
| n | = | Number of truck classes. |
| ADTVi | = | Average daily volume of truck class i. |
| RTSi | = | Representative axle load spectrum for truck class i. |
| 365 | = | Constant to convert daily traffic to annual traffic. |
To obtain annual axle load spectra for the entire pavement design period, the annual axle load spectra estimated for the base year are factored to account for traffic that will occur during the entire pavement design period.
Equation 4 is an abbreviated expression intended to demonstrate the similarity between the use of ESALs and TFs on the one hand, and the use of axle load spectra on the other. The variable ALSyear represents three separate arrays for single, tandem, and triple axle spectra. (There is no array for quadruple axles\ spectrum because the LTPP traffic data do not contain any data for quadruple axles.) RTSi represents three arrays for each truck class i, as shown in equation 5.
 |
(5)
|
The Si, Di, and Ti are arrays for single, tandem, and triple axle spectra, respectively. They are defined for each truck class i according to equations 6, 7, and 8.
|
Si =
siai
|
(6)
|
|
|
Di =
dibi
|
(7)
|
|
|
Ti =
tici
|
(8)
|
Where:
|
Si |
= | Adjusted normalized axle load spectrum for single axles (an array containing the number of single axles belonging to each of the pre–defined load categories for single axles). |
|---|---|---|
|
si |
= | Array containing normalized single axle load spectra for vehicles class i. |
|
ai
|
= | Single–axle coefficient (number of single axles per vehicle) for vehicle class i. |
|
Di, Ti |
= | Adjusted normalized axle load spectra for tandem and triple axles, respectively. |
|
di, ti
|
= | Arrays containing normalized tandem and triple axle load spectra, respectively. |
|
bi, ci |
= | Tandem and triple axle coefficients, respectively. |
The adjusted normalized load spectra used in arrays Si, Di, and Ti are expressed as the product of normalized spectra and axle–per–class coefficients. The normalized spectra contain proportions of axle loads that occur within designated load ranges. The axle–per–class coefficients are required to obtain actual axle load spectra from the normalized spectra. The calculation procedure embodied in equations 3 through 8 corresponds to the calculation procedure developed for Category 3 and 4 sites in Phase 1.[1]
The use of axle load spectra as the basic traffic characteristics for pavement design is relatively new and presents several challenges:
The PLG is intended to overcome these challenges to computation and data comparison. The PLG will also contain a catalogue of typical benchmark values and characteristics of axle load spectra, as well as software to display, compare, and combine axle load spectra, and to calculate annual cumulative axle load spectra.
This section contains a detailed description of the main functions and features of the proposed PLG. The functionality of the PLG and its design parameters have been formulated to meet the objectives of the PLG presented previously. Briefly, the main purpose of the PLG is to facilitate traffic loading projections for LTPP sites without site–specific traffic data. To meet the objectives of the PLG, the PLG will support the following main functions:
An overview of the PLG functions is presented in figure 31.
Figure 31. Overview of PLG functions.
The LTPP databases (IMS and CTDB) contain all LTPP traffic data submitted by participating agencies that have passed basic data QA checks. During the course of this project, large amounts of traffic data stored in the IMS were identified by the project team and by the participating agencies as being of dubious quality. Consequently, not all IMS and CTDB data should be part of the PLG, as the PLG data will be used for the estimation of traffic loads at other LTPP sites and need to be of high quality. All traffic data stored in the LTPP databases should be verified using a comprehensive QA process that would identify and remove dubious and nonsensical data. In the absence of such QA process, the only data that should be included in the PLG database at present (that is, if the development of the PLG were to commence prior to the proposed comprehensive traffic data QA process) are those that were used to produce traffic load projections assigned the acceptable projection confidence code. The inclusion of only verified or "acceptable" data in the PLG is one of the main distinctions between the PLG and the DataPave software.[18]
The data stored in the PLG will be of two origins:
Regardless of the origin, the data stored in the proposed PLG will be of four types: supporting data, monitoring traffic data, projected traffic data, and generic or typical traffic data.
Variables that will be stored in the PLG to support its functionality are described below and summarized in table 17.
Supporting data are non–traffic data required for the identification and retrieval of traffic data. Supporting data stored in the PLG will include:
Monitoring traffic data are data derived from AVC and WIM measurements, and are typically annual data reported for a specific year. Monitoring traffic data stored in the PLG will include:
Table 17. List of main variables stored in PLG.
| FHWA Highway Functional Type | Truck Traffic Classification (TTC) of Highways | FHWA Vehicle Classes 4 through 13 | Classes 4 through 13 Combined | |
|---|---|---|---|---|
| Class 4 | Classes 5, 6, 7–13 | |||
|
Rural Interstates |
TTC 1 |
|
Same for other vehicle classes (including triple and quad axle groups, if appropriate) |
|
|
TTC 2 through TTC 17 |
Repeated for other TTC categories |
|||
| Repeated for other highway functional types | ||||
|
Urban Collector |
TTC 1 through TTC 17 |
[As Above] |
[As Above] |
[As Above] |
Projected traffic data are data derived from monitoring data. Projected traffic data stored in the PLG will include:
Generic traffic data are typical or default traffic data. Unlike monitoring and projected traffic data that are tied to the specific LTPP and other traffic sites, generic data will be provided only for highway functional classes. For the purposes of the PLG, the 11 highway functional classes (6 rural and 5 urban) currently used by the LTPP may need to be further subdivided.
Generic traffic data items stored in the PLG will be similar to the projected traffic data items listed above. However, generic traffic data will not be "base" data but "typical" data.
The following notes apply to monitoring, projected, and generic traffic data stored in the proposed PLG:
In many respects, the selection, sorting, and retrieval functions of the PLG will be similar to corresponding functions in DataPave.[18] In view of the popularity of DataPave software, and of similar needs to select, sort, and retrieve LTPP data, the user interface of the PLG software and DataPave will be similar. This will make it easier for users to become proficient in using either software package.
Basic site and data selection, sorting, and display functions will include the following modules:
To supplement the resident PLG data with the user–supplied data, the user will have the option to import additional data into the PLG. User–supplied data may be particularly useful if site–specific LTPP data are missing. For example, some highway agencies have reported monitoring axle weight data that were collected on the LTPP sites during time periods shorter than 24 consecutive hours. Such data have not been included in the LTPP database and, consequently, will not be transferred from the LTPP to the PLG. Yet the use of this type of site–specific data is probably preferable to the use of site–related or regional data.
The storage of user–supplied data may be temporary or permanent. The permanent storage of user–supplied data has the advantage of customizing the PLG with local data that can be used in the future. The PLG database will distinguish between the LTPP and user–supplied data.
Appropriate functions will be developed to export data stored in the PLG, as well as traffic projections developed through the PLG, for subsequent use.
The comparison and assessment function facilitates cross–comparison and evaluation of axle load spectra, and other traffic data. It builds on the PLG's data–storage, selection, sorting, and retrieval functions. Whereas the retrieval function will typically display data for one section at the time, the comparison and assessment function will display data for several sections simultaneously. The comparison and assessment function is unique to the PLG, and will enhance the traffic data assessment and projection by helping the user to:
The comparison and assessment function should include the following capabilities:
Many features of the data–selection, sorting, retrieval, and comparison and assessment functions were implemented in the prototype PLG demonstration software.
The PLG will contain guidelines for developing missing truck class distributions (required for Category 4 sites) and axle load spectra for individual truck classes (required for Category 3 and 4 sites), and a mechanism for calculating base annual and cumulative axle load spectra.
The user will have several options to develop truck class distributions required for Category 4 sites: direct input of truck class distributions, use of truck class distributions for the selected LTPP sites, and use of generic truck class distributions.
Direct Input of Truck Class Distribution –For some LTPP sites, additional truck class distribution data (i.e., data not included in the LTPP traffic database) may be available. Also, in some situations, it may be preferable to modify truck distributions developed by analyzing truck distributions on similar sites or suggested by the generic truck class distribution data. Table 18 provides an example of truck class distribution and contains a provision to accommodate an additional truck type designated as "special."
Table 18. Example of truck class distribution.
| FHWA Vehicle Class Number | |||||||||||
|---|---|---|---|---|---|---|---|---|---|---|---|
|
4 |
5 |
6 |
7 |
8 |
9 |
10 |
11 |
12 |
13 |
Special |
|
| Fraction of Commercial Vehicles | |||||||||||
|
0.01 |
0.11 |
0.06 |
0.00 |
0.10 |
0.65 |
0.01 |
0.03 |
0.02 |
0.01 |
0.00 |
|
Truck Class Distributions for Selected Sites–The estimation of a missing truck class distribution would typically utilize site–related data or data on similar sites in the same agency. The user will be able to employ the comparison and assessment function to display the data for the selected sites graphically, and to calculate the means of the selected truck class distributions.
Generic Truck Class Distribution–The use of generic truck class distributions is an option if there are no suitable surrogate truck class distribution data from other (nearby or regional) sites. Generic truck class distributions will be provided for all highway functional classes.
The user will have three options to develop axle load spectra for the individual truck classes required for Category 3 and 4 sites: direct input of axle load spectra, use of axle load spectra for selected sites, and use of generic axle load spectra. The direct input of axle load spectra and the use of axle load spectra for selected sites would use similar procedures to select and modify surrogate data as outlined for the selection of truck class distributions. Development of the axle load spectra will be also facilitated by the comparison and assessment function of the PLG.
It is important to allow the user to make adjustments to the truck class and axle load distributions using data from other sites or using generic data. Users may have various bits of information about the composition of traffic stream that could improve the estimates (for example, the proportion of short and long trucks, or the number of buses using an urban highway).
The calculation of the projected traffic data, such as the annual base spectra or cumulative axle load estimates, can be accomplished by using the existing LTPP traffic projection procedures. However, before exporting the projected traffic data from the PLG for subsequent use, the user may want to see the overall results of the traffic projection process expressed in terms of ESALs, and have the option of carrying out sensitivity analysis by quantifying the consequences of selecting different truck class and axle load distributions.
In addition, the knowledge of the overall traffic projection results (for example the average TF or the annual number of ESALs) will provide valuable feedback to the process of selecting truck class and axle load distributions, and provide additional assurance to the analyst that the traffic projection results are sound. Consequently, the option to calculate the projected traffic data within the PLG is required and should be implemented.
Extensive additional statistical and engineering analyses are needed to develop generic truck characteristics (in terms of truck class and axle load distributions), and guidelines for the use of the generic and other non–site specific truck characteristics in the projection procedure. These analyses will use LTPP and other traffic data.
The main features of this effort may include the development of: a new highway classification system; generic truck class distributions and generic axle load spectra for individual truck classes; and guidelines for judicious selection of missing truck class and axle load distributions for Category 3 and 4 sites.
Generic traffic data will be defined for typical highway functional classes. At present, the LTPP sites are classified into the six rural highway functional classes and five urban functional classes listed below:
These classes are broad and have a universal applicability. However, they may not be specific enough for the projection of traffic loads. The development of LTPP functional classes for the projection of traffic should be based on the assessment of commonalities in truck class and axle load distributions among LTPP sites. Consideration should also be given to the development of regional highway functional classes.
The number of functional classes for which the generic traffic data will need to be developed may be different from the existing LTPP functional highway classes. For example, the 2002 Pavement Design Guide is expected to use 17 distinct highway classification groups, called Truck Traffic Classifications (TTC):
The development of generic truck class distributions should start with the evaluation of the truck class distributions on all LTPP sections to identify commonalities in the distribution for various highway functional categories.
The development of generic axle load spectra may draw on the parallel between TFs (number of ESALs per truck) and the axle load spectra. The relationship between TFs and axle load spectra for individual truck classes was discussed in the section titled "Conceptual outline of PLG."
There is a body of knowledge dealing with truck axle loads in terms of TFs. Several highway agencies have evaluated the temporal and spatial variation of TFs, and many highway agencies use generic and other TFs in the pavement design process.[19,20] The variation in TFs is to some degree indicative of the variation in the corresponding axle load spectra. However, our current understanding of the expected axle load spectra on different class highways is limited and will need to be developed by an in–depth analysis of LTPP and other traffic data.
The understanding of the variation of truck class and axle load distributions will affect the division of the highway network into highway functional classes. Consequently, the enhancement of the existing LTPP highway functional classes, or the development of new classes, and the development of generic truck class and axle load distributions will need to be interactive.
Guidelines for selecting surrogate truck class and axle load distributions for Category 3 and 4 sites will help a user who is estimating missing data. The guidelines will use new information on the characteristics of truck flows (expected or generic truck class and axle load distributions on characteristic highway links) and the PLG comparison and assessment functions.
To cope with the large amount of traffic data, the proposed PLG will function as a stand–alone software product operating as a relational database with many additional built–in computational and reporting features. Prototype software was developed to illustrate the operation of the PLG.
The development of final PLG software will require, in addition to the programming effort, considerable engineering and analytical effort to develop generic truck class and axle load distributions and provide guidelines for their use. For this reason, the prototype PLG software demonstrated only data–management, comparison, and assessment functions.
This section contains two examples of estimating annual axle loads for all in–service years for LTPP sites using the proposed PLG. One is for Category 3 sites that lack axle load data, the other for Category 4 sites that lack axle load data and truck class distribution data. These examples:
These two examples use the LTPP traffic projection procedure outlined in chapter 2 of this report (and documented in the Phase 1 report), and they assume the existence of the proposed PLG.[1] To estimate the consequences of using surrogate data, the sites selected for the examples actually had site–specific monitoring truck class and axle load distribution data; however, it was assumed that the site–specific data were missing and had to be estimated using surrogate data. Thus, it was possible to compare traffic loads estimated using surrogate data with traffic loads based on site–specific monitoring data. The comparison was done in terms of the annual axle load spectra and the cumulative number of ESALs.
The example of traffic projection for Category 3 sites was based on California LTPP site 068150, located on a two–lane rural minor arterial highway east of Los Angeles, CA. It was assumed that the site had truck class distribution data (annual number of trucks that belong to different vehicle classes) but lacked axle load data. The task was to develop (select) surrogate axle load spectra for individual truck classes and combine them with the known (site–specific) number and type of trucks to calculate annual axle load spectra.
The PLG database can be queried to facilitate the selection of axle load data. This can be done by searching the database for similar sites in California (for example, all sites on rural minor or principal arterial highways) or in other jurisdictions. The search of the prototype PLG database identified two similar California sites with monitoring axle load data (site 062040 located on a two–lane rural principal arterial highway east of San Francisco, CA, and site 066044 located on a four–lane principal arterial highway south of Eureka, CA). The truck class distributions on the three California sites are compared in figure 32, which was produced by the prototype PLG software; it indicates that the truck distributions on the three sites are similar. While the similarity of truck class distributions does not mean the similarity in axle loads, it does provide assurance that the sites serve similar traffic flows and are on highways with similar functional classification.
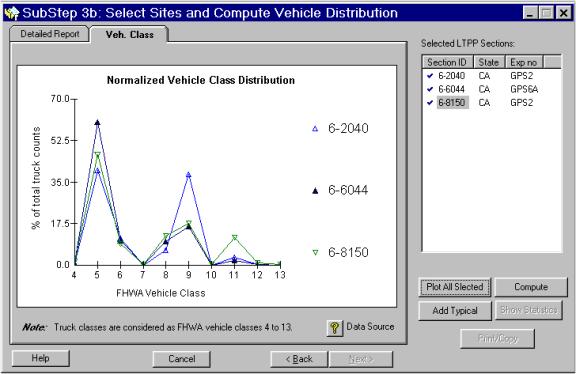
Figure 32. Comparison of truck class distributions for sites 062040, 066044, and 068150.
The required surrogate axle load data are needed as axle load distributions (spectra) for individual truck types. The prototype PLG database was used to compare axle load spectra on nearby sites. An example of the spectra comparison for sites 062040 and 066044 is provided in figures 33 and 34 for single and tandem axles for Class 9 vehicles (5–axle single–trailer trucks), respectively. Also shown in figures 33 and 34 is the surrogate (computed) axle load spectrum for site 068150 obtained as the mean spectrum for sites 062040 and 066044. It should be noted that figures 33 and 34 show the example of axle load spectra for only 1 of the 10 truck types for which the surrogate spectra are required.
The process of assessing available data and selecting surrogate data would benefit from the comparison of the selected spectra (shown in figures 33 and 34) with generic or typical spectra. However, the generic spectra are not available in the prototype PLG.
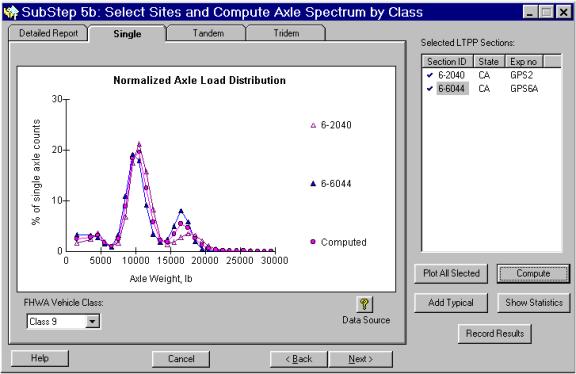
Figure 33. Comparison of single axle load
distributions for vehicle Class 9
for sites 062040 and 066044 with computed mean
distribution.
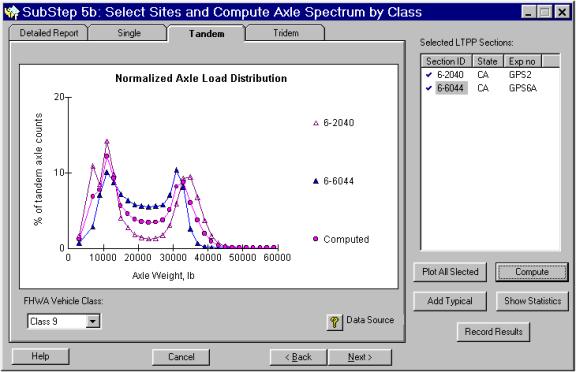
Figure 34. Comparison of tandem axle load
distributions for vehicle
Class 9 for sites 062040 and 066044 with computed mean
distribution.
The annual axle load spectrum for site 068150 was obtained by combining the surrogate axle load spectra for the individual truck classes (expressed as normalized spectra) and the site–specific (classified) annual truck volumes. The resulting estimated annual spectrum for site 068150 is presented in figure 35. The spectrum was obtained by calculations done outside the prototype PLG. Such calculation should be done by the PLG, and the PLG can then be used to compare the calculated annual spectra using surrogate data with annual spectra obtained for nearby sites or with typical spectra. It should be noted that the site–specific spectrum for site 068150 would not exist for Category 3 sites. This is the spectrum that is to be estimated using surrogate data. It has been included in figure 35 for comparison purposes.
The comparison of annual axle load spectra for site 068150 in figure 35 indicates that the actual monitoring spectrum and the estimated surrogate spectrum are quite similar. For example, the three peaks of the single axle load distribution are duplicated quite well. The annual axle load spectrum for site 068150 in figure 35 is for all vehicle classes combined and represents, using the LTPP projection terminology, the base annual spectrum, or surrogate base annual spectrum.
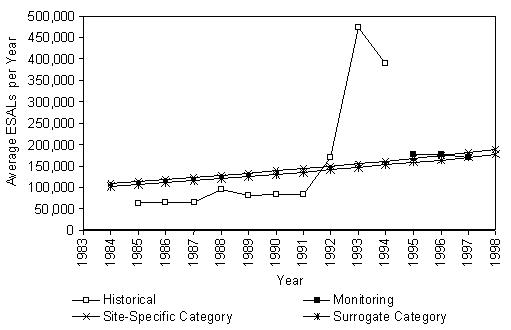
To quantify the consequences of using the surrogate base annual spectrum, the surrogate base annual spectrum was used to calculate the number of cumulative ESALs. The annual base spectrum was combined with the projected growth factor (established previously as part of traffic load projection for site 068150) to obtain annual axle load spectra, and then the annual spectra were expressed in terms of ESALs. The result of this calculation is presented in figure 36, which also shows the corresponding results obtained for monitoring site–specific axle load spectra (labelled Site–Specific Category 2). Figure 36 include a "Projected Annual ESALs" sheet (which was part of site–specific reports described in chapter 2) for site 068150 adapted to also display ESALs estimated using surrogate data.
As already indicated by the similarity of the base annual spectra for Class 9 vehicles (figures 33 and 34), ESALs are also similar. The cumulative number of ESALs using surrogate spectra was 2.06 million, while the corresponding number of ESALs for site–specific spectra was 2.2 million (figure 36).
Arizona site 041017, located in the northbound direction on a four–lane rural interstate south of Tucson, AZ, was used to illustrate the use of the PLG to obtain traffic projection for Category 4 sites. Even though site–specific axle load data were available for this site, it was assumed that these data were not available and that both truck class and axle load distributions had to be estimated. It was assumed that the only available information about truck loads on this site were AADT truck volumes (assumed to be 540 in 1998).
The site selected to obtain surrogate data for the subject site was another Arizona site, 041007, located in the westbound direction of a rural interstate west of Phoenix, AZ. The 1998 annual AADT truck volume on this site, 3525, was approximately 7 times larger than the corresponding truck volume on the subject site. Thus, the two sites are located on different interstates and carry different truck volumes. While it is possible to use data for other sites, or to use a combination of data obtained for several sites, this example demonstrates the use of a single site.

1 lb. = 2.202 kg
Figure 35. Comparison of site–specific and surrogate base annual spectra for site 068150.
| Year | Annual ESALs | |||
|---|---|---|---|---|
| Historical | Monitoring | Projected | ||
| Site–Specific Spectra Category 2 | Surrogate Spectra Category 3 | |||
|
1984 |
– |
– |
108,789 |
102,577 |
|
1985 |
63,000 |
– |
113,118 |
106,714 |
|
1986 |
67,000 |
– |
117,675 |
111,000 |
|
1987 |
67,000 |
– |
122,388 |
115,443 |
|
1988 |
96,000 |
– |
127,274 |
120,124 |
|
1989 |
81,000 |
– |
132,356 |
124,930 |
|
1990 |
83,000 |
– |
137,657 |
129,895 |
|
1991 |
83,000 |
– |
143,154 |
135,134 |
|
1992 |
171,000 |
– |
148,921 |
140,544 |
|
1993 |
473,000 |
– |
154,887 |
146,211 |
|
1994 |
389,000 |
– |
161,068 |
152,068 |
|
1995 |
– |
176,297 |
167,491 |
158,168 |
|
1996 |
– |
177,884 |
174,487 |
164,528 |
|
1997 |
– |
169,527 |
181,354 |
171,104 |
|
1998 |
– |
– |
188,601 |
177,975 |
|
Cumulative ESALs |
2,179,220 |
2,056,415 | ||
Figure 36. Comparison of projected, historical, and monitoring annual ESALs for site 068150.
The truck class distribution for the two sites is compared in figure 37. The data for the subject site shown in figure 37 would not exist for a Category 4 site and are included for comparison purposes only. To determine whether the selected surrogate truck distribution is typical, the PLG will contain not only truck class distributions for other Arizona sites, but also generic or typical truck class distributions for typical highway functional classes.
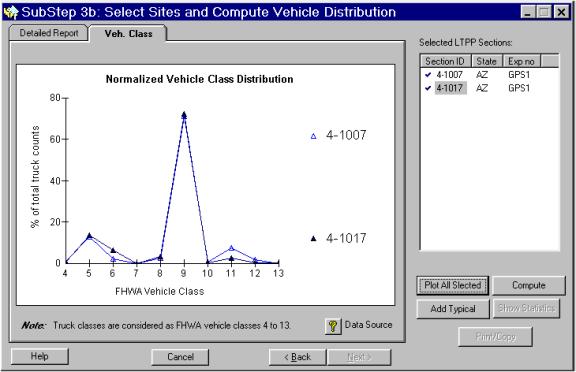
Figure 37. Comparison of truck class distributions for sites 041007 and 041017.
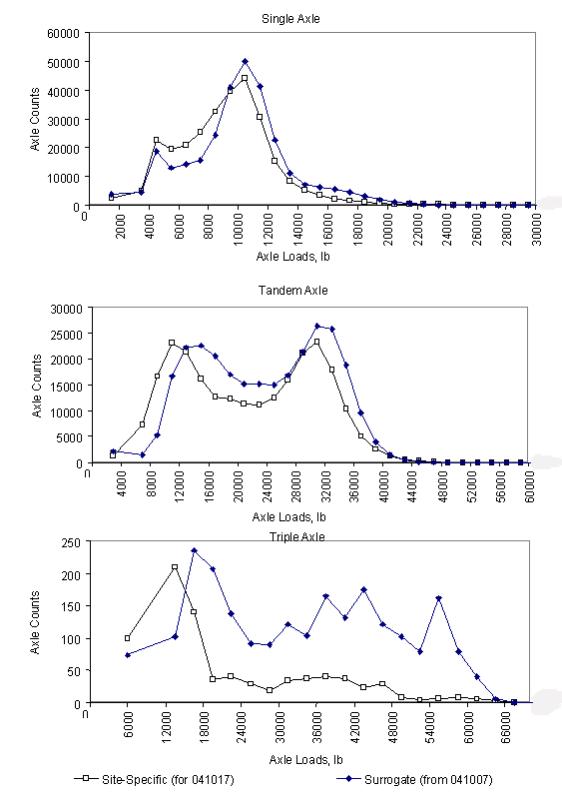
The base annual spectrum for site 041017 was obtained by combining the site–specific annual truck volumes with surrogate truck classification and axle load spectra (for individual vehicle types) obtained from site 041007. The resulting surrogate base annual axle load spectrum is compared with the spectrum obtained using site–specific monitoring axle load data in figure 38.
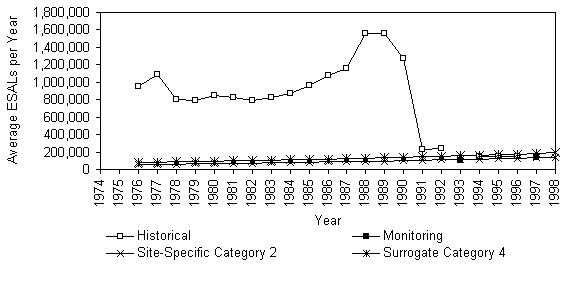
The projected annual spectra for all in–service years are compared, in terms of ESALs, in figure 39. Figure 39 is a "Projected Annual ESALs" sheet for site 041017 also adapted to display ESALs estimated using surrogate data. The results in figures 38 and 39 show a very good agreement between traffic loads estimated using surrogate data and site–specific data. For example, the number of ESALs estimated using site–specific axle load data was 2.1 million, while the number of ESALs estimated using surrogate data was 2.9 million.
The two examples provided in this section indicate that reasonable traffic loading estimates can be obtained by judiciously selecting surrogate data (in the absence of site–specific truck class and axle load data). The relatively close agreement between the site–specific and surrogate projections may leave a false impression that the site–specific axle load data are not important because they can be estimated using surrogate data. While the judicious selection of surrogate data is important, and the proposed PLG can facilitate and guide the selection, surrogate data can never replace site–specific data. Also, the greater the amount of site–specific data, the easier it is to develop appropriate surrogate data.
1 lb = 2.202 kg
| Year | Annual ESAL | |||
|---|---|---|---|---|
| Historical | Monitoring | Projected | ||
| Site–Specific Spectra Category 2 | Surrogate Spectra Category 4 | |||
|
1976 |
948,000 |
– |
58,254 |
80,142 |
|
1977 |
1,089,000 |
– |
60,593 |
83,384 |
|
1978 |
806,000 |
– |
63,011 |
86,725 |
|
1979 |
792,000 |
– |
65,514 |
90,192 |
|
1980 |
849,000 |
– |
68,209 |
93,802 |
|
1981 |
821,000 |
– |
70,925 |
97,594 |
|
1982 |
792,000 |
– |
73,740 |
101,483 |
|
1983 |
821,000 |
– |
76,717 |
105,564 |
|
1984 |
877,000 |
– |
79,785 |
109,804 |
|
1985 |
962,000 |
– |
82,964 |
114,213 |
|
1986 |
1,075,000 |
– |
86,276 |
118,801 |
|
1987 |
1,160,000 |
– |
89,785 |
123,561 |
|
1988 |
1,556,000 |
– |
93,361 |
128,539 |
|
1989 |
1,556,000 |
– |
97,104 |
133,668 |
|
1990 |
1,273,000 |
– |
100,986 |
139,034 |
|
1991 |
230,000 |
– |
105,026 |
144,581 |
|
1992 |
240,000 |
– |
109,220 |
150,414 |
|
1993 |
– |
102,230 |
113,585 |
156,450 |
|
1994 |
150,000 |
– |
118,142 |
162,729 |
|
1995 |
150,000 |
– |
122,857 |
169,267 |
|
1996 |
150,000 |
– |
127,755 |
176,025 |
|
1997 |
– |
132,850 |
133,030 |
183,091 |
|
1998 |
– |
– |
138,279 |
190,454 |
|
Cumulative
|
2,135,118
|
2,939,517
|
||
Figure 39. Comparison of projected, historical, and monitoring annual ESALs for site 041017.
| Previous | Table of Contents | Next |

