U.S. Department of Transportation
Federal Highway Administration
1200 New Jersey Avenue, SE
Washington, DC 20590
202-366-4000


Skip to content
Facebook iconYouTube iconTwitter iconFlickr iconLinkedInInstagram

Federal Highway Administration Research and Technology
Coordinating, Developing, and Delivering Highway Transportation Innovations

Report
This report is an archived publication and may contain dated technical, contact, and link information
breadcrumb
Publication Number: FHWA-HRT-04-079
Date: July 2006

Seasonal Variations in The Moduli of Unbound Pavement Layers

Chapter 6: Application of Research Results to Estimate Seasonal Variations in Moduli of Unbound Pavement Layers

INTRODUCTION

The findings and regression models presented in Chapters 4 and 5 may be applied to estimate backcalculated moduli for a given set of environmental conditions (exclusive of frost effects), and thus, the seasonal variations in the backcalculated moduli of unbound pavement layers. This chapter discusses the application of the regression models discussed in Chapter 5 to predict backcalculated pavement layer moduli for several pavement test sections to demonstrate how the findings of this research might be applied in practice.

Estimating backcalculated modulus is a straightforward computational exercise for a given state of stress (defined by the computed bulk and the octahedral shear stresses) and moisture content when applying the regression models presented in Chapter 5. Application of the models in practice, however, is less straightforward because the state of stress that should be used in the computation is not "given." Rather, the stress state is a function of the layer modulus to be predicted as well as the moduli of the other pavement layers (among other parameters).

For the purposes of the trial application discussed here, the fact that the stress state is unknown is addressed by using an iterative process in which an initial estimate of the modulus is used to estimate the applicable stress state. The estimated stress parameters are in turn used to compute a refined estimate of the modulus. By repeating this process until the moduli computed for two subsequent iterations are essentially identical, both the stress state and the associated modulus may be estimated. The basic steps in the process summarized below; a more detailed discussion of the procedure is provided in the next section.

  1. Establish an initial estimate of the set of pavement layer moduli for the date and time (t) and FWD load (P) for which predictions are desired, E10(t,P), E20(t,P), . . .En0, where E10(t,P) is the estimated modulus for the surface layer, and En0(t,P) is the initial modulus estimate for the deepest (semi–infinite) layer.
  2. Using the estimated moduli, known layer thicknesses and densities, and estimates of Poisson’s ratios, compute the bulk stress and the octahedral shear stress, considering both load-induced and overburden stresses.
  3. Using the computed stress parameters from step 2 and the estimated moisture content for each unbound layer, compute a refined estimate of the modulus for each unbound layer. The second and subsequent approximations of the moduli for bound layers equal the first approximation, as these layers are assumed to be insensitive to variations in stress state (and moisture).
  4. Repeat steps 2 and 3 until the change in the estimated moduli (for all layers) from one iteration to the next is deemed insignificant.

In the trial application, backcalculated moduli for an initial test date are used as the starting point for the computations. Estimated temperature-compatible moduli for the asphalt-bound layers are required, as temperature-induced variations in the modulus of asphalt-bound layers will alter the stress states in the underlying layers. The unadjusted backcalculated moduli for the remaining layers are used as the first approximation of the moduli for those layers.

Four prediction scenarios were considered:

  1. Predictions based on section/layer-specific models derived from the full data set using Model 2B (i.e., those presented in Table 82 in Appendix D).
  2. Two sets of predictions based on section/layer specific models derived using limited data sets
    1. Models derived from data for a single test date, using Model 2 (Equation 29).
    2. Models derived from data for two test dates, using Model 2B (Equation 31).

    The limited data set models were used to explore the feasibility of using section/layer specific models in routine practice. Two-date models allow consideration of the effects of variation in moisture content as well as stress state, whereas the one-date models permit consideration of only stress parameters.

  3. Predictions based on the soil class models presented in Table 43.

The procedures used in the trial application are described in more detail in the next section of this chapter. The results obtained are presented and discussed in the following section.

PROCEDURE FOR PREDICTION OF SEASONAL VARIATIONS IN BACKCALCULATED PAVEMENT LAYER MODULI

Required Input Data

The data elements required for the derivation of section/layer-specific prediction models are defined in Table 45. They include backcalculated pavement layer moduli for several FWD load levels, pavement cross-section information for the computation of the stress parameters, and moisture data.

The data elements required for application of the regression models to predict backcalculated pavement layer moduli are identified in Table 46 and Table 47. The data identified in Table 46 are required in all cases. These data include backcalculated pavement layer moduli and related data for an initial FWD test date and estimates of environmental conditions and temperature compatible moduli for AC-bound layers for the dates/times for which predicted moduli are desired. The data identified in Table 47 are needed only when the soil-class models presented in Table 43 are used to predict the pavement layer moduli. The specific data required for application of the soil class models varies with the extent and classification of the pavement layer material to be considered.

Table 45. Data required for derivation of section/layer-specific models
Data Element Variable Units Notes
FWD load P KN For multiple sets of FWD deflection data for 4 nominal FWD load levels (27, 40, 53, and 71 kN)
Backcalculated layer moduli Ei MPa For i = 1 to n, where n is the total number of layers in the pavement structure, including the subgrade
Mean volumetric moisture content for each pavement layer Vmi decimal fraction For i = 1 to n Not required for one-date (Model 3) models
In situ (wet) layer density ?i kg/m3 For i = 1 to n
Layer thickness hi M For i = 1 to n
Layer Poisson’s ratio µi For i = 1 to n
Depth-to-water table dgwt M

Part 1: Derivation of Section- and Layer-Specific Regression Models

The computational steps used to derive the section/layer-specific limited data set models were as follows.

  1. Computation of Stress Parameters

    For each of the k sets of backcalculated layer moduli and associated FWD load included in the model derivation data set (see Table 45), the vertical and radial load stresses, svlk and srlk, were computed using the CHEVLAY 2 linear layered–elastic analysis program. The stresses were computed for points directly beneath the center of the loaded area, at three–quarters– depth in each unbound layer. The input data required for this computation consist of the FWD load (Pk), and the layer moduli (Ei,k), layer thicknesses, (hi), and Poisson’s ratios (µi ) for each pavement layer.

    Table 46. Data required to predict backcalculated pavement layer moduli
    Data Subset Data Element Variable Units Notes
    Pavement cross section Layer thicknesss hi m For i = 1 to n, where n is the total number of layers in the pavement structure, including the subgrade
    Layer Poisson's ratio µi For i = 1 to n
    Data for initial test date FWD load P kN All observations for the selected initial test date.
    Layer moduli Ei(0) MPa For i = 1 to n
    Estimated parameters for prediction date(s) Estimated mean volumetric moisture content Vmi(t) For i = 1 to n, expressed as decimal fraction. Obtain via simulation with the EICM[19] or estimate through other means
    In situ (wet) layer density ?i(t) kg/m3 For i = 1 to n
    Estimated water table depth dgwt(t) m
    Estimated temperature compatible modulus for asphalt-bound layers Ei(t) MPa For all layers, i, composed of asphalt-bound materials
    1. The in situ density, layer thickness, and water table depth data were used to compute the effective vertical and radial overburden stresses svok’and srok’ at three-quarters depth in the layer of interest, as outlined in Figure 42. K0 was assumed to be 1.0 in these computations.
    2. The octahedral shear and bulk stresses, ?k and tk, were computed as

      Octahedral shear stress sub K equals one-third times the square root of 2 times the square of (open first parenthesis) (open second parenthesis) vertical load stress plus the vertical overburden stress (close second parenthesis) minus (open third parenthesis) radial load stress plus radial overburden stress (close third parenthesis) (close first parenthesis). (34)

      Bulk shear stress sub K equals 2 times the sum of (open first parenthesis) radial load stress plus radial overburden stress (close first parenthesis) plus (open second parenthesis) vertical load stress plus vertical overburden stress (close second parenthesis). (35)

      Table 47. Soil parameters required for application of soil class models to predict backcalculated pavement layer moduli
      Layer Extent and Classification Required Soil Parameters
      All AASHTO Soil Class
      Finite A–1–a
      Finite A–1–b
      Finite A–3
      Finite A–4
      Semi–infinite A–1–b
      Semi–infinite A–2–4
      Semi–infinite A–3
      Dry density (kg/m3)
      Gradation (percent retained on the No. 10 sieve and
      percent passing 200)
      Finite A–2–6 layers Dry density (kg/m3)
      Laboratory optimum density (kg/m3)
      D60
      Finite A–2–4 Dry density (kg/m3)
      Laboratory optimum density (kg/m3)
      Gradation (% passing 200, D80, D60, D40, D20, D10)
      Plasticity Index
  2. Derivation of Model Coefficients

    Using the stress parameters computed in step 1, the backcalculated layer moduli, and (for the 2-date models) the in situ moisture contents as input, multiple regression was used to derive the coefficients for the models:

    Elastic modulus divided by atmospheric pressure is equal to regression constant 1 times 10 to the open parenthesis regression constant 2 divided by atmospheric pressure close parenthesis times open first parenthesis open second parenthesis shear stress divided by atmospheric pressure close second parenthesis plus 1 close first parenthesis to the regression constant 3. (36)

    Elastic modulus divided by atmospheric pressure is equal to regression coefficient times 10 to the open bracket open parenthesis regression coefficient C sub 1 times volumetric moisture content close parenthesis plus open parenthesis regression coefficient C sub 2 plus log of regression coefficient C sub 2 times volumetric moisture content close parenthesis times open parenthesis bulk stress divided by atmospheric pressure close parenthesis close bracket times open first parenthesis open second parenthesis shear stress divided by atmospheric pressure close second parenthesis plus 1 close first parenthesis to the open bracket regression coefficient C sub 3 plus open parenthesis log of regression coefficient C sub 3 times volumetric moistures content divided by 100 close parenthesis close bracket. (37)

    For regression purposes, the log-transformed versions of the models were used:

    The log of elastic modulus divided by atmospheric pressure is equal to the log of regression constant 1 plus regression constant 2 times bulk stress divided by atmospheric pressure plus regression constant 3 times the log of open first parenthesis open second parenthesis shear stress divided by atmospheric pressure close second parenthesis plus 1 close first parenthesis. (38)

    The log of (open first parenthesis) elastic modulus divided by atmospheric pressure (close first parenthesis) is equal to the log of regression coefficient C sub 0 plus regression coefficient C sub 1 times volumetric moistures content plus regression coefficient C sub 2 times (open second parenthesis) bulk stress divided by atmospheric pressure (close second parenthesis) plus the log of regression coefficient C sub 2 times volumetric moistures content times (open third parenthesis) bulk stress divided by atmospheric pressure (close third parenthesis) plus regression coefficient C sub 3 times the log of (open fourth parenthesis) shear stress divided by atmospheric pressure plus 1 (close fourth parenthesis) plus the log of regression coefficient C sub 3 times volumetric moistures content times the log of (open fifth parenthesis) shear stress divided by atmospheric pressure plus 1 (close fifth parenthesis). (39)

    Figure 42. Calculation of overburden stress

    The figure shows a diagram on how to calculate overburden stress. It begins with a drawing of two bidirectional arrows, between which are three lines labeled, from top to bottom, H subscript 1, rho subscript 1; H subscript 2, rho subscript 2; and H subscript I, rho subscript I. The left arrow is labeled D parenthesis P subscript K, close parenthesis, and the right arrow is labeled D subscript G W T. A fourth line is labeled below this drawing; H subscript N equals infinity, rho subscript N. For a point P subscript K in layer J, the total vertical overburden stress sigma subscript V O is computed as sigma subscript V O parenthesis P subscript K, close parenthesis, equals G times the following: sigma I equals 1 to J minus 1 of H subscript I, rho subscript I, plus the sum of D parenthesis P subscript K minus sigma I equals 1 to J minus 1 of H subscript I, times rho subscript J. For points above the water table, i.e., D parenthesis P subscript K, close parenthesis, is less than or equal to D subscript G W T, the effective overburden stress is taken to be equal to the total overburden stress, i.e., pore pressure effects in partially saturated soils are neglected: sigma prime subscript VO parenthesis P subscript K close parenthesis equals sigma subscript V O parenthesis P subscript K, close parenthesis. For points below the water table, i.e., D parenthesis P subscript K, close parenthesis, is greater than D subscript G W T, the effective overburden stress is computed as: sigma prime subscript V O parenthesis P subscript K, close parenthesis, equals sigma subscript V O parenthesis P subscript K, close parenthesis, minus the sum of D parenthesis P subscript K, close parenthesis, minus D subscript G W T, times rho subscript W times G. Radial overburden, sigma subscript R O prime, is computed as sigma subscript R O prime equals K subscript 0 times sigma subscript R O prime

Part 2: Estimation of Pavement Layer Moduli for Future Date

  1. First approximation of conditions at time t:
    1. Asphalt-bound layers: Ei0(t) = Input Ei(t)
    2. All other layers: Assume Ei0(t) = Input Ei(0)
    3. The effective vertical and radial overburden stresses svo’(t) and sro’(t) for points beneath the center of the applied load at three-quarters depth in each unbound layer were computed using ?i(t), hi, dgwt(t), and assuming K0 = 1.0 (see Figure 42).
  2. Iterative computation of moduli

    For j = 1 to m, where m is the number of iterations required to achieve acceptable between-iteration agreement in moduli.

    1. Using the Ei(j–1)(t) values, layer thicknesses (hi) and Poisson’s ratios (µi), and FWD load (P) as input, the CHEVLAY 2 linear layered–elastic analysis program was used to compute estimates of the vertical and radial load stresses, svlj(t) and srlj(t) for a point directly beneath the center of the loaded area, at three–quarters–depth in each unbound layer.
    2. Using the load stresses from step 2a, and the effective overburden stresses from step 1c, the estimated bulk and octahedral shear stresses at time t for each unbound layer were computed:

      Bulk shear stress sub I J at time T equals 2 times the sum of (open first parenthesis) radial load stress plus radial overburden stress at time T (close first parenthesis) plus (open second parenthesis) vertical load (40)

      Octahedral shear stress sub I J at time T equals one-third times the square root of 2 times the square of (open first parenthesis) (open second parenthesis) vertical load stress plus the vertical overburden stress at time T (close second parenthesis) minus (open third parenthesis) radial load stress plus radial overburden stress at time T (close third parenthesis) (close first parenthesis). (41)

    3. Part 1 (limited data set models), or Table 43 was used to compute Ei,j(t), using the stress parameters from step 2.b., the input moisture contents and (for the soil class models) material parameters (see Table 47).
    4. For bound layers, Ei,j(t) = Ei,j-1(t).
    5. Ei,j(t) was compared with Ei,(j-1)(t). Differences of less than 5 percent for all layers were deemed small enough to proceed to step 3. (As will be discussed subsequently, substantially better agreement was achieved in most instances.)
    6. The Ei,j(t) value for each unbound layer was compared with the applicable maximum and minimum modulus values presented in Table 48. If Ei,j(t) were greater than the maximum value for the soil class, the maximum value was substituted for use in the next iteration. If Ei,j(t) were less than the minimum value, the minimum value from Table 48 was substituted. This check and substitution procedure was used to avoid computational problems arising from irrationally high or low computed modulus values that were found to occur with some data sets.
    7. Continue iterating from Step 2.a.
  3. The moduli were compared with the ranges presented in Table 48. If the computed moduli fell outside the applicable ranges, they were not considered further, as they were outside the inference space of the regression models.
Table 48. Modulus ranges
Soil Class Modulus, E (MPa)
Minimum Maximum
A–1–a 78 687
A–1–b 35 712
A–2–4 34 708
A–2–6 52 221
A–3 36 549
A–4 66 439

TRIAL APPLICATION

The procedure presented in the preceding section was used to estimate moduli for several test sections in this investigation. As indicated previously, sample applications considered the full data set Model 2B section/layer –specific models presented in Table 82 (Appendix E), onedate (Model 2) and two-date (Model B) section/layer–specific models, and the recommended soil class models presented in Table 43. The data sets used as initial input to the modulus prediction procedure are identified in Table 49. The test sections considered were selected on the basis of geographic distribution, and (in the case of the soil class predictions) the availability of an applicable soil class model for all layers in the pavement structure.

The model coefficients and goodness-of-fit statistics for the one- and two-date models are presented in Table 50. Two one-date models (designated by the letters A and B after the layer number) were considered for section 271018. With the exception of the two models for section 091803 layer 2, the models are unbiased; the bias for the two 091803 layer 2 models is only 1 percent. All two-date models (except that for layer 4 at section 091803) have standard error ratios (Se/Sy) less than or equal to 0.50. Thus, they fit the data sets used in the model development quite well.

Table 49. Data sets considered in trial application of modulus prediction Where:
Section Time Span for Predictions Model Considered
Layer/Section-Specific Soil Class
Single Date 2 Dates All Dates
040113 1/10/96 5/9/96 1/10/96 1/10/96
4/3/96
X X
040114 2/6/96 4/2/96 X X
091803 11/15/93 5/8/97 11/15/93 11/15/93
5/12/94
X X
131031 8/3/95 4/25/96 X X
161010 10/1/93 11/25/96 X  
231026 9/16/93 5/1/95 X X
271018 9/23/93 8/8/94 A: 9/23/93 9/23/93
5/9/94
X
B: 5/9/94
331001 10/14/93 6/29/95 X
351112 4/6/94 2/4/97 X
481077 12/14/93 5/16/97 12/14/93 1/10/94
7/18/94
X X
561007 1/21/94 6/19/97 X  
871622 4/26/94 6/15/95 X X

When compared on a layer-by-layer basis, the one-date models are not as strong as the twodate models, though most are acceptable, having standard error ratios of 0.5 or less. However, the layer 4 model for section 091803 is only fair, with a standard error ratio of 0.65. The onedate model for layer 4A at section 271018 is poor, with a standard error ratio of 1.02. Section 271018 layer 4 model B is somewhat better, with a standard error ratio of 0.89, but is still only fair. In practice, the models for section 091803 layer 4, and section 271018 layer 4B should be used with caution, and section 271018 layer 4 model A should not be used at all. The trial applications were completed with these models for illustrative purposes only.

The asphalt surface moduli for the modulus estimation dates were computed by applying the Asphalt Temperature Adjustment Factor (ATAF) developed by Lukanen et al.[77] using the monitored mid-depth temperatures for the pertinent dates, and the backcalculated moduli for the initial date. The ATAF is computed as:

The Asphalt Temperature Adjustment Factor is equal to 10 to the regression coefficient times (open parenthesis) the estimated mid-depth asphalt layer temperature for the date of interest minus the mid-depth asphalt layer temperature at the time of deflection testing (close parenthesis). (42)

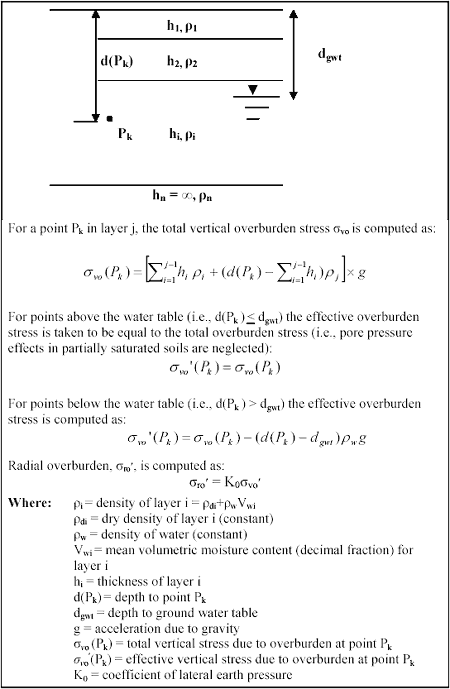
Where:

ATAF = Asphalt temperature adjustment factor.

c = Regression constant, -0.021 for mid-lane test points, -0.0195 for outer wheelpath test points.

Tref = Estimated mid-depth asphalt layer temperature for the date of interest.

TMeas = Mid-depth asphalt layer temperature at the time of deflection testing.

The computed temperature-compatible AC layer moduli for the prediction data sets are compared with the actual backcalculated AC layer moduli in Figure 43. Although there are several aberrant data points, overall agreement is good.

Figure 43. Backcalculated modulus versus estimated temperature compatible modulus for all sections considered in trial applications

Backcalculated modulus versus estimated temperature compatible modulus for all sections considered in trial applications. The backcalculated modulus is graphed on the horizontal axis from 0 to 25,000 megapascals. The estimated modulus is graphed on the vertical axis from 0 to 25,000 megapascals. There is an equation showing that R squared is equal to 0.86. The line increases almost at a 45-degree angle. Scatter points are clustered all along the line. There is overall agreement between estimated temperature compatible modulus and the actual backcalculated modulus.

All sets of backcalculated moduli (in the working data set) for the selected initial test dates in the time frame noted in Table 49 were used in the prediction computations. The moisture contents and depths to ground water used in the computations were also the monitored values. Thus, the trial applications do not represent a field validation of the methodology. Rather, they serve to demonstrate an approach that might be taken to applying the predictive models for backcalculated pavement layer moduli.

Table 50. Site-specific, limited data set Model 3 and 3B coefficients and goodness-of-fit statistics
Site Layer c0 c1/k1 c2/k2 c2 c3/k3 c3 n r2(log E) % Bias Se/Sy
1–Date Models (Model 3)
040113 2 3.087 -0.247 1.610 19 0.88 0 0.39
040113 3 4.931 -3.109 19.07 19 0.87 0 0.39
040113 4 -2.713 1.640 -79.86 19 0.80 0 0.49
091803 2 3.373 -0.437 3.168 34 0.87 -1 0.49
091803 3 7.154 -4.517 25.15 34 0.89 0 0.36
091803 4 -9.126 12.58 -60.90 34 0.62 0 0.65
271018 2A 3.259 -0.191 1.698 5 0.99 0 0.24
271018 3A 3.221 -0.180 2.857 5 0.94 0 0.50
271018 4A 7.094 -3.836 42.19 5 0.75 0 1.02
271018 2B 3.090 -0.122 1.763 8 0.96 0 0.25
271018 3B 3.974 -1.352 -0.334 8 0.92 0 0.37
271018 4B 6.846 -4.124 38.11 8 0.54 0 0.89
481077 2 3.566 -0.219 0.681 34 0.88 0 0.36
481077 3 5.534 -3.587 18.89 34 0.86 0 0.40
2-Date Models (Model 3B)
040113 2 3.121 -0.317 -0.325 0.711 1.906 -2.717 28 0.89 0 0.36
040113 3 2.983 16.84 0 -26.83 0 162.9 28 0.88 0 0.37
040113 4 11.920 -164.6 0 27.28 0 -714.1 28 0.85 0 0.41
091803 2 2.677 3.160 -0.886 2.038 19.14 -72.54 73 0.88 -1 0.45
091803 3 9.053 -9.220 -6.393 9.110 25.66 -2.500 73 0.93 0 0.30
091803 4 -7.590 0.000 11.23 -0.688 -51.26 -10.80 73 0.66 0 0.61
271018 2 6.344 -23.46 -0.152 0.000 0.000 12.52 13 0.97 0 0.20
271018 3 3.556 1.358 0 -5.685 -12.33 63.67 13 0.93 0 0.34
271018 4 3.850 11.86 -4.084 0 0 151.3 13 0.83 0 0.47
481077 2 3.451 1.841 0.167 -4.331 4.259 -34.78 57 0.84 0 0.44
481077 3 -38.73 237.0 0 -13.18 0.000 62.85 57 0.94 0 0.24

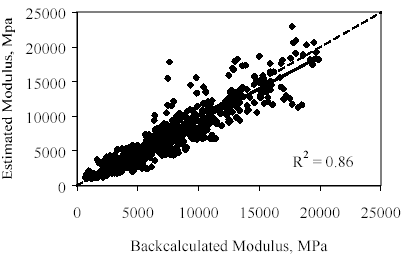
The number of iterations required to achieve agreement between the moduli for two subsequent iterations varied tremendously. In some cases, fewer than 5 iterations were required to achieve absolute agreement, and in others, more than 35 iterations were required. Computations were terminated after 44 iterations, and data sets for which the difference in computed modulus between iterations 43 and 44 exceeded 5 percent were not considered in the subsequent evaluation. Fewer than 2 percent of the layer modulus estimates were rejected based on the 5-percent closure criterion. An additional 5 percent of the prediction results were rejected because the modulus for one or more layers fell outside the inference space for the predictive models (see Table 48).

Results Obtained with Section/Layer-Specific Models Derived From the Full Data Set

The overall results obtained in the sample applications using section/layer-specific models based on the full data set are compared with the backcalculated moduli in Figure 44. The error bounds about the line of equality in these figures represent twice the within-day standard deviation for the layer type in question as reported in Table 23. The overall results for the subgrade layers are reasonably good, in the sense that the data points are clustered about the line of equality, and the backcalculated and predicted values are strongly correlated with each other, with an R2 value of 0.87. The overall results for the subbase and base layers are not as good. The data points are more broadly dispersed about the line of equality, and the correlation between the backcalculated and predicted values is not as strong, particularly for the base layers, for which the R2 value is only 0.47. There is a tendency toward under-prediction of the modulus for all three layers. This represents a conservative error.

The trial application results were also evaluated by means of series of paired Student’s t tests on the null hypothesis that the true mean difference between the backcalculated and predicted moduli for each pavement layer is zero. Key statistics and the t–test results are presented in Table 51. In this table, n is the number of individual modulus observations considered (i.e., combination of test date/time and FWD load level) in the paired Student’s t test. Entries of "A" under the column heading "t–Test Decision" indicate that the null hypothesis of zero difference between the backcalculated modulus, E, and the predicted modulus, Epredicted is accepted at a significance level of 5 percent. Entries of R in the decision column indicate that the null hypothesis is rejected–i.e., that the difference is significantly different from zero at the 5–percent level of significance.

For the site/layer-specific complete data set predictions, the hypothesis of zero difference is accepted for all layers for 5 of the 12 test sections considered. The hypothesis of zero difference is accepted for at least 1 layer in all cases, and for 2 of 3 layers for 25 percent of the sections.

Figure 44. Backcalculated versus section/layer-specific predicted modulus for models derived using all data

Backcalculated versus section/layer-specific predicted modulus for models derived using all data. There are three graphs with the backcalculated modulus graphed on the horizontal axis and the predicted modulus graphed on the vertical axis. The first figure is of base layers and has an equation showing that R squared is equal to 0.48. The line increases across the 95 percent confidence and the majority of the points fall within the 95 percent confidence. The second graph is of subbase layers and has a line with R squared is equal to 0.79. The line and most of the numerous points increase within the 95 percent confidence. The third graph is of subgrade layers and has a line with R squared is equal to 0.86. The line and points increase within the 95 percent confidence and are significant.

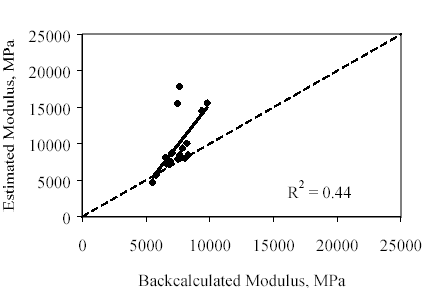
The prediction results were also evaluated by examining the plots in Appendix F. Based on this examination, there are a few cases where it could be argued that although the observed differences are statistically significance, they are not large enough to be of practical significance. This occurs for the upper subgrade layer at section 040113 (see Figure 49 in Appendix F), where all of the data points are tightly clustered about the line of equality. There is also one case–the base layer for section 271018 (see Appendix F, Figure 55)– where the differences are large enough to be important from a practical standpoint, although the null hypothesis is accepted. A partial explanation for the poor base layer modulus predictions for this section may be found in Figure 45, which illustrates the relationship between the actual backcalculated AC layer moduli for this section, and the estimated values used in the predictions. Whereas the overall backcalculated versus predicted AC modulus agreement illustrated in Figure 43 is quite good, the agreement for this particular section is poor. Thus, the computed stress states (and therefore the predicted moduli) for the underlying layer(s) can be expected to differ, perhaps markedly, from those computed for the backcalculated moduli, thereby contributing to the poor prediction of base layer moduli for this section.

The column in Table 51 headed "Overall Decision" reflects the author’s judgment of the acceptability of the prediction results considering both the t–test results and review of the plots in Appendix F. Entries of "U" in this column indicate that the overall prediction results for the section are deemed unacceptable, while entries of "A" indicate that the overall prediction results for the section are deemed acceptable.

Taking into consideration both the t-test results and observations drawn from the plots in Appendix F, the overall results of the section-specific model predictions are deemed acceptable for half of the sections considered. For the remaining sections, acceptable predictions were achieved for one or two of the layers, but not all three.

Collectively, these results show that the section/layer-specific regression models presented in Table 82 and the procedure presented in the preceding section of this chapter can yield acceptable results, particularly when unbiased regression models with strong predictive capability are achieved for all layers in the pavement structure. However, good results are not achieved on a consistent basis. Furthermore, these results represent a scenario that is not representative of what can be achieved in practice, by virtue of the fact that the same data were used in both the derivation of the models and their application (with the exception of the load-induced stress parameters, and the estimated AC layer moduli used in computing the load-induced stresses). The application of limited data set models derived from the data for one or two test dates provides a more realistic assessment of what can be expected in practice.

Table 51. Summary statistics and t-test results for section/layer-specific complete data set model predictions
Section Layer Mean E Mean Epredicted Mean Difference Std.Dev.of Diff n t t-Test Decision Overall Decision
040113 2 140 132 8.2 63.1 23 0.62 A A
040113 3 88 91 -3.0 5.3 23 -2.70 R
040113 4 146 146 -0.3 5.2 23 -0.28 A
040114 2 257 261 -4.2 65.0 4 -0.13 A A
040114 3 224 231 -7.7 12.7 4 -1.22 A
040114 4 335 348 -13.7 14.4 4 -1.90 A
091803 2 225 194 30.9 70.9 113 4.64 R U
091803 3 162 164 -1.2 33.6 113 -0.37 A
091803 4 296 293 4.8 32.7 113 1.55 A
131031 2 473 452 21.1 109.4 42 1.25 A A
131031 3 136 134 2.2 16.4 42 0.87 A
131031 4 88 88 -0.3 7.2 42 -0.28 A
161010 2 427 455 -28.3 55.4 12 -1.77 A A
161010 3 60 55 4.4 15.8 12 0.96 A
161010 4 218 227 -9.2 89.7 12 -0.35 A
231026 2 248 227 20.4 56.5 59 2.77 R U
231026 3 153 164 -11.1 24.7 59 -3.46 R
231026 4 488 472 16.0 79.2 59 1.55 A
271018 2 187 164 23.1 60.5 16 1.53 A U
271018 3 184 179 4.6 17.0 16 1.09 A
271018 4 45 45 0.1 1.1 16 0.19 A
331001 2 191 209 -17.5 79.8 133 -2.53 R U
331001 3 59 52 7.5 20.0 133 4.34 R
331001 4 402 412 -10.1 66.0 133 -1.76 A
351112 2 308 275 33.4 138.7 115 2.58 R U
351112 3 273 252 21.2 76.1 115 2.99 R
351112 4 328 329 -0.8 16.8 115 -0.54 A
481077 2 361 355 5.9 83.2 260 1.15 A U
481077 3 190 188 2.6 29.3 260 1.41 A
561007 2 172 155 17.4 45.5 58 2.91 R A
561007 3 111 110 1.5 9.0 58 1.30 A
561007 4 163 163 -0.3 9.5 58 -0.26 A
871622 2 313 294 19.7 69.9 27 1.47 A A
871622 3 154 162 -7.6 16.3 27 -2.43 R
871622 4 225 235 -9.7 20.8 27 -2.42 R

Figure 45. Backcalculated modulus versus estimated temperature compatible modulus for section 271018 (Minnesota)

The backcalculated modulus is graphed on the horizontal axis from 0 to 25,000 megapascals. The estimated modulus is graphed on the vertical axis from 0 to 25,000 megapascals. The equation is R squared is 0.44. The line begins at an estimated and backcalculated modulus of 5000 megapascals and increases to an estimated modulus of 15,000 at 10,000 megapascals for backcalculated modulus. This is a poor correlation between backcalculated modulus and estimated temperature modulus.

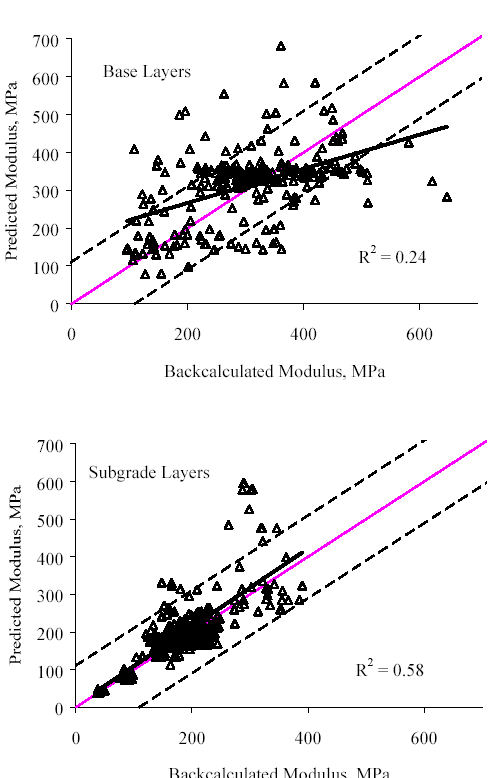
Results Obtained With Section/Layer–Specific Models Derived From Limited Data Sets

Overall comparisons of the backcalculated moduli and predicted moduli derived using the one– and two–date models are provided in Figure 46 and Figure 47, respectively, while comparisons for individual pavement layers are provided in Appendix G, respectively. As before, the error bounds about the line of equality represent twice the pooled within–day standard deviation reported in Table 23 for the layer type (base or subgrade) of interest. The relationships between the backcalculated and predicted base layer moduli are weak, with R2 values of only 0.24 and 0.32 for the single– and two–date models predictions, respectively. The relationships are much stronger for the subgrade layers, with R2 values 0.58 and 0.69, respectively. (Note that these values are not directly comparable to those for the full data set predictions because fewer sections were considered.)

As previously, paired t–tests were used to test the null hypothesis that the mean difference between the backcalculated and predicted moduli is zero. Pertinent statistics and the t–test results are presented in Table 52 for the one–date model predictions and in Table 53 for the two–date predictions. Overall assessments of the adequacy of the predictions for each section (taking into consideration both the t–test results and the plots in Appendix G. and Appendix H) are provided in the columns headed "Overall Decision."

Figure 46. Backcalculated modulus versus section/layer-specific one-date predicted modulus

There are two graphs compared: base layers and subgrade layers. The base layer has the backcalculated modulus graphed on the horizontal axis from 0 to 600. Predicted modulus is graphed on the vertical axis from 0 to 700 megapascals. R squared is 0.24. The line begins at 220 predicted and 100 backcalculated, which increases to 420 predicted at 620 backcalculated. The base layers are scattered throughout the graph. This graph shows a weak correlation between backcalculated modulus and specific one date predicted modulus. The second graph, or subgrade layer, has an equation of R squared is 0.58. The line begins at 10 predicted and 10 backcalculated and increases in a straight line to 400 predicted and 390 backcalculated. The line is increasing at close to a 45-degree angle. There is a cluster of plots on the center of the line. There is a strong correlation between backcalculated and subgrade layer predicted modulus since the line and plots are within the 95 percent confidence.

Figure 47. Backcalculated versus site/layer-specific two-date predicted modulus

The figure has two line graphs: base layers and subgrade layers. Both graphs have the backcalculated modulus graphed on the horizontal axis up to 600 megapascals. The predicted modulus is graphed on the vertical axis from 0 to 700 megapascals on the base layers graph and from 0 to 600 megapascals on the subgrade layers graph. The base layer graph has an equation of R squared is 0.32. The line begins at 150 megapascals for predicted at 100 megapascals backcalculated, and it increases in a straight line to 420 predicted at 500 backcalculated. There are plots scattered throughout and around the line. There is a strong correlation between backcalculated and base layer predicted modulus since they are within the 95 percent confidence. The subgrade layer graph has an equation of R squared is 0.69. The line begins at 60 megapascals for predicted and at 40 megapascals for backcalculated, and it increases in a straight line to 360 predicted at 390 backcalculated. There are plots scattered close to the line. There is a strong correlation between backcalculated modulus and subgrade layer predicted modulus since it is within the 95 percent confidence.

For the one-date predictions, the null hypothesis was accepted for all layers for only one section, and for at least one layer at each of the remaining sections. For the two-date model predictions, the hypothesis of zero difference was accepted for all layers at two sections, no layers at one section, and one layer at a third section.

Table 52. Summary statistics and t-test results for section/layer-specific one-date model predictions
Section Layer Mean E Mean Epredicted Mean Difference Std.Dev.of Diff n t t-Test Decision Overall Decision
040113 2 139.6 205.60 -65.98 107.12 24 -3.02 R U
040113 3 89.17 86.17 3.00 12.33 24 1.192 A
040113 4 145.7 152.39 -6.68 7.64 24 -4.29 R
091803 2 247 234 13.5 136.9 36 0.59 A U
091803 3 173 218 -45.0 64.4 36 -4.19 R
091803 4 319 408 -58.3 133.8 36 -2.61 R
271018 2A 189 224 -34.9 104.3 9 -1.00 A U
271018 3A 186 168 17.4 19.4 9 2.70 R
271018 4A 45 43 2.0 4.7 9 1.27 A
271018 2B 169 154 14.5 18.1 4 1.60 A A
(qualified)
271018 3B 172 176 -4.0 1.9 4 -4.28 R
271018 4B 39 38 0.6 0.8 4 1.46 A
481077 2 348.3 355.79 -7.50 93.16 173 -1.06 A U
481077 3 192.2 196.03 -3.79 30.97 173 -1.61 A

Only one set of the one–date model predictions is considered acceptable–predictions obtained for section 271018 with the "B" models. However, even that success cannot be considered complete, as the number of data sets for which successful predictions were achieved was very small.

The results obtained with the two-date models are slightly better, with acceptable results having been obtained for two of the four test sections. However, this success is again qualified by the small number of section 271018 test dates for which successful predictions were achieved. Overall, the results obtained with the limited data set models are not at all promising. However, because the scope of this trial was very limited, these findings should not be regarded as definitive.
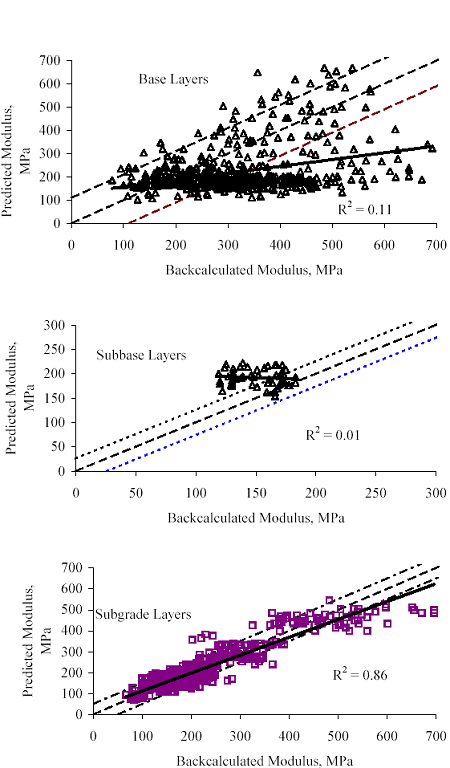
Table 53. Summary statistics and t-test results for section/layer-specific two-date model predictions
Section Layer Mean E Mean Epredicted Mean Difference Std.Dev.of Diff n t t-Test Decision Overall Decision
040113 2 131.7 131.44 0.22 33.31 15 0.026 A A
040113 3 86.2 89.85 -3.65 16.50 15 -0.86 A
040113 4 148.9 144.78 4.08 12.99 15 1.218 A
091803 2 230 195 35.8 79.4 30 2.47 R U
091803 3 172 211 -39.2 51.2 30 -4.19 R
091803 4 316 333 9.3 68.6 30 0.74 A
271018 2 195 179 15.6 43.5 6 0.88 A A
(qualified)
271018 3 179 180 -1.1 7.1 6 -0.37 A
271018 4 39 39 0.6 0.7 6 2.24 A
481077 2 349.1 424.10 -75.02 159.08 25 -2.36 R U
481077 3 175.3 157.90 17.38 40.55 25 2.143 R

Results Obtained With Soil Class Models

The overall results obtained in the trial applications using soil class models are compared with the backcalculated moduli in Figure 48, and comparisons for individual test sections are provided in Appendix I. As before, the error limits about the line of equality represent twice the pooled within-day standard deviation for the layer type in question, as reported in Table 23. Overall, the soil class prediction results for the subgrade layers are very comparable to those obtained using the section-specific models, with an R2 value for the backcalculated versus predicted modulus relationship of 0.86. The same cannot be said for the soil class model predictions for the subbase and subgrade layers, for which the overall backcalculated versus predicted R2 values are 0.11 and 0.01, respectively.

Paired t–test results for the null hypothesis (the mean difference between the backcalculated and predicted moduli is zero) are presented in Table 54. The zero difference hypothesis was rejected for all layers at three sections, and accepted for all layers at no sections. The author’s overall assessment of the success of the predictions for each section considering both t-test results and the plots in Appendix I are in the "Overall Decision" column.

In all, soil class model predictions were undertaken for seven sections. Considering both the distribution of the data points in the plots presented in Appendix I, and the paired t-test results for the null hypothesis, reasonable success in the prediction of subgrade modulus was achieved for four of the seven sections: 091803, 131031, 481077, and 871622. Soil class prediction of base layer modulus was less successful: acceptable overall results were not achieved for any section.

Table 54. Summary statistics and t-test results for soil class model predictions
Section Layer Mean E Mean Epredicted Mean Difference Std.Dev.of Diff n t t-Test Decision Overall Decision
040113 2 134 161 -26.9 69.9 15 -1.49 A U
040113 3 89 79 10.2 6.2 15 6.35 R
040113 4 148 110 38.0 11.3 15 12.98 R
040114 2 257 125 131.2 23.5 4 11.16 R U
040114 3 224 370 -146.2 10.4 4 -28.1 R
040114 4 335 247 87.8 31.4 4 5.60 R
091803 2 225 196 28.8 74.5 98 3.83 R U
091803 3 162 163 -1.1 35.7 98 -0.31 A
091803 4 296 297 1.1 35.7 98 0.31 A
131031 2 482 329 152.4 154.1 47 6.78 R U
131031 3 133 128 5.0 24.6 47 1.39 A
131031 4 89 86 2.8 11.8 47 1.61 A
231026 2 245 219 26.5 80.1 67 2.70 R U
231026 3 153 142 11.1 32.1 67 2.84 R
231026 4 478 457 21.9 78.4 67 2.28 R
481077 2 356 177 178.4 81.3 259 35.32 R U
481077 3 190 188 2.7 29.6 259 1.47 A
871622 2 378 435 -57.0 78.4 53 -5.29 R U
871622 3 151 192 -40.8 27.4 53 -10.8 R
871622 4 223 234 -11.3 19.8 53 -4.16 R

Figure 48. Backcalculated versus soil class predicted moduli–all sections

The figure shows a comparison of three different graphs: base, subbase, and subgrade layers. The backcalculated modulus is graphed on the horizontal axis for all three graphs. The predicted modulus is graphed on the vertical axis. The base layer graph has an equation of R squared is 0.11. The line begins at 50 megapascals predicted modulus and at 65 megapascals backcalculated modulus. The line gradually increases to 300 predicted at 700 backcalculated. Plots are densely clustered below the line and scattered above the line. There is a weak correlation between backcalculated modulus and base layer predicted modulus, since the line and plots are outside of the 95 percent confidence. The subbase layer graph has an equation of R squared is 0.01. The line begins at 200 predicted at 120 backcalculated and barely decreases to 175 predicted at 180 backcalculated. There are plots scattered closely to the line. There is a weak correlation between backcalculated modulus and subbase layer predicted modulus, since the plots are outside of the 95 percent confidence. The subgrade layer graph has an equation of R squared is 0.86. The line begins at 80 megapascals predicted at 60 megapascals backcalculated and increases in a straight line to 600 predicted at 700 backcalculated. The line and majority of the plots are within the 95 percent confidence, so there is a strong correlation between backcalculated modulus and subgrade layer predicted modulus.

SUMMARY OBSERVATIONS

The trial applications presented in this chapter demonstrate that regression models for the prediction of backcalculated layer moduli can be used to estimate seasonal variations in the moduli of unbound pavement layers. However, deficiencies in the accuracy of the estimates (as compared to the actual backcalculated layer moduli) point to the need for further research to improve upon the results of this study. Factors known or believed to contribute to inaccurate predictions include:

  • Deficiencies in the ability of many of the predictive models to explain the observed variation in backcalculated layer moduli. It may be possible to achieve some improvement in this regard by reducing the variability in backcalculated layer moduli through improvements in procedures for evaluating backcalculation results.
  • Errors in the estimation of the AC layer moduli used in computing the stress states used in the predictions.
  • Deficiencies of the iterative process used to estimate the stress states for the prediction dates.

Thus, potentially fruitful avenues for research include:

  • Improvements in deflection testing and backcalculation technology to reduce the level of random variation in backcalculated layer moduli. In this regard, Model 2 (Equation 29) could be the basis for additional objective criteria for evaluating the plausibility of moduli backcalculated for varying overall stress conditions (encompassing FWD load level and temperature-induced variations in the stiffness of overlying layers) using linear layered-elastic theory. Such criteria are needed to aid engineers in distinguishing between backcalculation results that represent a good fit of the deflection basin, but are otherwise of limited value, and those that truly represent a reasonable characterization of the in situ properties of the pavement layers.
  • Improvements in deflection testing and backcalculation technology to enable more correct consideration of the stress sensitivity of unbound materials in the backcalculation process itself. There is no doubt that inaccurate assumptions inherent in the application of linear layered-elastic theory to backcalculate and predict pavement layer moduli contribute to the deficiencies observed in the prediction results.
  • Improvements in the approach to estimating the stress state to use in predictive models such as those developed in this study.
Previous | Table of Contents | Next


Federal Highway Administration | 1200 New Jersey Avenue, SE | Washington, DC 20590 | 202-366-4000
Turner-Fairbank Highway Research Center | 6300 Georgetown Pike | McLean, VA | 22101