U.S. Department of Transportation
Federal Highway Administration
1200 New Jersey Avenue, SE
Washington, DC 20590
202-366-4000
Federal Highway Administration Research and Technology
Coordinating, Developing, and Delivering Highway Transportation Innovations
 |
| This report is an archived publication and may contain dated technical, contact, and link information |
|
Publication Number: FHWA-HRT-06-109 Date: September 2006 |
Susan L. Tighe, Ph.D., P.E.
University of Waterloo
Waterloo, Ontario, Canada
The overall scope of this paper involves a university perspective on how the Long-Term Pavement Performance (LTPP) program can be used to educate and train skilled engineers in the pavement sector.
Building on a presentation at the 2003 Transportation Research Board Annual Meeting, this paper first presents a context for using the LTPP data. In formulating and addressing the use of the data, the following main points are discussed: education and training using LTPP, development of assignments with purpose, discussion of using LTPP to develop pavement research themes, and conclusions. The paper is directed primarily at academics. However, it does have relevance to the public and private sectors, as it directs assignments that will result in highly qualified people and potential leaders in the field of pavement engineering. It also recognizes the competing demands that face academics, so the assignments are intended to be straightforward and are designed for academics with limited preparation time. Overall there is a need to produce intelligent engineers with good problem-solving skills. Thus, the primary focus is to encourage independence and creativity through inquiry-based learning.
In summary, the basic premise of this paper is that good design, construction, and maintenance of long-life pavements can be realized most effectively in education and training through inquiry-based learning with LTPP.
The broad issue of transportation education and training and the associated issues of supply and demand have existed for decades. A key motivating factor for training and educating future engineers in the transportation sector is concern about whether the transportation sector is and will be adequately served in terms of education and training, supply of skilled people, availability of resources, and future demands and commitment by both public and private agencies.
Overall, the transportation sector has many dimensions. It can be viewed by modal type, public versus private versus academic, professionals versus technologists/technicians versus operators, function ranging from engineering to financial or accounting to planning to administrative or management, supply sources, skill sets needed, breakdown of demand, remuneration levels—and the list goes on.
This paper recognizes the many dimensions of the needs of the transportation sector, while the focus remains on the academic perspective and the use of the Long-Term Pavement Performance (LTPP) program to promote transportation and more specifically to attract highly qualified people to the pavement sector.
The key issues related to the people side of the pavement engineering sector and the associated education and training needs can be categorized as follows:
The overall scope of this paper involves a university perspective on how the LTPP program can be used to educate and train skilled engineers in the pavement sector.
This paper builds on an earlier presentation at the 2003 Transportation Research Board Annual Meeting by first presenting a context for using the LTPP data. In formulating and addressing use of the data, the following main points are discussed: education and training using LTPP, development of assignments with purpose, discussion of using LTPP to develop pavement research themes, and conclusions. The paper is directed primarily at academics. However, it does have relevance to the public and private sectors as it directs assignments that will result in highly qualified people and potential leaders in the field of pavement engineering. It also recognizes the competing demands academics face, so the assignments are intended to be straightforward and are designed for academics with limited preparation time. Overall there is a need to produce intelligent engineers with good problem-solving skills. Thus, the primary focus is to encourage independence and creativity through inquiry-based learning.
In summary, the basic premise of this paper is that good design, construction, and maintenance of long-life pavements can be realized most effectively in education and training through inquiry-based learning with LTPP.
A 1972 study noted that the major supply source for skilled professionals in the transport sector and thus pavement sector was civil engineering graduates.(1) Since then, the number of graduates has continued to be cyclic and out of phase with economic cycles and the marketplace. The enrollments and production of civil engineers declined by about one-third over the past decade. This has occurred during a generally increasing economy, a sharply increasing infrastructure backlog that includes roads, an aging cohort of professionals in public agencies and industry, and an era of downsizing, surplusing, reengineering, and strategic repositioning (all buzzwords used to try to soften the reality that layoffs, early retirements, and dismissals were involved) by transport departments. The net effect is supply and skills shortages, which already exist in a number of transport subsectors. Unfortunately, there is no magic tap to turn on or off in these situations and, even more unfortunately, the transport sector has not learned from history. Whether we will now enter a new and more enlightened era of human resource planning, including the critical component of succession planning as subsequently discussed, is at least a case for optimism.(2)
The decline in the production of civil engineers (the primary supply source for transportation professionals) has been alarming, not only in absolute numbers but also in comparison to computer, mechanical, and electrical engineers. It is also noteworthy that in 1972 civil engineering graduates composed about 21 percent of the total but now, 30 years later, that has shrunk to about 14 percent.(2) It is also notable that civil engineering now enjoys close to 100 percent placement during its undergraduate programs. At the University of Waterloo, for example, civil engineering during the past 2 years has received work term job placements ahead of the other disciplines.
It is important to recognize that transportation professionals need to possess a number of skills. Again, the universities are the upstream component in equipping their students with the initial skill sets. Table 1 lists the key nontechnical, basic, and technical and special skills professionals require to carry out their work at both the network/systemwide level and the project/site-specific level. Of course, the depth of any individual skill required will vary with a number of factors, such as type of transportation network or project, size and complexity, environmental impacts, and financing.
| NETWORK/SYSTEM WIDE LEVEL | NON-TECHNICAL SKILLS | BASIC SKILLS | ||||||||||||||
|---|---|---|---|---|---|---|---|---|---|---|---|---|---|---|---|---|
| Financial Planning | Public Policy | Business Admin. | Personnel Manag. | Engineering Law | Public Relations | Computing | Database design & manag | Statistics | Math Models | Engineering Economics | ||||||
| Data | Locational reference system | x | x | |||||||||||||
| Facilities Inventory | x | |||||||||||||||
| Field monitoring & other data | x | x | x | |||||||||||||
| Data processing | x | x | x | |||||||||||||
| Present status reports | x | x | x | |||||||||||||
| Deficiency/Needs | Min. levels of service | x | x | |||||||||||||
| Max user costs | x | |||||||||||||||
| Max program costs | x | x | x | |||||||||||||
| Needs now/future | x | x | ||||||||||||||
| Deter. predictions | x | x | x | x | ||||||||||||
| Alternative Strategies and Life Cycle Costing | Maint & rehab alternatives | |||||||||||||||
| Selection Criteria | x | |||||||||||||||
| Eng. anal. & perf. predictions | x | x | x | x | ||||||||||||
| Life Cycle costs | x | x | ||||||||||||||
| Priority analysis | x | x | x | |||||||||||||
| Priorities, Programs, Schedules | Funding Levels | x | x | |||||||||||||
| Final Capital Program | x | x | x | |||||||||||||
| Final Maint. Program | x | x | x | |||||||||||||
| Construct schedule | x | x | x | |||||||||||||
| Maint. schedule | x | |||||||||||||||
| Program monitoring | x | x | x | |||||||||||||
| Budget & financial planning | x | x | x | |||||||||||||
| PROJECT/SITE SPECIFIC LEVEL | ||||||||||||||||
| Data | Detailed site and other data | x | x | x | x | |||||||||||
| Subdivision of project | x | x | x | |||||||||||||
| Data processing | x | x | x | |||||||||||||
| Detailed Design | Specifications | x | x | |||||||||||||
| Max. project cost | x | x | x | |||||||||||||
| Min. interruptions to service | x | x | ||||||||||||||
| Selection criteria | x | |||||||||||||||
| Alternatives & Analysis | ||||||||||||||||
| Lifecycle analysis & best alt. | x | x | ||||||||||||||
| Construction | Activities, control, records | x | x | x | x | x | x | |||||||||
| Built to within specifications | x | |||||||||||||||
| Maintenance | Maint. Activities and records | x | x | x | x | |||||||||||
| Budget and schedule updates | x | x | x | |||||||||||||
| NETWORK/SYSTEM WIDE LEVEL | TECHNICAL AND SPECIAL SKILLS | |||||||||||
|---|---|---|---|---|---|---|---|---|---|---|---|---|
| Geotechnical Geology | Building Materials | Construction Material | Materials Testing | Field Testing | Traffic Analysis | Pavement Engineering | Bridge Engineering | Structural Engineering | Concrete Design | Construction Manag | ||
| Data | Locational reference system | x | x | x | x | |||||||
| Facilities Inventory | ||||||||||||
| Field monitoring & other data | x | x | ||||||||||
| Data processing | ||||||||||||
| Present status reports | ||||||||||||
| Deficiency/Needs | Min. levels of service | |||||||||||
| Max user costs | ||||||||||||
| Max program costs | ||||||||||||
| Needs now/future | x | x | x | |||||||||
| Deter.predictions | x | x | x | x | x | x | ||||||
| Alternative Strategies and Life Cycle Costing | Maint & rehab alternatives | x | x | x | x | x | x | x | x | x | ||
| Selection Criteria | ||||||||||||
| Eng. anal. & perf. predictions | x | x | x | x | x | x | x | x | ||||
| Life Cycle costs | x | x | ||||||||||
| Priority analysis | x | x | x | |||||||||
| Priorities,Programs,Schedules | Funding Levels | x | x | |||||||||
| Final Capital Program | x | x | ||||||||||
| Final Maint. Program | x | x | ||||||||||
| Construct schedule | x | |||||||||||
| Maint. schedule | ||||||||||||
| Program monitoring | x | |||||||||||
| Budget & financial planning | x | |||||||||||
| PROJECT/SITE SPECIFIC LEVEL | ||||||||||||
| Data | Detailed site and other data | x | ||||||||||
| Subdivision of project | x | |||||||||||
| Data processing | ||||||||||||
| Detailed Design | Specifications | x | x | x | x | x | x | x | x | x | ||
| Max. project cost | ||||||||||||
| Min. interruptions to service | ||||||||||||
| Selection criteria | ||||||||||||
| Alternatives & Analysis | x | x | x | x | x | x | x | x | ||||
| Lifecycle analysis & best alt. | ||||||||||||
| Construction | Activities, control, records | x | x | x | x | |||||||
| Built to within specifications | x | x | x | x | x | |||||||
| Maintenance | Maint. Activities and records | |||||||||||
| Budget and schedule updates | x | |||||||||||
In general, academics tend to rely on textbooks or course notes to assist with lecturing material. However, CDs, labs, computers, and various software programs can assist in the delivery of material. The advantage of using these latter forums is that it can provide students with exposure to the state of the practice. It also can enable students to work with real-world data and provide them with hands-on experience. In addition, with specific reference to the LTPP data, it provides an unlimited ability to manufacture questions. From an instructor’s point of view, it allows for creativity. More specifically, students can be directed to analyze data in various ways to reinforce basic engineering concepts. Both straightforward and challenge-type questions can be developed using the extensive LTPP database. Another big advantage to incorporating LTPP into a curriculum is that it can challenge students and, if presented properly, can plant the seed for graduate studies. In the author’s experience, if students are challenged it serves as a beacon for attracting the intelligent students to the area. Lastly, the use of LTPP data can be a marketing tool for pavement engineering as a profession.
Assignments using LTPP data in this paper are directed at the following courses in a typical civil engineering program:
Every civil engineering program has at least one mandatory course in transportation engineering. Ideally, this course should be delivered in a manner that attracts students to the transportation sector. It is notable that at many universities the bright students in civil engineering tend to pursue structural engineering because they believe it is a more challenging field. This further reinforces the need to present transportation in a way that sparks student interest. The challenge with the mandatory transportation course is that it covers all of the basic concepts (i.e., traffic analysis, transportation planning, geometric design, pavement engineering, etc.). Consequently, the time spent on pavement engineering is limited. However, assignment problems can be developed so that students can easily carry out an analysis. For example, if the instructor provides the LTPP Web site address with detailed instructions as shown later in this paper and sets clear expectations of what needs to be done, these problems can be both challenging and interesting. The tasks in the problem should highlight major design features, major distresses, and/or data needs for design. Ultimately, these problems can also be used to provide magnitude checks so that once engineers graduate, they will have an appreciation for typical pavement thicknesses, distresses, and various other practical aspects of pavement design and management.
For example, the following assignment problems have been developed using data from the Canadian LTPP (C–LTPP) program. This experiment, which is complementary to the LTPP program, focuses on the following design factors:
In one assignment, students are asked to analyze roughness progression on the various sites, as shown in figures 1 through 4. Students are given the data and asked to prepare the figures and tables that explain performance. The problems presented are built on a study carried on in 2001.(4) Students are asked to comment on what the trends mean. For example, figure 1 compares the thickness effects on roughness progression among the three levels of overlay thickness. This is for the two levels of traffic, the two types of subgrade (fine and coarse), and the three types of climatic zones combined. It is clear that the thinner overlays are deteriorating at a significantly higher rate than the medium and thick overlays. The highest International Roughness Index (IRI) values after 8 years, about 1.8 meters per kilometer (m/km), occur for the lowest overlay thickness level of 30 to 60 millimeters (mm) for both high and low traffic, while the lowest IRIs after 8 years, about 1.4 m/km, occur for the highest overlay thickness level of 100 to 185 mm. However, the average IRI difference between the medium and high thickness overlays after 8 years is only 0.1 m/km. The students should provide a recommendation on the need for continued observations so that future trends can also be monitored.
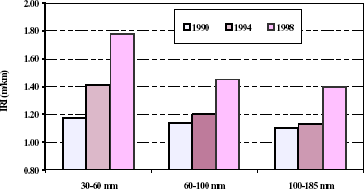
Figure 1. Effect of overlay thickness.
Figure 2 presents the overall trends of roughness progression in the three climatic zones (all levels of overlay thickness, traffic level, subgrade type, and overlay material combined). It reveals that a relatively higher rate of roughness progression takes place in wet, low-freeze zones. Roughness trends for pavements in dry, high-freeze zones are relatively flat.
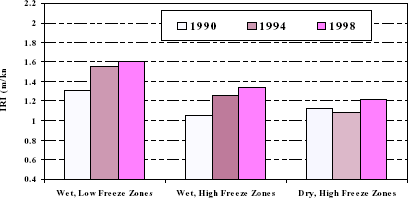
Figure 2. Effect of climatic zone.
It is apparent that the pavements with thin overlays (figure 3) deteriorate the fastest in the wet, low-freeze zones. However, the thickness effect on roughness is substantially reduced in dry, high-freeze zones. For pavements in wet, high-freeze zones, roughness levels are intermediate between the other two zones.
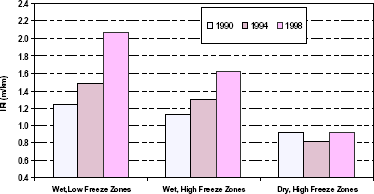
Figure 3. Roughness trends for thin overlays (30 to 60 mm) in high traffic.
Further explanation in the student’s response should elaborate on the trends. More specifically, the average IRI of the thin overlays in wet, low-freeze zones increased from about 1.3 m/km (as-built in 1990) to 2.1 m/km (observed in 1998), for a net IRI increase of 0.8 m/km in 8 years. On the other hand, there is no increase in average IRI for these low-thickness overlays in dry, high-freeze zones. The average IRI of the pavements in wet, high-freeze zones increased from about 1.1 m/km (as-built in 1990) to about 1.6 m/km (observed in 1998), for a net IRI increase of about 0.5 m/km in 8 years.
Another assignment problem examines the subgrade influences on pavement performance. According to the database codes of the Canadian Strategic Highway Research Program (C–SHRP), subgrade soils are classified into two categories: fine grained and coarse grained. The coarse-grained subgrade soils include sands and gravels, while the fine-grained subgrade soils are composed mainly of silts and clays. Analyzing the factor effects on roughness trends under various traffic, thickness, and climate conditions has shown that pavement deterioration is influenced to a considerable extent by the type of subgrade soil on which the pavement is built. Generally, pavements on fine-grained subgrade soils will deteriorate significantly faster than pavements on coarse-grained subgrade soils in terms of average IRI progression in the same time period. This factor effect is significant when examining thin overlays.
Figure 4 shows the roughness trends for thin overlays (30 to 60 mm) in wet, low-freeze zones. The effect of fine subgrade for either level of traffic is quite apparent. This might be expected because in this type of climatic zone with more moisture and freeze-thaw cycles and a lower depth of frost penetration, a thin overlay on a fine subgrade should deteriorate more rapidly. Similarly, at the high traffic level, pavements with fine-grained subgrade soils increased their average IRI by 2.5 times, compared with the pavements with coarse subgrade soils. On the other hand, the coarse subgrade sections showed comparatively less deterioration, but the rate of deterioration would still suggest (recognizing the risk of extrapolation) that even in this case a relatively short overlay life might be expected.
Overall, these questions would be directed in such a way that students could analyze data and comment on what the trends mean.
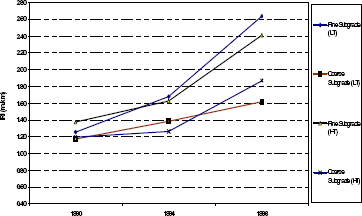
Figure 4. Roughness trends for thin overlays in wet, low-freeze zones.
Challenge problems also can be easily developed by using the LTPP data. These problems would be directed specifically at the top students. They involve analysis of data and must be accompanied with design recommendations and the use of statistical analysis. The students would use the data and be asked to articulate linkages to design factors. The advantage of using LTPP is that it enables the instructor to develop unlimited questions and unique problems aimed specifically at the top students in the course with the intention of planting a seed for graduate studies. For example, 2 of 87 students correctly answered an LTPP problem developed in 2002. It involved data analysis that required students to isolate design factors and come up with the best pavement design for various climates, subgrades, pavement thicknesses, and traffic levels. It is interesting to note that the students had a very positive reaction despite the challenge.
An example of a challenge problem assignment is shown in table 2. It uses roughness data from the C–LTPP study. In this case, students are asked to determine a regression relationship between roughness progression versus time for all of the Canadian Provinces over a given time period. Table 2 summarizes the roughness trends over 8 years for the individual Provinces. It appears that climate has an influence on roughness progression in terms of the amount of IRI increase. Among the 24 test sites or 65 sections, all in Quebec and two in Ontario are classified as being in wet, high-freeze zones; all in the three prairie Provinces (Alberta, Manitoba, and Saskatchewan) are in dry, high-freeze zones; the rest are in wet, low-freeze zones.
| Location and Climatic Zone | IRI As-built in 1989/1990 | IRI in 1997 | IRI in 1998 | D IRI | D IRI | ||||||
|---|---|---|---|---|---|---|---|---|---|---|---|
| Q1 (2) | Q3 (3) | Mean | Q1 (2) | Q3 (3) | Mean | Q1 (2) | Q3 (3) | Mean | In 7 Yrs. | In 8 Yrs. | |
| AB (III) | 1.148 | 1.281 | 1.220 | 1.240 | 1.386 | 1.344 | — | — | — | 0.120 | — |
| BC (I) | 0.880 | 1.219 | 1.056 | 1.170 | 1.229 | 1.250 | — | — | — | 0.190 | — |
| MB (III) | 0.876 | 1.262 | 1.103 | 1.264 | 1.436 | 1.336 | 0.976 | 1.180 | 1.179 | 0.233 | 0.076 |
| NB (I) | 1.187 | 1.389 | 1.270 | 1.442 | 1.729 | 1.652 | 1.238 | 1.749 | 1.541 | 0.382 | 0.271 |
| NF (I) | 0.930 | 1.531 | 1.231 | 1.134 | 1.544 | 1.320 | 1.044 | 1.566 | 1.350 | 0.089 | 0.119 |
| NS (I) | 1.367 | 1.666 | 1.554 | 1.350 | 1.996 | 1.877 | 1.398 | 2.071 | 1.859 | 0.323 | 0.305 |
| ON (I, II) | 0.827 | 1.045 | 0.978 | 1.114 | 1.681 | 1.492 | 1.798 | 2.347 | 2.072 | 0.514 | 1.094 |
| PE (I) | 1.108 | 1.203 | 1.158 | 1.330 | 1.735 | 1.546 | — | — | — | 0.390 | — |
| QC (II) | 1.109 | 1.254 | 1.181 | 1.183 | 1.420 | 1.333 | 2.145 | 3.280 | 2.708 | 0.152 | 1.527 |
| SK (III) | 0.882 | 1.127 | 1.002 | 0.964 | 1.184 | 1.162 | 1.046 | 1.329 | 1.273 | 0.160 | 0.271 |
Table 3 is provided to compare predicted and observed IRIs for seven Provinces in 1998 and three Provinces in 1999. Predicted values are determined using regression. In the case of figure 5 for Saskatchewan, the relationship is based on a (exponential) form of roughness progression data using data from 1989 to 1997 for each Province. The predicted values using the equation are then compared to the observed. The point of this exercise is to incorporate statistics and have the students examine the accelerating trends in roughness progression. Ultimately, the point is to demonstrate that the models should be recalibrated when future data becomes available. Generally, table 3 shows that predicted and observed values are relatively close. However, there are some relatively large differences (e.g., Quebec), and this implies that continued observation of performance prediction is most important, particularly if performance prediction models for overlay design are to be developed in the future.
| Location | Predicted 1998 | Observed 1998 | Predicted 1999 | Observed 1999 |
|---|---|---|---|---|
| MB | 1.15 | 1.28 | 1.16 | 1.22 |
| NB | 1.37 | 1.54 | — | — |
| NF | 1.38 | 1.35 | — | — |
| NS | 1.80 | 1.86 | 1.84 | 1.99 |
| ON | 1.76 | 2.07 | — | — |
| QB | 1.44 | 2.71 | — | — |
| SK | 1.27 | 1.24 | 1.4 | 1.27 |
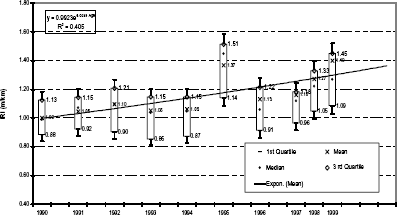
Figure 5. Observed roughness trends on sections in Saskatchewan.
These courses typically require students to work in groups on an engineering problem (junior and senior years). For example, at the University of Waterloo, two of these courses are included in the engineering curriculum. The instructor provides basic instructions for using the DataPave Online Web site. Students are required to provide a detailed proposal of how they plan to use the data and what they plan to analyze.
One project at the University of Waterloo involved a safety project in which skid numbers were assessed for selected flexible and rigid pavements. The students developed relationships between various factors in SN=f(time) and IRI=f(time). In another project course, one senior-level student validated IRI models developed for C–LTPP using LTPP data. The student used the analysis of variance (ANOVA) technique to determine if the C–LTPP data and the LTPP data were statistically different. As shown in table 4, significant differences were observed in 6 of 10 Provinces at a 95 percent confidence level between groups. This student ended up pursuing graduate studies in pavement engineering. Another aspect of this project involved identifying sources of error in the prediction model.
| BC | AB | SK | MB | ON | QC | NB | PE | NS | NF | |
|---|---|---|---|---|---|---|---|---|---|---|
| Fcalc | 1.30 | 0.76 | 4.06 | 33.68 | 40.14 | 6.46 | 1.12 | 1.20 | 6.78 | 170.42 |
| Fcrit | 3.99 | 3.88 | 3.92 | 3.87 | 3.89 | 3.95 | 3.99 | 4.01 | 4.41 | 3.11 |
| Significant | N | N | Y | Y | Y | Y | N | N | Y | Y |
A senior-level course in pavement engineering is also offered at the University of Waterloo. At this level, the students have used the data in various capacities. For example, one assignment involved comparing pavements in Ontario to pavements in California. The problem was directed at examining climatic performance, distress data, and relationship to IRI, traffic data, falling weight deflectometer (FWD) data, and environmental data. This senior-level engineering analysis included a core thickness assignment that involved calculating the variability of pavement thickness throughout a section and how this would impact the long-term performance. Then students were asked how additional traffic loads would impact the performance and ultimately how this variation would affect the structural soundness of the pavement.
Another example of an assignment related to pavement management is presented in figures 6, 7, and 8. Various sections are analyzed based on all available data with particular emphasis on distress data, roughness data, and structural data. In this case, figures 6 and 7 show the amount of transverse cracking and the extent of rut depths on the Ontario sections. Using the data, students are required to develop a needs analysis for all of the Ontario sections. The summary is presented in figure 8. Other assignment problems require students to examine the impact of poor soil conditions. As part of the assignment, students are always required to provide charts and table that reinforce their conclusions.
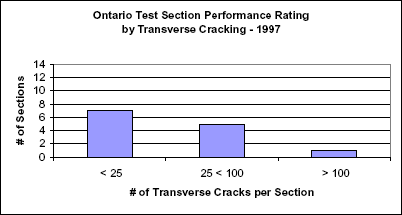
Figure 6. Transverse crack analysis.
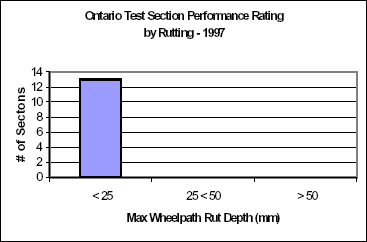
Figure 7. Rut depth analysis.
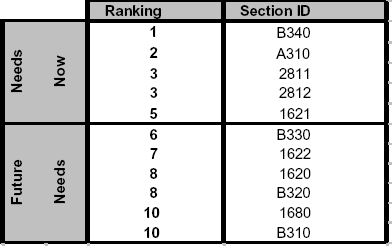
Figure 8. Needs analysis based on LTPP data.
The LTPP data has been used as part of a major course assignment in a graduate-level pavement course at the University of Waterloo. This assignment has been modified based on an initial discussion with Professor Norb Delatte.(5) This assignment problem is known as the “Pathfinder” assignment because there is no defined route for the students. Each student assigned a different Province or State. The student must use the LTPP data to provide senior management for that State’s or Province’s department of transportation with pavement design and management recommendations. Students are asked to address the following factors:
The following is the actual question that was used in the 2003 Graduate-Level Pavement Engineering Course at the University of Waterloo.
This question will require you to use data available through the U.S. Long-Term Pavement Performance Program. Data is available online at http://www.datapave.com/.
For this project you will need to analyze the performance of three LTPP sections. Analyze three sections (you select them) in the Province or State next to your name in the table below. If you have difficulty, you may use an alternative section from another Province or State. If you analyze more than three sections, bonus marks will be given.
Consider this as a consulting effort for assessing distresses. Is there a rutting problem on this section? Is there a roughness concern? If so, what is causing these problems?
The first step in using DataPave is to select the LTPP test sections of interest to the user. There are two ways of accomplishing this, by using either the visualization by location or the criteria method.(6)
By Location (Using Online Map)
Note: This selection will provide performance data for the selected LTPP section(s).
By Criteria
Note: This selection will provide performance data for the selected LTPP section(s).
Performance trends and detailed information can be obtained using either method.
Table Export
Data extraction is possible by conducting the following steps:
Note: A summary of the requested information is displayed in the following screen. Three additional documents can be downloaded at this time as well.
You should include the following in your analysis:
You must provide your analysis electronically in addition to a hard copy.
You may also want to consider the following questions:
The following table provides a summary of which student is responsible for each Province and State.
| Name | Province/State | Sections |
|---|---|---|
| Ishtiaque Tunio Syed Javed Iqbal Khalid Manzar Kehui Zhang Fayyaz Khan Ahmad Shah Saeed Ahmad Hamid S. Mohmand Iram Burhari Ignacio Davila Pazmino Liaquat Ali Rafi Uddin Ahmed Syed Aqeel Ahmed Muhammad (Tariq) Mahmood Muhammad Shoaib Kiani Bo Lan Haroon Raza Rickenson Daniel Gary Tang Javed Iqbal Aamer Shakoor |
Alberta British Columbia Manitoba New Brunswick Nova Scotia Ontario Quebec Saskatchewan Colorado Florida Georgia Illinois Indiana Maryland Massachusetts Michigan New York Ohio Oklahoma Pennsylvania Virginia Washington Wisconsin |
81 82 84 85 86 87 89 90 8 12 13 17 18 24 25 26 36 39 40 42 51 53 55 |
In summary, this assignment is a course highlight because it forces students to think. They are required to use the data to develop design, construction, maintenance, and inservice pavement needs. It highlights the complex nature of pavement engineering and the need to examine multiple factors to develop a construction and maintenance program.
The current asset value of North American roads and pavements is huge. Protecting this investment is critically important to the movement of goods and the mobility of people. However, competing pressure for funding from other segments of society and the need to cope with more costly and diminishing materials resources, requirements for zero-waste management, and sustainability present real threats to our ability to protect the investment and offer the level of service society expects. At the same time, there is both an opportunity and a critical need to carry out the research and technology development that will advance the planning, design, construction, and operation of our roads to a new level over the coming decades.(7)
The LTPP data can be used to provide effective and long-term partnerships among researchers, public sector agencies, and private industry. It can be used to help promote key areas for research such as the following:
This paper has presented several assignments for using the LTPP data in a typical civil engineering curriculum. The experiences and problems presented have been used at the University of Waterloo over the past 3 years. Overall, the following comments can be made:
Overall, there is a need for highly qualified people in this industry. Ultimately, educators play an important role in training and educating tomorrow’s engineers. Thus, there is a need to be responsible and ensure that graduates have the tools to handle technically complex problems. LTPP provides a great resource to academics to accomplish this task.
The author gratefully acknowledges the students in her classes who take on these assignments with great enthusiasm. Their interest and feedback make the preparation time to develop problems worthwhile. In addition, special appreciation is extended to the LTPP staff for maintaining the Web site and making the data so readily available.
Haas, R. (1972). Skilled Manpower Requirements for the Canadian Transportation Industry. Report prepared for Department of Manpower and Immigration, Ottawa, Canada.
Tighe, S. (2003). “Succession Planning: Is the Civil Engineering Community Up For The Challenge?” Canadian Civil Engineer. Toronto, Canada, April–May, 20–23.
Tighe, S.L., Patel, A., Haas, R., and Hudson, W. R. (1997). "Education and Training Needs for Road Infrastructure Renewal." Proceedings of the X-III IRF World Meeting. Toronto, Canada.
Tighe, S., Haas, R., and Li, N. (2001). “Overlay Performance in the Canadian Strategic Highway Research Program’s LTPP Study.” Transportation Research Record No. 1778. Transportation Research Board, Washington, DC, 191–200.
Delatte, N. (2001, July).Personal communication on Using LTPP in graduate courses at the University of Alabama at Birmingham. Birmingham, AL.
Federal Highway Administration. (2003). “LTPP Guidelines for the Fourth International Contest on Using LTPP Data Analysis.” Washington, DC.
Haas, R. (2001). "Reinventing the (Pavement Management) Wheel." Distinguished Lecture, Proceedings of the Fifth International Conference on Managing Pavements. Seattle, WA.

