U.S. Department of Transportation
Federal Highway Administration
1200 New Jersey Avenue, SE
Washington, DC 20590
202-366-4000
Federal Highway Administration Research and Technology
Coordinating, Developing, and Delivering Highway Transportation Innovations
 |
| This report is an archived publication and may contain dated technical, contact, and link information |
|
Publication Number: FHWA-HRT-08-035 Date: March 2008 |
The existing empirical methodology used to determine dielectric constant and VMC were evaluated along with new mechanistic-based techniques to determine to determine the best approach to use in computing TDR traces collected at LTPP SMP sites. This section provides details on the evaluation conducted and details on the methodology selected for use on SMP TDR data.
The existing methodology used in the analysis of SMP TDR traces to determine the dielectric constant is shown in equation 5. The dielectric constant for the soil-moisture-air mixture has been determined by comparing the "apparent" electrical length (La) of the probe from the TDR signal to its actual length. This method of determination of the dielectric constant is independent of the conducting medium's other electrical properties besides the dielectric constant, which influences the resultant computed parameters because the soil magnetic permeability is, for instance, assumed to be unity. Saline or alkaline soils can create an effective electrical short with the shielding rods due to the ions in the water, which can increase the effect of conductivity on the value of the dielectric constant. Consequently, trace interpretation difficulties and erroneous determinations result because of the soil's high electrical conductivity, suggesting that an improved method of determining the dielectric constant would involve the consideration of the effect of the soil conductivity. Furthermore, the difficult-to-interpret wave forms result from "dispersion" and "attenuation," which are directly related to the level of electrical conductivity in the medium.
The dielectric constant-or permittivity-of a soil is really a complex number, composed of a real and an imaginary part. It is assumed in the above method of analyzing TDR data that the imaginary part is negligible. The imaginary part is a measure of the ratio of the electrical conductivity of the soil to the dielectric property that is computed from TDR data. Conductivity is important in identifying corrosive soils and in indicating the presence of anions, such as sulfates, which are capable of expanding to produce large buckling movements in lime-stabilized pavement layers. Reduction in the wave form distortion over time indicates that the conductive elements in the soil are leaching out. In short, when the TDR signal is distorted and, consequently, difficult to interpret, it is providing additional information about the soil permittivity.
The wave form shown in figure 2 is typical of a soil with low conductivity. The horizontal axis in that graph is labeled as an apparent length, La. However, it is a plot of the voltage measured by the TDR device versus the time of arrival of that voltage. This is a signal of voltage as a function of time exactly as is analyzed when using ground-penetrating radar signals. A distorted wave form can be further analyzed to produce both the real and the imaginary parts of the permittivity of the soil-and what has been previously considered to be a limitation of the equipment is actually a benefit.
In terms of the sources of error in TDR measurements, there is a difference between the meaning of "regular" and "distorted" waveforms. Measurement error is inherent in the instrumentation itself. This type of error is normally random and can be reduced by repeating the measurement. ([11]) The other kind of error is systematic error and arises from the assumptions that are made in the analysis of the data, precisely the type of error referred to in the above discussion. Further discussion in this regard will be presented later relative to the new approach to evaluate the soil dielectric property.
The new approach for the calculation of the VMC consists of three steps:
Step (1) involves the use of the TLE for voltage (V):(12)
![]() (19)
(19)
Where:
| V | = applied voltage |
| z | = distance along the transmission line (TDR probe), m |
| = | |
| c | =  |
| µ0 | = magnetic permeability of free space |
| = 4p x 10-7 H/m | |
| e0 | = electric permittivity of free space |
| = | |
| t | = time of travel relative to the peak relative voltage |
| V+ | = voltage amplitude in the positive z direction |
| V- | = voltage amplitude in the negative z direction |
| k | = dispersion coefficient = kR - jkI (real and imaginary components) |
| = | |
| = | |
| (i.e., kr = | |
| e | = dielectric constant of the soil |
| ? | = waveform frequency (Hz) |
| s | = soil conductivity (S/m) |
| L | = inductance (H/m) |
| = | |
| a, b | = inside and outside coaxial transmission line diameters, respectively (see figure 7) |
| µ | = soil magnetic permeability (H/m) |
| C | = capacitance (F/m) |
| = |

Figure 7. Diagram. Coaxial line dimensions. (12)
Developing further:
 = (20)
Where:
| GL | = reflection coefficient |
| = | |
| v(z) | = relative voltage as a function of the dimension z |
| = |
Writing the relative voltage (v(z)) in terms of time of travel (t) of the microwave:
 (21)
(21)
The above expression can be used to analyze the voltage trace that is obtained from the TDR device. Notice that the voltage is a function of not only the dielectric constant but also of the conductivity and the reflectivity. Both of these parameters affect the inferred dielectric constant, or, in other words, they influence the value as it would be deducted from the characteristics of the trace. Systematic errors that would result from not accounting for conductivity and reflectivity are corrected by accurately accounting for the actual physics of wave transmission through a dielectric medium in the model. The use of the TLE to analyze the data reduces the systematic error introduced by assuming that conductivity and reflectivity have no influence on the shape of the transmitted voltage with distance down the length of the TDR probe. The dielectric constants produced after correcting for the effects of conductivity and reflectivity more accurately and precisely reflect the actual moisture state of the soil. The concept of the TLE and electromagnetics involved in the new approach is addressed in more detail in appendix A.
The constants used to compute the dielectric constant are the voltage and relative distance, the magnetic permeability of free space, and the electric permittivity of free space. While the voltage and relative distance are obtained from the TDR trace, the magnetic permeability and electric permittivity are fixed values, which are 4p x 10-7 H/m and 1/36p x 10-9 F/m, respectively. The inside and outside diameters of the coaxial cable are not required to compute dielectric constant values using the TLE.
The method of solving for the dielectric, conductivity, and reflectivity parameters (step 1) is by use of the system identification method (SID).(11) This method is used to fit the equation for relative voltage (v(z)) to the form of the TDR trace (an example of which is shown in figure 2) by iterating ?Xi until it equals zero by satisfying the following expression for each point selected from the trace:
 (22)
(22)
Where:
| Xin | = conductivity (s), dielectric constant (e), or reflection coefficient (G) |
| m | = number of Xi (in this case = 3) that are determined for each voltage recorded from the TDR trace |
| ?Xin | = Xin+1i - Xin |
| n | = iteration count |
| = | |
| v(z)m | = the measured voltage |
| v(z)in | = the current calculated voltage based on the current values of Xin |
In matrix form, the iteration process is capable of solving a set of simultaneous equations developed for each set of data points taken from the TDR trace:
![]() (23)
(23)
Where:
| [F] | = matrix of |
| {ß} | = matrix of |
= matrix of  elements (residual vector) elements (residual vector) |
The number of recorded voltage points from the TDR trace determines the number of rows in matrices
[F] and
![]() ; where the number rows in {ß} and the number of columns in [F] depends on the number of unknowns. Solving for {ß}:
; where the number rows in {ß} and the number of columns in [F] depends on the number of unknowns. Solving for {ß}:
![]() (24)
(24)
By minimizing the {ß} matrix, solutions for Xin (i.e., conductivity (s), dielectric constant (e), and the reflection coefficient (G)) are found. The minimization of error contained within the residual matrix ![]() is analogous to the minimization or reduction of error employed in least squared error analysis as elaborated in appendix B. Another type of systematic error is reduced by the method of allocation inherent in the use of the SID approach. The squared error between the actual measurement and the predicted measurement (residual matrix
is analogous to the minimization or reduction of error employed in least squared error analysis as elaborated in appendix B. Another type of systematic error is reduced by the method of allocation inherent in the use of the SID approach. The squared error between the actual measurement and the predicted measurement (residual matrix![]() ) is calculated by using the physically correct model of a mixture dielectric to determine the sensitivity of the weighting coefficients for allocating the squared error. It is possible to adjust the model coefficients until there is no squared error remaining. However, because of the presence of random error (i.e., measurement error in the TDR device), the values of the residual matrix
) is calculated by using the physically correct model of a mixture dielectric to determine the sensitivity of the weighting coefficients for allocating the squared error. It is possible to adjust the model coefficients until there is no squared error remaining. However, because of the presence of random error (i.e., measurement error in the TDR device), the values of the residual matrix ![]() should not be forced to zero.
should not be forced to zero.
Furthermore, the size of the random errors should be determined by statistical evaluation of repeated TDR measurements that are not presently available. Inherent in this analysis are the minimum number of points (N) from the TDR trace that should be used to provide a reasonably accurate estimate of the dielectric constant. Accordingly, this analysis suggests that using twice as many data points as the number of coefficients to be computed (which would be 6 in this case) would be sufficient in estimated dielectric constant, conductivity, and reflectivity assuming a measurement error of 3 percent in the TDR voltage trace. In this regard, the six points would be selected between the first and second inflection points, where the first and second inflection points are points 1 and 6, respectively, and the other four points were equally distributed between the inflection points.
This approach was used only for the calibration process (step 2) to characterize the manual TDR traces obtained from the installation reports. In the computational program, which was developed for the new approach, all data points between the inflection points were used to determine the dielectric constant because the data are readily available in the automated TDR trace format, allowing the program to interpret a large number of points relatively quickly.
The VMC is currently estimated in the Moister program from the measured dielectric constant using regression-type equations 8 or 9. It is suggested from literature that a more fundamental approach would account for the effect of individual constituent soil dielectrics on the moisture content.(12) In this regard, a theory of dielectric properties of composite materials from a micromechanics/self consistent scheme yields a general expression for the composite dielectric constant (e-for a 2-phase system):([13])
 (25)
(25)
Where:
| e1 | = dielectric constant for phase 1 |
| e2 | = dielectric constant for phase 2 |
| v1 | = volume fraction of phase 1 |
| v2 | = volume fraction of phase 2 |
The justification for a self-consistent scheme lies in the volume fractional bounds or limits in which the computed VMC fall. In other words, the computed moisture contents (based on equation 28 below) are consistent with bounded values of dielectric constants of the individual phases and their volume fractions. The upper (+) and lower (-) dielectric expressions, illustrated in figure 8, are as follows:
 (26)
(26)
 (27)
(27)
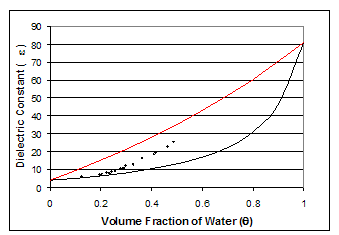
Figure 8. Graph. Bounding of dielectric constant as a function of the computed volumetric moisture content (q ) using equation 28.
Using this concept, an expression can be written based on equation 25 for a three-phase system (air, water, and solids-such as in a soil material):
 (28)
(28)
Where:
| ?d | = dry density of soil, g/cm3 |
| Gs | = specific gravity of soil |
| ?w | = density of water, g/cm3 |
| e1 | = dielectric constant of solids |
| e2 | e2 |
| e3 | = dielectric constant of air (= 1) |
| e | = dielectric constant of the soil determined from step 1 |
| ? | = ratio of soil fraction |
With a value for e determined from the SID analysis of a TDR trace, values of e1, e2, and Gs of the model are adjusted based on the ground truth data of measured values of ?d and ?. The dielectric constants of the water (e2) and the soil solids (e1) can be found by applying the SID approach to equation 28. Typical values of e1 range between 3 and 5 while typical values of Gs range between 2.6 and 2.9. Using this approach, analysis results of selected TDR traces are shown in tables 6 and 7. Computations of the dielectric constant based on the apparent length method are headed by the notation of "La" while the proposed determinations made by the new approach are noted by the heading "new." The calibration shown in table 7 also includes the Gs parameter.
| Section/TDR # | Soil Type | Dry Density (g/cm3) | Soil Dielectric | Volumetric Moisture Contents (%) | ||||
|---|---|---|---|---|---|---|---|---|
| La | New | Field Measured | MOISTER Program | Micro-mechanics Method | ||||
| 364018/9 | Gravel | 2.24 | 9.83 | 10.04 | 26.12 | 17.33 | Coarse-Ka | 25.71 |
| 091803/4 | Sand | 2.26 | 14.02 | 14.33 | 33.28 | 22.71 | Coarse-Ka | 32.92 |
| 131031/8 | Silt | 1.80 | 12.16 | 18.40 | 40.75 | 20.53 | Coarse-Ka | 39.86 |
| 421606/6 | Clay | 1.94 | 7.34 | 5.76 | 19.01 | 17.57 | Fine-Ka | 18.75 |
* All information used was obtained from Installation Reports.
| Section | Dielectric Constant | Specific Gravity (Gs) | ||
|---|---|---|---|---|
| Soil (e 1) | Water (e 2) | Air (e 3) | ||
| 364018 | 3.70 | 79.7 | 1.0 | 2.70 |
| 091803 | 3.65 | 80.4 | 1.0 | 2.74 |
| 131031 | 3.47 | 79.9 | 1.0 | 2.77 |
| 421606 | 3.38 | 80.0 | 1.0 | 2.78 |
In the forward calculation of volumetric water content and dry density that is performed in step 3, the self-consistent model in equation 28 is used together with the calibration constants e1, e 2, and Gs to determine the new values of ?d and ? from values of the dielectric constant for the soil mixture derived from subsequent TDR data collection records. These new dielectric values are determined by analysis of the TDR traces obtained at different times throughout the monitoring period. Thus, once particular soil characteristics e 1, e2, and Gs are "identified" by step 2, all future calculations of gd and q can be determined from the SID in step 3 using a new soil mixture dielectric constant measured in step 1. Along with the calculation of ?d and ?, the volume relationship of degree of saturation (S), porosity (n), and void ratio (e) can be redefined from step 3:
 (29)
(29)
 (30)
(30)
![]() (31)
(31)
It is important to note that two additional sources of systematic error are countered in this approach. First, the three-phase model accounts for the dielectric effect of the air in the soil. Additionally, dry unit weights are obtained from each TDR trace and not assumed to be constant over time.
The new procedures' effectiveness was analyzed by comparing the moisture content computed both from the MOISTER program and the micromechanics method to laboratory moisture content tests from representative SMP sites. Ground truth data that are linked to specific TDR traces for SMP soils were identified from three sources.
All three of these sources provide important reference moisture contents to evaluate the capabilities of the micromechanics model. These sources provided the only data available to conduct validation specific to the LTPP equipment and protocols.
The first validation consisted of comparing the moisture content from the laboratory tests in various installation reports to that indicated by the MOISTER program and the micromechanics method. This was presented as part of the calibration process and in table 6. Figure 9 further demonstrates how the calibration of the micromechanics method provides accurate estimates of the ground truth data. While promising, it was necessary to verify the accuracy of the methodology against both laboratory and field data to establish confidence in the micromechanics method.
A second verification effort consisted of computing the moisture content and dry density for the test data noted in Klemunes' thesis work.(5) Data from four of the 28 SMP sections used in the study were selected to provide a range of soil types (i.e., gravel, sand, silt, and clay). For each SMP section, one TDR trace obtained during installation (and corresponding moisture content/dry density) was used to calibrate the micromechanics model. Calibration information relative to the soil and water dielectric constants can be found in table 8. Using this information and the TDR traces obtained at different moisture contents, estimates of moisture content and dry densities were computed and can be found in table 9 along with estimates from the MOISTER program and the laboratory test results. Figure 10 provides the associated difference of each method for all trials. As can be seen, the micromechanics method provides relatively accurate estimates of actual moisture conditions with the majority of estimates falling within 5 percent of the laboratory derived data. Given the circumstances surrounding the collection of the different types of moisture data involved in this analysis, the degree of comparability is remarkable. The evaluation of estimated dry densities was performed through a comparison to measured values obtained from laboratory testing. Figure 11 shows the relatively high capability and accuracy of the micromechanics model in estimating dry density with a maximum resulting difference of less than 6 percent. This verification was considered to be laboratory verification as the soil mixtures and TDR traces were obtained in a laboratory setting where the sampling and data collection were more controlled.
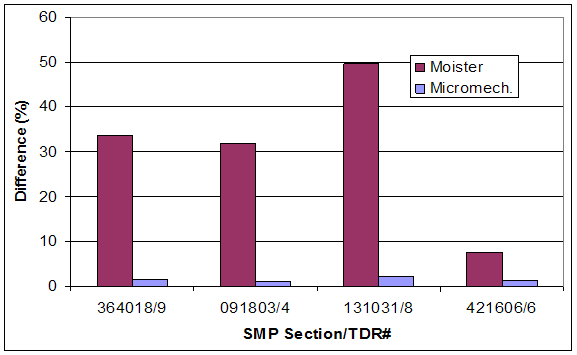
Figure 9. Bar Chart. Errors in volumetric moisture content estimates (calibration validation).
| Section | Soil Type | Spec. Gravity | Dry Density (g/cm3) | Dielectric Constant | Volumetric Moisture Content (%) | |
|---|---|---|---|---|---|---|
| Soil (e 1) | Water (e 2) | |||||
| 271028 | Gravel | 2.724 | 2.017 | 3.79 | 80.6 | 7.06 |
| 231026 | Sand | 2.782 | 1.960 | 3.79 | 80.0 | 19.35 |
| 091803 | Silt | 2.864 | 2.264 | 3.89 | 81.0 | 20.38 |
| 081053 | Clay | 2.890 | 1.634 | 3.79 | 80.0 | 21.57 |
| Section | Soil Type | Dry Density (g/cm3) | Volumetric Moisture Contents (%) | |||||
|---|---|---|---|---|---|---|---|---|
| Lab. | M.M.1 | Ground Truth (Lab Result) | Moister Program (3rd Polynomial Equation) | M.M.1 | ||||
| 271028 | C | Gravel | 1.730 | 1.810 | 7.09 | 9.36 | Coarse-Ka | 7.79 |
| F | 1.712 | 1.700 | 12.50 | 13.92 | Coarse-Ka | 12.17 | ||
| K | 1.766 | 1.869 | 18.98 | 20.06 | Coarse-Ka | 19.78 | ||
| 231026 | B | Sand | 1.574 | 1.558 | 14.88 | 15.40 | Coarse-Ka | 14.25 |
| F | 1.635 | 1.610 | 22.98 | 21.78 | Coarse-Ka | 21.95 | ||
| M | 1.605 | 1.569 | 7.54 | 8.34 | Coarse-Ka | 7.18 | ||
| 091803 | C | Silt | 0.976 | 0.989 | 38.45 | 29.63 | Fine-Ka | 38.05 |
| I | 0.965 | 0.924 | 27.12 | 21.01 | Fine-Ka | 28.07 | ||
| P | 0.965 | 0.927 | 29.65 | 20.48 | Fine-Ka | 28.94 | ||
| W | 0.973 | 0.923 | 39.30 | 32.35 | Fine-Ka | 38.16 | ||
| 081053 | G | Clay | 1.406 | 1.350 | 44.07 | 51.80 | Fine-Gradation | 44.81 |
| K | 1.40 | 1.321 | 48.83 | 51.80 | Fine-Gradation | 48.03 | ||
| U | 1.377 | 1.440 | 30.72 | 29.67 | Fine-Gradation | 31.29 | ||
1Micromechanics method.
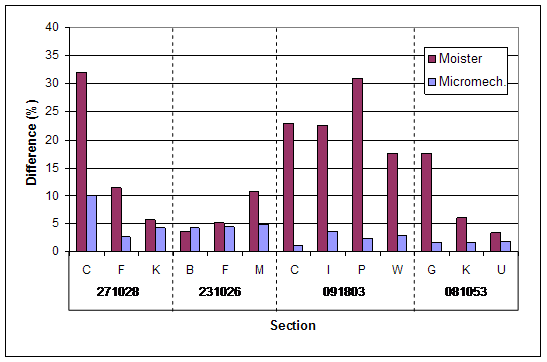
Figure 10. Bar Chart. Errors of volumetric moisture contents on ground truth data (laboratory validation).

Figure 11. Bar Chart. Errors of laboratory estimated dry density on ground truth data (laboratory validation).
A third evaluation was performed using the data being developed for the forensic report on LTPP-SMP site 091803. In this case, the micromechanics method was calibrated using the laboratory moisture content obtained during the equipment installation as shown in table 10. The calibrated model was used to estimate moisture content based on the TDR traces obtained during the forensic investigation. These resulting moisture estimates were compared to the laboratory test results for samples taken just after the TDR traces were obtained during the forensic activities. Those test comparisons can be seen in table 11 with the resulting difference quantities in figure 12. In general, error of the micromechanics method is very low and is under 5 percent for all but one scenario. The values of dry density estimated by the new approach were evaluated by comparing them to measured values. As shown in figure 13, the resulting differences on measured values were slightly greater than for the laboratory verification but still highly accurate at less than 7 percent.
| Layer Type | Specific Gravity | Dry Density (g/cm3) | Dielectric Constant | Volumetric Moisture Content (%) | |
|---|---|---|---|---|---|
| Soil (e 1) | Water (e 2) | ||||
| Base | 2.44 | 2.255 | 3.69 | 79.8 | 25.71 |
| Subbase | 2.74 | 2.260 | 3.65 | 80.4 | 32.92 |
| Layer Type | TDR No. | Depth (mm) | Dry Density (g/cm3) | Volumetric Moisture Content (%) | |||||
|---|---|---|---|---|---|---|---|---|---|
| Field | M.M.2 | Ground Truth | Moister Program | M.M. 2 | |||||
| Base | Medium brown gravel | 1 | 330 | 2.229 | 2.297 | 17.39 | 20.69 | Coarse-Ka | 16.25 |
| 2 | 437 | 2.255 | N/A1 | 15.81 | N/A1 | - | N/A1 | ||
| Subbase | Grayish brown silty gravel with large rock | 3 | 584 | 2.163 | 2.243 | 27.94 | 26.96 | Coarse-Ka | 26.75 |
| 4 | 737 | 2.163 | 2.293 | 26.00 | 22.54 | Coarse-Ka | 26.34 | ||
| 5 | 889 | 2.166 | 2.021 | 19.82 | 22.54 | Coarse-Ka | 19.19 | ||
| 6 | 1041 | 2.192 | 2.343 | 16.80 | 20.69 | Coarse-Ka | 17.11 | ||
| 7 | 1194 | 2.192 | 2.196 | 20.75 | 21.25 | Coarse-Ka | 21.67 | ||
| 8 | 1346 | 2.091 | 1.988 | 25.76 | 25.94 | Coarse-Ka | 25.57 | ||
1Impossible to interpret TDR trace.
2Micromechanics method.
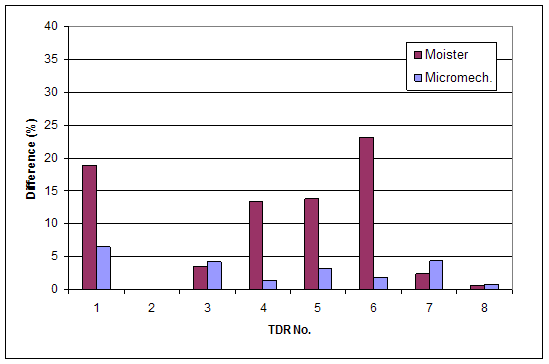
Figure 12. Bar Chart. Errors of volumetric moisture contents on ground truth data (field validation).
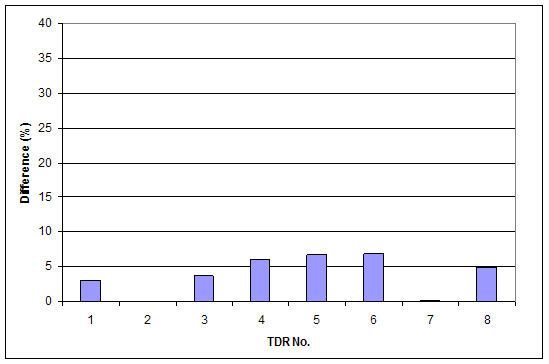
Figure 13. Bar Chart. Errors of estimated dry density on ground truth data (field validation).
Through these three validation exercises, it was found that the micromechanics method is capable of predicting accurate moisture and density results. The largest variation between estimates from the micromechanics method and the measured values was under 10 percent with the vast majority falling under 5 percent.
Based on the results of this evaluation, it was proposed that the micromechanics method be used to compute moisture estimates for all interpretable TDR data in the LTPP database. This approach was approved by FHWA. Developing a computer program and methodologies necessary for computing and reviewing parameters for the LTPP database is described in the next chapter.
| < Previous | Contents | Next >> |