U.S. Department of Transportation
Federal Highway Administration
1200 New Jersey Avenue, SE
Washington, DC 20590
202-366-4000
Federal Highway Administration Research and Technology
Coordinating, Developing, and Delivering Highway Transportation Innovations
 |
| This report is an archived publication and may contain dated technical, contact, and link information |
|
Publication Number: FHWA-HRT-08-035 Date: March 2008 |
As a part of the study, a computational program was developed to interpret TDR traces and estimate dry density and moisture content using the TLE and micromechanics models. Due to the large differences between the former and current approaches, a new computational program named LTPP MicroMoist was developed to facilitate proper interpretation of the collected traces. However, some of the programming from the MOISTER program was utilized in developing the new program. Much of the appearance and graphical viewing features in the LTPP MicroMoist program were copied from the source code of the MOISTER program.
The program was designed to automate the interpretation process with consideration given to certain user input data to ensure the highest quality end product. The program generates output database tables that store data to be uploaded into the LTPP database. The tables can also be used to review data as part of QC processes. Figure 14 shows the main display screen of the new program. A summary of the procedures in the new program can be found in table 12. The user's manual for the program can be found in appendix C.
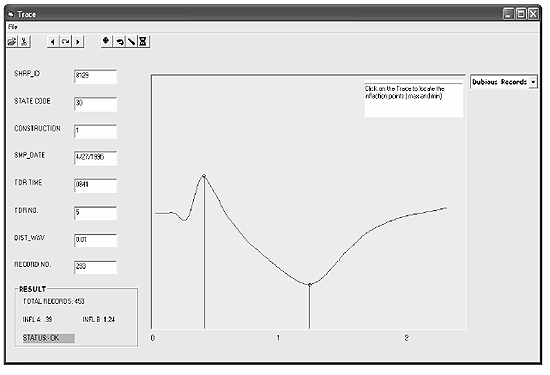
Figure 14. Photo. Interface of new program.
| Procedures | MicroMoist program |
|---|---|
| Determination of inflection points | Local maxima/minima located and used as beginning/ending points for the range of data to be analyzed. |
| Calculation of dielectric constant | Transmission line equation (function of dielectric constant, conductivity, and reflectivity of the soil composite) |
| Calculation of moisture content | Micromechanics/self consistent model (calibrated to site-specific conditions using installation data) |
| Calculation of dry density | Micromechanics/self consistent model (calibrated to site-specific conditions using installation data) |
| Input table | SMP_TDR_AUTO SMP_TDR_DEPTHS_LENGTH SMP_TDR_CALIBRATE (developed from TDR traces and moisture contents acquired during installation) |
| Output table | SMP_TDR_AUTO_DIELECTRIC SMP_TDR_MOISTURES |
The program logic flow consists of three parts: (1) determination of the TDR trace inflection points, (2) calculation of the soil dielectric constant, and (3) computation of the soil moisture content and dry density. These steps are automatically performed with logical checks and user input incorporated, where applicable.
A local peak in the TDR trace is created as the electromagnetic wave enters the TDR probe. From this point, the trace falls to a local minimum point and then rebounds upward at a lower rate as the wave hits the end of the probe. Figure 15 depicts the inflection points on TDR traces. The descending portion of the trace represents the waveform at the TDR sensor. This is the portion of the trace that is of interest for soil parameter computation because it represents the characteristics of the in situ soil. Therefore, the inflection points were used to identify the limits for the range of points in the TLE.
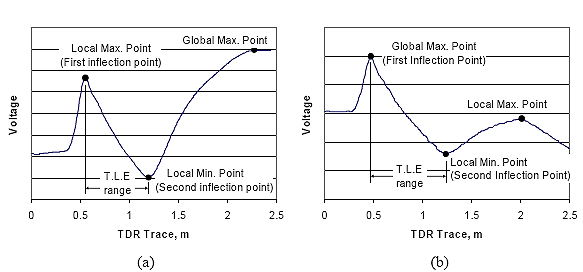
Figure 15. Graph. Inflection points in TDR trace.
The inflection points are determined by the program using a step-wise routine. Depending on the distance between wave points, which usually is 0.01 m but can be 0.02 m, the local maxima search routine is limited to the left portion of the trace. A complete TDR trace consists of 245 data points. For traces with a wave point distance of 0.01 m, the maxima search routine is limited to the first 200 data points. For traces with a wave point spacing of 0.02 m, the maxima search routine only involves the first 100 data points. By doing this, the program reduces the number of iterations and accelerates the process without reducing the utility of the program.
This step-wise iteration consists of the following steps:
Along with the determination of the inflection points, the above routine helps to locate records without a negative slope. Where both points fall at the same location or the magnitude of the second point is higher than that of first point, the trace is deemed to have a positive slope between inflection points. These cases may indicate that the traces were taken in frozen soil and are flagged as suspect records. Additionally, the program allows the user to review each trace and manually adjust the inflection point locations, if necessary. Figure 16 illustrates the flow chart of the inflection point determination.
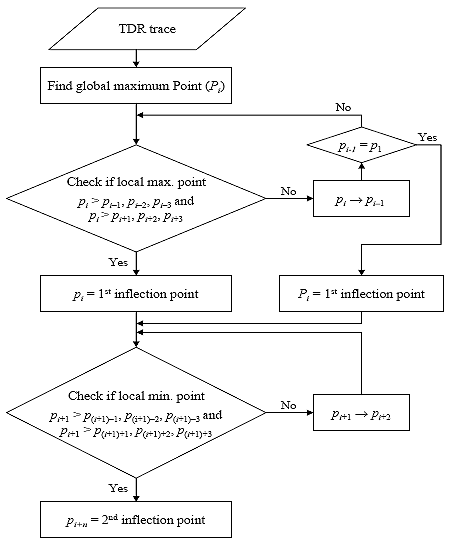
Figure 16. Flowchart. Determination of inflection points.
Once the inflection points are determined, the program calculates the dielectric constant, conductivity, and reflectivity using the TLE and the SID solution method previously defined. The calculation is conducted based on fitting the measured voltage trace between the inflection points using the iteration process described in chapter 3. While six points from the installation TDR traces were used in the calibration process, all data points between the inflection points were used in the MicroMoist program to determine the dielectric constant. The program calculates the dielectric constant, conductivity, and reflectivity using the automated TDR traces acquired from the LTPP Information Management System (IMS) database. By using all of the data points, the accuracy of the TDR interpretation is improved. The calculation process involves the following steps:
These steps are implemented for each trace, and the values of dielectric constant, reflectivity, and conductivity are stored in the SMP_TDR_AUTO_DIELECTRIC table. The dielectric constant value is then used to calculate moisture content and dry density.
The constants used to compute the dielectric constant are the voltage and relative distance, the magnetic permeability of free space, and the electric permittivity of free space. While the voltage and relative distance are obtained from the TDR trace, the magnetic permeability and electric permittivity values are fixed values, which are 4p x 10-7 H/m and 1/36p x 10-9 F/m, respectively. Therefore, users do not need to change any constants for the computation of the dielectric constant in the program. Figure 17 illustrates this calculation procedure.
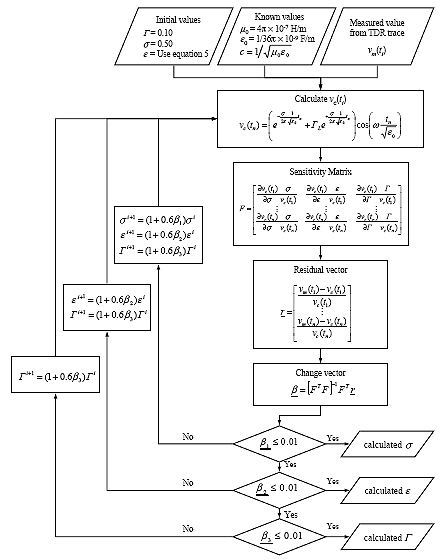
Figure 17. Flowchart. Calculation of dielectric constant, conductivity, and reflectivity.
Moisture content and dry density are calculated based on the micromechanics and self consistent models previously described. The e1, e2, and Gs parameters in these models are calibrated to site-specific conditions based on TDR traces and moisture content testing performed during installation. The dielectric constant of the soil, determined from the SID iteration process, is also an input into the model. The following routine was used for this calculation in the program:
![]() (32)
(32)
The VMC and dry density calculated from the above procedure are presented in the output table, MICROMOIST_SMP_TDR_MOISTURES, and are also used to compute the gravimetric moisture contents.
In this step, the calibrated dielectric constants of solid and water as well as the specific gravity are used as constants. The density of water and the dielectric constant of air are also needed, but they are fixed as 1.0 g/cm3 and 1.0, respectively. In the micromechanics method, the physical properties of the TDR probe, such as length of TDR, are not considered in the computation process. Therefore, the program can be used to interpret other types of TDR probes as long as calibration data are available. Figure 18 illustrates the procedure for calculating the dry density and moisture content values.
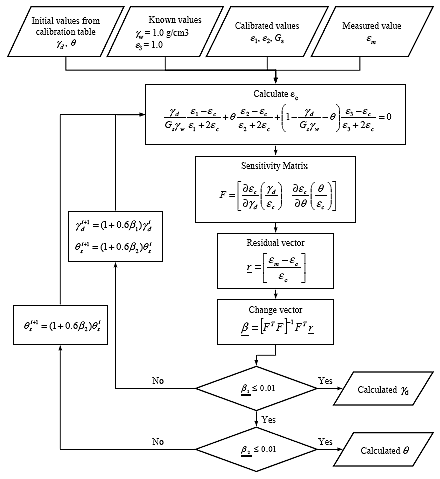
Figure 18. Flowchart. Calculation of moisture content and dry density.
In order to calculate the moisture content and dry density using the new approach, the program requires the following calibration values for each SMP site and each layer:
These values are calibrated using the ground truth data obtained from the LTPP SMP Site Installation and Initial Data Collection reports for each SMP test section. (2) The ground truth data consisted of measured moisture content and manual TDR traces recorded during the installation process as well as dry density values available in the LTPP database. This calibration data are stored in the MICROMOIST_SMP_TDR_ CALIBRATE table.
The manual trace taken during installation is used to determine dielectric constant of the soil using the TLE and routine. This dielectric constant is used in the micromechanics equation to determine moisture content and dry density. The micro-mechanics equation is calibrated to each site and layer by adjusting the dielectric constant of solids, dielectric constant of water, and the specific gravity. Adjustments are made to these parameters so that the predicted moisture content and dry density (from manual TDR traces) are equivalent to the measured ground truth moisture content (taken at installation) and the measured ground truth dry density (reported in the LTPP database).
The adjusted values for dielectric of solids, dielectric of water, and specific gravity are then used for subsequent moisture and density estimates for the site/layer combination. In essence, the micromechanics model is calibrated to every site/layer combination before it is used to generate moisture estimates for subsequent TDR traces.
Because the TDR traces obtained during installation were measured manually, they required digitization to obtain actual data points for use in the routine. Data Thief ? was used to digitize the manual TDR traces into engineering data points. ([14]) The digitized TDR trace provided easily identifiable data points including the inflection data points in which to calculate the dielectrics. Figure 19 shows an example of a manually measured TDR trace and its corresponding digitized TDR trace.
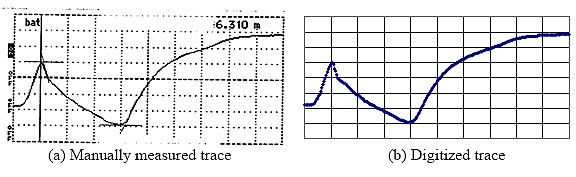
Figure 19. Graph. TDR traces of Section 308129, TDR No. 8.
Based on the digitized data points, the dielectric constant, conductivity, and reflectivity were calculated using the TLE and the SID method.
To calibrate the dielectric contents of soil components and specific gravity, the measured dry density and VMC were required at each TDR location for all the SMP sites.
Moisture content measured during installation was reported in the SMP Installation Reports and was given in terms of gravimetric moisture content. Equation 18 was used to convert the gravimetric values to VMC for use in the calibration process.
Because in situ dry density data was not always available from the SMP Installation Reports, information was taken from multiple locations within the LTPP database. The following sources were queried to acquire the information:
The dry density of the highest priority source was used if more than one source provided dry density information. (7) Additionally, these dry densities were adjusted based on depth, as described in the following section.
Although the in situ gravimetric moisture contents were measured for each TDR depth, only a single dry density was reported for each layer type. It is known that dry density is influenced by the depth below the surface. Therefore, adjustments to the reported dry density values were required to reflect conditions at each TDR depth. Additionally, it was observed that dry densities and measured moisture contents resulted in unreasonable phase diagram volumetrics. In these cases, adjustments were made to correct for negative air voids in the soil. The following procedure was followed to adjust the reported dry densities:
Using the measured gravimetric moisture content and reported dry density, the volume of each component and porosity of soil was calculated using equations 32, 34, and 35.
 (33)
(33)
![]() (34)
(34)
![]() (35)
(35)
Where:
| ?w | = volumetric moisture content (%) |
| ?s | = volumetric solid content (%) |
| ?a | = volumetric air content (%) |
Porosity, defined in figure 20, can be calculated as:
 (36)
(36)
Where:
| n | = porosity of soil |
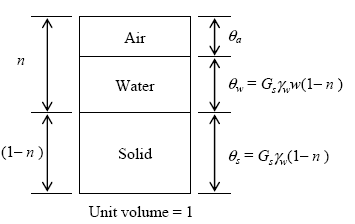
Figure 20. Diagram. Three separate phases of a soil element.
Step 2. Adjust Porosities, Densities, Volumes of Soil Components Based on Depth
Each layer has a single porosity, but due to the assumption that dry density varies as a function of depth, the values of porosity will also vary accordingly within each layer. Therefore, all porosities were adjusted based on vertical location using the following equation.
 (37)
(37)
Where:
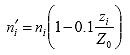
| i | = number of TDR placed at each layer |
| n'i | = recomputed porosity of ith TDR depth at each layer (%) |
| zi | = depth of ith for each layer TDR from surface |
| Z0 | = depth of last TDR for each layer from surface (Z0 > zi) |
Equation 37 is a general rule useful for checking the consistency of 10 densities and moisture contents based on the assumption porosities should decrease with depth. Figure 21 is provided to illustrate Z0 and zi in this adjustment process.
Using the recomputed porosity values, the dry density and volumetric contents of solids, water, and air were recalculated for each TDR using the following equations.
![]() (38)
(38)
 (39)
(39)
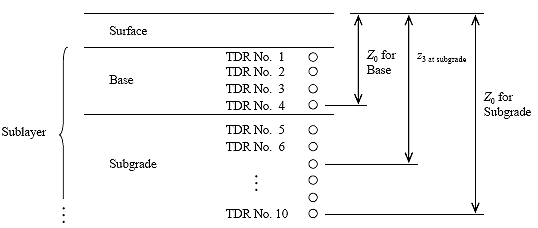
Figure 21. Diagram. Profile of TDR and depth at each layer.
 (40)
(40)
![]() (41)
(41)
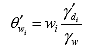
Where:
| ?d | = recalculated dry density using n'i |
| ?'wi, ?'si, ?'ai | = recalculated volume of water, solids, and air (%) |
Step 3. Air volume check and dry density adjustment
The air volume in a soil mixture cannot be less than zero but could be equal to zero if the soil is fully saturated. This condition is defined in terms of the porosity, gravimetric moisture content, and specific gravity:
![]() (42)
(42)
Which can be defined as:
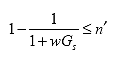 (43)
(43)
If the air volume recalculated in step 2 was less than zero, it was assumed that the soil was fully saturated and that the air volume was zero:
![]() (44)
(44)
Thus, the porosity was adjusted with equation 43 to achieve an air volume of zero:
![]() (45)
(45)
Where:
| n" | = adjusted porosity for soil having negative air volume |
Using the adjusted porosity, the dry density was also adjusted using equation 46.
![]() (46)
(46)
Where:
| ?"d | = adjusted dry density for soil having negative air volume |
The volumes of water and solid were also recomputed using the adjusted dry density value (?"d):
![]() (47)
(47)
![]() (48)
(48)
![]() (49)
(49)
Where:
| ?w, ?s, ?a | = adjusted volume of water, solids, and air |
This adjustment was only performed if the air volume was found to be less than zero. If the air volumes at TDR probes were larger than zero, the porosity and dry density determined from step 2 were utilized in the calibration process.
As an example, table 13 shows the adjustment process of sections 331001 and 533813. TDR sensor numbers 4 and 5 for section 331001 and numbers 3, 4, and 5 of section 533813 had negative values of air volume based on step 2 calculations. After applying equation 44 and 45, the dry densities were adjusted and the volumes of air were converted to zero. The dry densities of all other TDR sensors remained at the values calculated in step 2 because their air volumes were larger than zero. The final dry densities and VMC were placed in the fields of DRY_DENSITY and VOLUMETRIC_MOISTURE_CONTENT, respectively, in the MICROMOIST_SMP_TDR_CALIBRATE table.
| Section | TDR No | Layer Type | w | ?d | Gs | Step 1 | Step 2 | Step 3 | |||||||||||
|---|---|---|---|---|---|---|---|---|---|---|---|---|---|---|---|---|---|---|---|
| ?w | ?s | ?a | n | n" | ?'d | ?'w | ?'s | ?',a | n'' | ?" | ?"w | ?"s | ?",a | ||||||
| 331001 | 1 | Base | 2.55 | 2.153 | 2.695 | 0.05 | 0.80 | 0.15 | 0.20 | 0.19 | 2.18 | 0.06 | 0.81 | 0.13 | 0.19 | 2.18 | 0.06 | 0.81 | 0.13 |
| 2 | Base | 2.16 | 0.05 | 0.80 | 0.15 | 0.20 | 0.19 | 2.19 | 0.05 | 0.81 | 0.14 | 0.19 | 2.19 | 0.05 | 0.81 | 0.14 | |||
| 3 | Base | 3.75 | 0.08 | 0.80 | 0.12 | 0.20 | 0.18 | 2.21 | 0.08 | 0.82 | 0.10 | 0.18 | 2.21 | 0.08 | 0.82 | 0.10 | |||
| 4 | Subbase | 10.75 | 2.105 | 2.647 | 0.23 | 0.80 | -0.02 | 0.20 | 0.20 | 2.13 | 0.23 | 0.80 | -0.03 | 0.22 | 2.06 | 0.22 | 0.78 | 0.00 | |
| 5 | Subbase | 11.00 | 0.23 | 0.80 | -0.03 | 0.20 | 0.20 | 2.13 | 0.23 | 0.80 | -0.04 | 0.23 | 2.05 | 0.23 | 0.77 | 0.00 | |||
| 6 | Subgrade | 9.73 | 1.858 | 2.647 | 0.18 | 0.70 | 0.12 | 0.30 | 0.28 | 1.90 | 0.19 | 0.72 | 0.10 | 0.28 | 1.90 | 0.19 | 0.72 | 0.10 | |
| 7 | Subgrade | 6.16 | 0.11 | 0.70 | 0.18 | 0.30 | 0.28 | 1.91 | 0.12 | 0.72 | 0.16 | 0.28 | 1.91 | 0.12 | 0.72 | 0.16 | |||
| 8 | Subgrade | 5.85 | 0.11 | 0.70 | 0.19 | 0.30 | 0.28 | 1.91 | 0.11 | 0.72 | 0.17 | 0.28 | 1.91 | 0.11 | 0.72 | 0.17 | |||
| 9 | Subgrade | 6.99 | 0.13 | 0.70 | 0.17 | 0.30 | 0.27 | 1.93 | 0.13 | 0.73 | 0.14 | 0.27 | 1.93 | 0.13 | 0.73 | 0.14 | |||
| 10 | Subgrade | 7.89 | 0.15 | 0.70 | 0.15 | 0.30 | 0.27 | 1.94 | 0.15 | 0.73 | 0.12 | 0.27 | 1.94 | 0.15 | 0.73 | 0.12 | |||
| 533813 | 1 | Subbase | 12.20 | 1.885 | 2.734 | 0.23 | 0.69 | 0.08 | 0.31 | 0.30 | 1.91 | 0.23 | 0.70 | 0.07 | 0.30 | 1.91 | 0.23 | 0.70 | 0.07 |
| 2 | Subbase | 12.90 | 0.24 | 0.69 | 0.07 | 0.31 | 0.30 | 1.92 | 0.25 | 0.70 | 0.05 | 0.30 | 1.92 | 0.25 | 0.70 | 0.05 | |||
| 3 | Subbase | 16.00 | 0.30 | 0.69 | 0.01 | 0.31 | 0.29 | 1.94 | 0.31 | 0.71 | -0.02 | 0.30 | 1.90 | 0.30 | 0.70 | 0.00 | |||
| 4 | Subbase | 18.90 | 0.36 | 0.69 | -0.05 | 0.31 | 0.29 | 1.95 | 0.37 | 0.71 | -0.08 | 0.34 | 1.80 | 0.34 | 0.66 | 0.00 | |||
| 5 | Subbase | 15.70 | 0.30 | 0.69 | 0.01 | 0.31 | 0.28 | 1.96 | 0.31 | 0.72 | -0.02 | 0.30 | 1.91 | 0.30 | 0.70 | 0.00 | |||
| 6 | Subbase | 13.20 | 0.25 | 0.69 | 0.06 | 0.31 | 0.28 | 1.97 | 0.26 | 0.72 | 0.02 | 0.28 | 1.97 | 0.26 | 0.72 | 0.02 | |||
| 7 | Subgrade | 14.90 | 1.821 | 2.717 | 0.27 | 0.67 | 0.06 | 0.33 | 0.31 | 1.88 | 0.28 | 0.69 | 0.03 | 0.31 | 1.88 | 0.28 | 0.69 | 0.03 | |
| 8 | Subgrade | 14.80 | 0.27 | 0.67 | 0.06 | 0.33 | 0.31 | 1.88 | 0.28 | 0.69 | 0.03 | 0.31 | 1.88 | 0.28 | 0.69 | 0.03 | |||
| 9 | Subgrade | 13.20 | 0.24 | 0.67 | 0.09 | 0.33 | 0.30 | 1.90 | 0.25 | 0.70 | 0.05 | 0.30 | 1.90 | 0.25 | 0.70 | 0.05 | |||
| 10 | Subgrade | 14.90 | 0.27 | 0.67 | 0.06 | 0.33 | 0.30 | 1.91 | 0.28 | 0.70 | 0.01 | 0.30 | 1.91 | 0.28 | 0.70 | 0.01 | |||
Using the dielectric constant (determined from the manual TDR trace taken at installation) and the ground truth measured moisture content and dry density,e1,e2, and Gs values were calculated. The value of e3 was defined as 1.0. The calibrated dielectric constants of solids and water ranged between 3 and 4.5 and 78 and 82, respectively.
The fundamental assumption associated with the micromechanics and self consistent scheme is that each layer is statistically homogeneous. Therefore, one set of e1, e2, and Gs values were used for each test section/layer combination. That is, the samee1, e2, and Gs values were utilized to calculate moisture content and dry density for all TDR probes placed in the same layer. Thee1,e2, and Gs values used were averages from all TDR traces in the layer. Table 14 shows the calibrated values and average values at each layer for LTPP sections 331001 and 533813 as an example.
| Section | TDR No | TDR Depth | Layer Type | Soil Type | Measured Values | Calibrated Values | Average Values | ||||||||
|---|---|---|---|---|---|---|---|---|---|---|---|---|---|---|---|
| w | ?d | ? | e1 | e2 | e3 | Gs | e1 | e2 | e3 | Gs | |||||
| 331001 | 1 | 0.362 | Base | Gravel | 2.55 | 2.153 | 5.49 | 3.90 | 80.06 | 1.0 | 2.695 | 3.90 | 80.06 | 1.0 | 2.695 |
| 2 | 0.518 | Base | Gravel | 2.16 | 2.153 | 4.65 | 3.89 | 80.06 | 1.0 | 2.694 | |||||
| 3 | 0.683 | Base | Gravel | 3.75 | 2.153 | 8.07 | 3.92 | 80.07 | 1.0 | 2.695 | |||||
| 4 | 0.819 | Subbase | Sand | 10.75 | 2.105 | 22.63 | 4.08 | 80.02 | 1.0 | 2.647 | 4.08 | 80.02 | 1.0 | 2.647 | |
| 5 | 0.953 | Subbase | Sand | 11.00 | 2.105 | 23.16 | 4.07 | 80.02 | 1.0 | 2.647 | |||||
| 6 | 1.121 | Subgrade | Sand | 9.73 | 1.858 | 18.08 | 4.05 | 80.01 | 1.0 | 2.647 | 4.03 | 79.98 | 1.0 | 2.647 | |
| 7 | 1.276 | Subgrade | Sand | 6.16 | 1.858 | 11.45 | 4.03 | 80.00 | 1.0 | 2.647 | |||||
| 8 | 1.438 | Subgrade | Sand | 5.85 | 1.858 | 10.87 | 4.03 | 79.97 | 1.0 | 2.646 | |||||
| 9 | 1.740 | Subgrade | Sand | 6.99 | 1.858 | 12.99 | 4.03 | 79.96 | 1.0 | 2.646 | |||||
| 10 | 2.045 | Subgrade | Sand | 7.89 | 1.858 | 14.66 | 4.01 | 79.96 | 1.0 | 2.647 | |||||
| 533813 | 1 | 0.357 | Subbase | Sand | 12.20 | 1.885 | 23.00 | 4.03 | 80.12 | 1.0 | 2.735 | 4.05 | 80.12 | 1.0 | 2.734 |
| 2 | 0.505 | Subbase | Sand | 12.90 | 1.885 | 24.32 | 4.04 | 80.12 | 1.0 | 2.734 | |||||
| 3 | 0.660 | Subbase | Sand | 16.00 | 1.885 | 30.16 | 4.07 | 80.11 | 1.0 | 2.735 | |||||
| 4 | 0.810 | Subbase | Sand | 18.90 | 1.885 | 35.63 | 4.06 | 80.14 | 1.0 | 2.735 | |||||
| 5 | 0.962 | Subbase | Sand | 15.70 | 1.885 | 29.59 | 4.05 | 80.13 | 1.0 | 2.732 | |||||
| 6 | 1.116 | Subbase | Sand | 13.20 | 1.885 | 24.88 | 4.05 | 80.11 | 1.0 | 2.734 | |||||
| 7 | 1.255 | Subgrade | Sand | 14.90 | 1.821 | 27.13 | 4.07 | 80.12 | 1.0 | 2.717 | 4.08 | 80.13 | 1.0 | 2.717 | |
| 8 | 1.415 | Subgrade | Sand | 14.80 | 1.821 | 26.95 | 4.09 | 80.13 | 1.0 | 2.717 | |||||
| 9 | 1.721 | Subgrade | Sand | 13.20 | 1.821 | 24.04 | 4.10 | 80.13 | 1.0 | 2.715 | |||||
| 10 | 2.020 | Subgrade | Sand | 14.90 | 1.821 | 27.13 | 4.06 | 80.13 | 1.0 | 2.718 | |||||
As with all computational programs, a specific format of input data is required to process the TDR traces and compute the soil dry density and moisture content.
The program needs the following three input tables: MICROMOIST_SMP_TDR_AUTO for TDR trace reading, MICROMOIST_SMP_TDR_DEPTHS_LENGTH for TDR depth information, and MICROMOIST_SMP_TDR_CALIBRATE for calibrated soil data. The first two tables are available directly from the LTPP database while the third was developed as part of this study.
The program extracts the TDR trace point data from the MICROMOIST_SMP_TDR_AUTO table containing TDR sensor response waveforms. The measured waveform consists of 245 intervals and stored in the WAVP_1 through WAVP_245 fields. The distance interval between data points is recorded in the DIST_WAV_POINTS field and is either 0.01 or 0.02 m. This raw TDR trace data can be acquired from the LTPP database. Table 15 shows the field information included in the table. The table structure is required to match the SMP_TDR_AUTO table in the LTPP IMS database.
| Field Name | Description |
|---|---|
| SHRP_ID | Test section identification number |
| STATE_CODE | Numerical code for state or province |
| CONSTRUCTION_NO | Event number used to relate changes in pavement structure with other time dependent data elements |
| SMP_DATE | Measurement date |
| TDR_TIME | TDR measurement time (HHMM) |
| TDR_NO | ID number of TDR probe |
| DIST_WAV_POINTS | Distance between waveform points (meters) |
| WAVP_1 ~ 245 | 245 data points defining TDR waveform |
As shown in table 16, the MICROMOIST_SMP_TDR_DEPTHS_LENGTH table contains the physical characteristics of the TDR probes, including the installed depth below the pavement surface and probe length for each TDR probe at each site. The table links to the SMP_TDR_AUTO table using SHRP_ID, STATE_CODE, TDR_NO and CONSTRUCTION_NO to identify the depth of each TDR. This table is populated in the LTPP database. The table structure is required to match the SMP_TDR_DEPTHS_LENGTH table in the LTPP IMS database.
| Field Name | Description |
|---|---|
| SHRP_ID | Test section identification number assigned by LTPP |
| STATE_CODE | Numerical code for state or province |
| CONSTRUCTION_NO | Event number used to relate changes in pavement structure with other time dependent data elements |
| INSTALL_DATE | Instrumentation installation date |
| TDR_NO | ID number of TDR probe |
| TDR_DEPTH | Depth from pavement surface to TDR probe |
| TDR_PROBE_LENGTH | Actual length of TDR probe |
The data contained in the MICROMOIST_SMP_TDR_CALIBRATE table are the calibrated dielectric constants of the soil components and specific gravity. The calibration was accomplished using the micromechanics and self-consistent scheme and the SID approach previously described. The calibrated values are used to calculate moisture content by linking SMP_TDR_CALIBRATE by STATE_CODE, SHRP_ID and TDR_NO fields. The installation date, TDR depth, and layer and soil types are obtained from the SMP installation report. Information included in this table is shown in table 17.
| Field Name | Description |
|---|---|
| SHRP_ID | Test section identification number assigned by LTPP |
| STATE_CODE | Numerical code for state or province |
| INSTALL_DATE | Instrumentation installation date |
| TDR_NO | ID number of TDR probe |
| TDR_DEPTH | Depth from pavement surface to TDR probe at installation |
| LAYER_TYPE | Type of sublayer at TDR probe installation |
| SOIL_TYPE | Soil type of layer at TDR probe installation |
| DRY_DENSITY | Measured dry density of soil at installation (g/cm3) |
| VOLUMETRIC_MOISTURE_CONTENT | Measured volumetric moisture content of soil at installation |
| CONSTRUCTION_NO | Event number used to relate changes in pavement structure with other time dependent data elements |
| DIELECTRIC_SOILDS | Calibrated dielectric constant value of solid |
| DIELECTRIC_WATER | Dielectric constant value of water (= 1.0) |
| DIELECTRIC_AIR | Calibrated dielectric constant value of air |
| SPECIFIC_GRAVITY | Calibrated specific gravity of soil |
Two tables are generated upon running the program: MICROMOIST_SMP_TDR_AUTO_DIELECTRIC and MICROMOIST_SMP_TDR_ MOISTURE.
The dielectric constant, conductivity, and reflectivity parameters determined from the analysis of automated TDR traces are stored in the MICROMOIST_SMP_TDR_AUTO_DIELECTRIC table. The table structure is summarized in table 18. The dielectric constant values reported in this table are used to compute moisture content and dry density values.
| Field Name | Description |
|---|---|
| SHRP_ID | Test section identification number |
| STATE_CODE | Numerical code for state or province |
| CONSTRUCTION_NO | Event number used to relate changes in pavement structure with other time dependent data elements |
| SMP_DATE | Measurement date |
| TDR_TIME | TDR measurement time (HHMM) |
| TDR_NO | ID number of TDR probe |
| INFLEC_A | First inflection point in TDR trace (meters) |
| INFLEC_B | Second inflection point in TDR trace (meters) |
| SOIL_DIELECTRIC_CONSTANT | Computed dielectric constant of soil |
| SOIL_CONDUCTIVITY | Computed conductivity of soil |
| SOIL_REFLECTIVITY | Computed reflectivity of soil |
The MICROMOIST_SMP_TDR_MOISTURE table contains dry density, VMC, and gravimetric moisture content data computed from TDR traces. The dry density is used to convert moisture content from volumetric to gravimetric using equation 18. Table 19 shows the field name and descriptions in SMP_TDR_MOISTURE.
| Field Name | Description |
|---|---|
| SHRP_ID | Test section identification number |
| STATE_CODE | Numerical code for state or province |
| CONSTRUCTION_NO | Event number used to relate changes in pavement structure with other time dependent data elements |
| SMP_DATE | Measurement date |
| TDR_TIME | TDR measurement time (HHMM) |
| TDR_NO | ID number of TDR probe |
| TDR_DEPTH | Depth from pavement surface to TDR probe at installation |
| LAYER_TYPE | Type of sublayer at TDR probe installation |
| SOIL_TYPE | Soil type of layer at TDR probe installation |
| SOIL_DIELECTRIC_CONSTANT | Computed dielectric constant of soil |
| DRY_DENSITY | Computed dry density of soil |
| VOLUMETRIC_MOISTURE_CONTENT | Computed volumetric moisture content |
| GRAVIMETRIC_MOISTURE_CONTENT | Computed gravimetric moisture content |
| ERROR_COMMENT | Assigned error code |
The program was developed to produce quality data for the LTPP database. To this end, features were incorporated into the program to ensure quality. Additional measures were implemented for manual review, including a thorough program testing process during development. This will be described in the following chapter.
| < Previous | Contents | Next >> |

