U.S. Department of Transportation
Federal Highway Administration
1200 New Jersey Avenue, SE
Washington, DC 20590
202-366-4000
Federal Highway Administration Research and Technology
Coordinating, Developing, and Delivering Highway Transportation Innovations
| REPORT |
| This report is an archived publication and may contain dated technical, contact, and link information |
|
| Publication Number: FHWA-HRT-10-069 Date: September 2011 |
Publication Number: FHWA-HRT-10-069 Date: September 2011 |
Two bridge decks, one located in Lucas County, OH, and the other located in Arlington, VA, were monitored to evaluate the effectiveness of ECE on bridge decks. There are some similarities between the two structures. Both are small with low average daily traffic. As a result, it was not an insurmountable problem to close one lane of the bridges for several weeks while the decks were undergoing ECE treatment. However, the exposure conditions for the two structures vary, and different anode-electrolyte configurations were used in these two structures. Additionally, different technologies (i.e., thin epoxy overlay versus silica fume concrete overlay) were used on the structures after the application of ECE to prevent future ingress of chloride ions. The use of an epoxy overlay on the Ohio bridge deck prevented the performance of electrochemical tests such as half-cell potential survey and corrosion rate measurements.
Post-ECE evaluations for both bridges were performed soon after the completion of the treatment. No other evaluations were performed in the interim between the post-ECE evaluation and the start of this study in 1994. When available and appropriate, the post-evaluation data collected by other researchers were included in the analysis for comparison. All structure background information and ECE application information has been obtained from appropriate reports and bridge information provided by local bridge owners.
A two-lane bridge for SR-295 over Blue Creek near the intersection of SR-295 and Waterville-Neopolis Road in Lucas County, OH, was constructed in 1965 (see figure 27). The bridge is aligned in the north-south direction and is comprised of a continuously reinforced concrete deck supported by two piers. The 30-degree skewed deck is 72.98 ft (22.25 m) long and 35.98 ft (10.97 m) wide, carries two 12.99-ft (3.96-m)-wide traffic lanes, and has a 4.99-ft (1.52-m)-wide median on each side. The total surface area of the deck is 2,635.2 ft2 (244 m2).
A corrosion condition evaluation of the deck conducted in March 1991 documented a delaminated area of 148.81 inches2 (93,005.58 mm2).(1) The average chloride content varied from 5,820 ppm at a nominal depth of 0.55 inches (14 mm) to 860 ppm at a nominal depth of 2.54 inches (65 mm). Corrosion potential mapping identified 18 percent of the deck area to have a 90 percent probability of active corrosion. Corrosion rate measurements taken at four locations on the deck were in the high range (6.90 to 11.4 μA/inches2 (1.07 to 1.78 μA/cm2)), which are considered to result in concrete damage within 2 to 10 years.(1) Petrographic analysis determined that the deck concrete was of excellent quality considering materials, consolidation, air entrainment, water-cement ratio, and cement maturity.
In September 1991, an ECE treatment was applied to the eastern half of the bridge deck covering 1,317.6 ft2 (122 m2). The western half was not treated and was designated as a control.
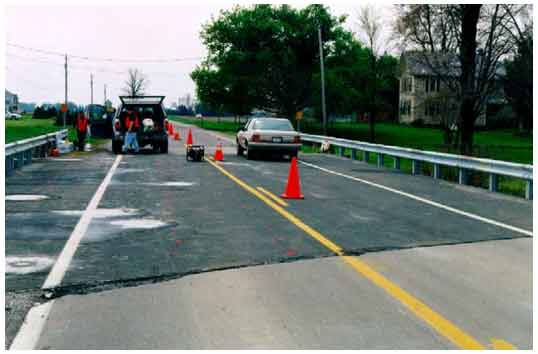
Figure 27. Photo. Deck surface of bridge carrying SR-295 over Blue Creek in Lucas County, OH.
For the application of ECE, a catalyzed titanium mesh was used as an anode, and 0.08 M sodium borate solution was used as an electrolyte. The electrolyte was confined to the treated areas in a pond built on the surface, and the anode was submerged in the electrolyte. At the beginning of the application, the solution in the pond was exposed to the environment. To insulate and maintain a slightly higher electrolyte temperature, a plastic cover was installed over the pond. The cover was also expected to protect the electrolyte from dilution by rain. Windy conditions at the site made it difficult to maintain the cover, and it was removed after several weeks. An adjustment of the pH of the electrolyte was made once during the application. The startup current density of 0.07 A/ft2 (0.7 A/m2) was slightly lower than expected, and it reduced to 0.03 A/ft2 (0.3 A/m2) over time (see table 2). The lower current densities were attributed to an increase in concrete resistance due to colder temperatures during application.
1 A/m2 = 0.093 A/ft2 |
The application was intended to accumulate a total charge of 93 A-h/ft2 (1,000 A-h/m2). Due to the difficulties encountered and the impending colder weather, the application was terminated when total charge accumulated exceeded 56 A-h/ft2 (600 A-h/m2). During summer 1992, a 0.25-inch (6.35-mm)-thick epoxy overlay was applied to the deck surface to prevent further ingress of chlorides into the concrete.
The following three field evaluations were performed in this study:
No damage was observed on the deck surface during the three evaluations. However, cracking, rust staining, and spalling were found during the third evaluation of the soffit of the bridge deck (see figure 28).
A complete delamination survey was conducted on the entire surface of the bridge deck during each evaluation, and no delaminations were detected. Additionally, a delamination survey was performed on assessable sections of the soffit adjacent to the abutments during the third evaluation. Delaminated area totaling 23.11 ft2 (2.14 m2) was detected on the soffit of the treated section of the deck and on 6.05 ft2 (0.56 m2) on the soffit of the control section of the deck (see figure 29).
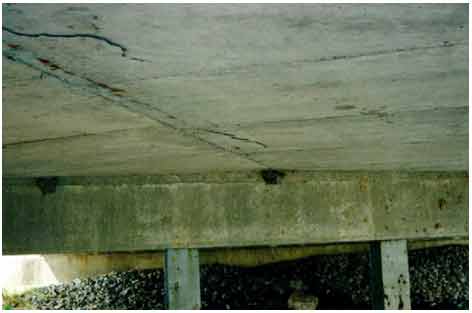
Figure 28. Photo. Cracking, rust staining, and spalling on the soffit of the bridge.
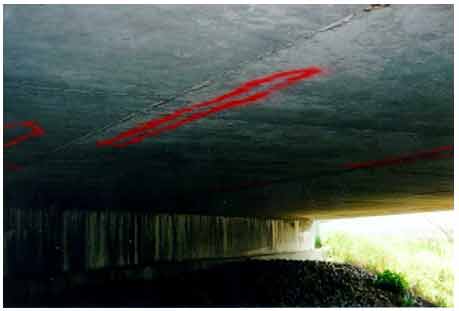
Figure 29. Photo. Delaminated areas (marked in red) on the soffit of the bridge.
A clear concrete cover survey was performed during the first evaluation using a cover meter. The results of the cover meter were verified with actual cover measurements obtained from cores extracted with embedded steel. The clear concrete cover ranged from 2.4 to 3.2 inches (61 to 81.3 mm) and averaged 2.7 inches (68.6 mm).
Prior to the application of ECE, one 3-inch (76.2-mm)-diameter core was collected and analyzed for chloride ion content at regular intervals of depth. After application of ECE, four cores were collected and similarly analyzed.(1) For the purpose of this report, chloride data collected by SHRP researchers after the application of ECE were post-treatment data.
During each of the first 2 evaluations, 11 3-inch (76.2-mm)-diameter cores were collected, 6 from treated areas and 5 from areas designated as control. During the third evaluation, 12 2-inch (50.8-mm)-diameter cores were collected, 6 from treated areas and 6 from the control areas. Powdered concrete samples were collected from all cores at regular intervals of depth and analyzed for chloride ion content.
As powdered concrete samples were not collected from the same nominal depths from each of the post-treatment cores, the chloride content data were extrapolated to fixed nominal depths to allow averaging of the results of the four cores. The average chloride profiles from pre- and post-treatment cores and cores from the three evaluations are presented in figure 30 and figure 31.
Figure 30 shows that the chloride content at the same depths after ECE was lower, and some diffusion of chloride ions may have occurred in the top 0.8 inches (20.3 mm) of the concrete. In general, the average chloride content profiles of the post-treatment cores and the cores collected in the three evaluations were similar.
In figure 31, the pre-treatment core and the cores collected from the untreated section of the bridge deck showed similar chloride content profiles, suggesting that some diffusion of chloride ions may have occurred in the top 0.8 inches (20.3 mm) of the concrete.
For approximately 7 years after the application of ECE, chloride content at steel depth has remained above the threshold for corrosion initiation by 260 ppm in the treated and the control areas. The chloride ion content at the steel depth in the control area was higher than that of the treated area.
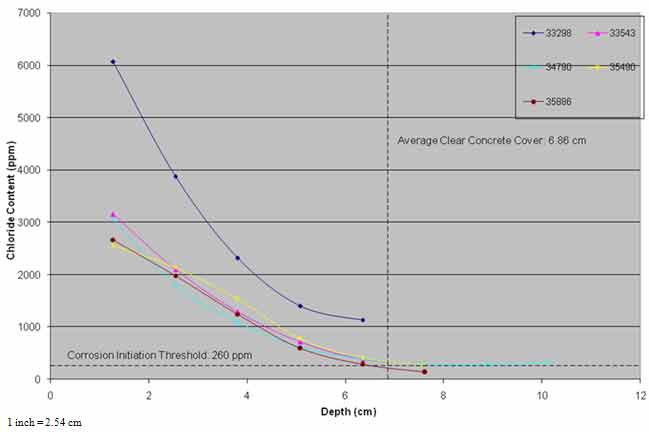
Figure 30. Graph. Chloride profiles of ECE treated area versus time.
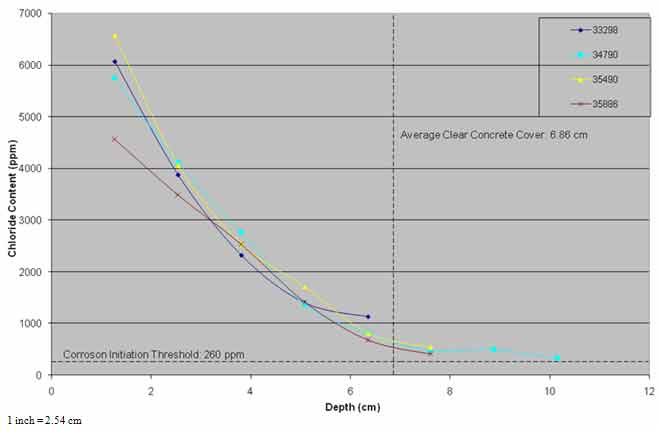
Figure 31. Graph. Chloride profiles of control area versus time.
The chloride ion content data indicate that the ECE process successfully removed a significant amount of chloride ions from the concrete above the top mat reinforcement and lowered the chloride ion content at the steel depth compared to the untreated control area.
The presence of the thin epoxy overlay had several impacts on the evaluation of this site. The overlay prevented electrochemical measurements such as half-cell potentials and corrosion rate measurements that could provide the information on the difference in the corrosion state of the two halves of the deck. It also made it difficult to detect delaminations under the overlay. The presence of the overlay impacted the ongoing corrosion process in the deck either by slowing it down or not allowing it to accelerate through keeping the needed moisture out of the concrete. Thus, it was not possible to determine the effectiveness of the ECE process in mitigating corrosion. Much longer term monitoring may show the difference between the control area and the treated section of the deck.
The treatment on this site can be compared to that of slabs 3 and 4 of the laboratory study. Slabs 3 and 4 had undergone 59.9 A-h/ft2 (645 A-h/m2) of ECE treatment compared to an average of 58.1 A-h/ft2 (625 A-h/m2) for this site. The anode used in both treatments was the same (inert anode coating on titanium substrate). Although the electrolytes that were used were different (0.1 M sodium hydroxide for slabs 3 and 4 and 0.08 M sodium borate for this site), the pH in both treatments were maintained in the alkaline range. Corrosion rate data collected after the application of ECE in the treated areas were higher than expected, but not as high as that of slabs 3 and 4. The chloride ion content at the top mat of reinforcement in the treated area of this site was much lower than that of slabs 3 and 4 (less than 400 ppm for the site and over 700 ppm for the slabs). Based on the performance of the slabs, the corrosion activity in the treated area can be expected to remain very low for more than 10.25 years after ECE treatment.
The 34th Street bridge in Arlington, VA, was constructed in 1968 to carry east- and westbound traffic over I-395. The 361.92-ft (110.34-m)-long and 57.99-ft (17.68-m)-wide deck consists of five simple spans supported by steel beams. It has a curb-to-curb width of 47.99 ft (14.63 m) and a deck surface area of 17,431.2 ft2 (1,614 m2). Although the bridge is wide enough to carry four lanes of traffic, it only carries one lane in each direction.
The Virginia Research Council and FHWA considered using the 34th Street bridge for a pilot application of ECE. The FHWA Demonstration Project #84 Team was requested to conduct a corrosion and concrete condition evaluation to ascertain the suitability of the bridge deck for ECE application. A thorough evaluation was performed in September 1993. Based on the results of the evaluation, the team recommended the application of ECE on the deck.(2)
Visual observation of the deck surface detected the presence of concrete scaling, corrosion-induced and shrinkage cracks, rust staining, and spalls with corroded reinforcing steel. The delamination survey documented damage varying from 2 to 29 percent of the deck surface area in the five spans. In general, spans 4 and 5 exhibited the least amount of corrosion-induced damage (5 and 2 percent delamination, respectively, and lower amounts of spalling and rust staining), and spans 1 and 3 exhibited the most corrosion-induced damage (22 and 29 percent delamination, respectively, and a larger amount of spalling and rust staining). Span 2 exhibited a relatively larger amount of rust staining but a lower amount of delamination (7 percent).
The average clear concrete cover varied from 0.75 to 1.8 inches (19 to 45 mm) and averaged 1.3 inches (33 mm). The average chloride content extrapolated to the average steel depth of 1.3 inches (33 mm) was 971 ppm. Corrosion potential mapping indicated that 78 percent of the deck had a low probability of corrosion activity, and 3 percent had a high probability of corrosion activity. The corrosion status of the remaining 19 percent was uncertain. In total, 48 corrosion rate measurements were made, with 68 percent of these measurements in the passive range and 32 percent in the low to moderate range.
Rehabilitation of the bridge deck was performed between March and September 1995. All unsound concrete was removed and patched with a cementitious material. Budgetary constraints did not allow application of ECE to the entire bridge, and the treatment was limited to spans 4 and 5, totaling 7,776 ft2 (720 m2) of deck surface area. Spans 1–3 were designated as controls. Although spans 4 and 5 had lower levels of corrosion-induced damage, the chloride content interpolated to the average steel depth of 1.3 inches (33 mm) was 649 and 929 ppm compared to 819, 654, and 912 ppm for spans 1–3, respectively. Also, chloride content at lower depths in spans 4 and 5 were generally higher than the other spans (see figure 32). The lower levels of damage on spans 4 and 5 made them more advantageous for ECE application.
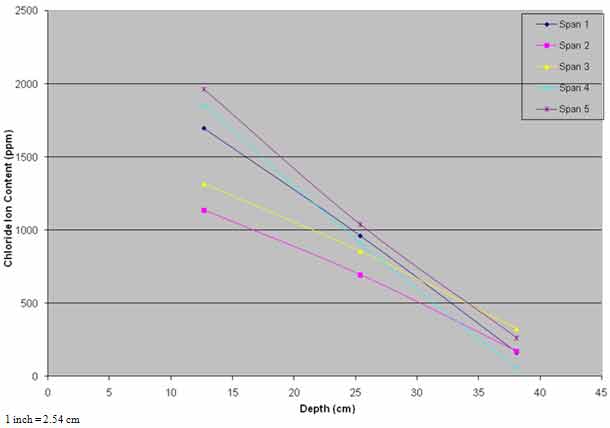
Figure 32. Graph. Pretreatment chloride profiles.
To maintain traffic flow over the structure, one lane was treated at a time.(3) The eastbound lane (northern half of the deck) was treated first (see figure 33). Several treatment areas were created, two on the north half of the bridge, one in each span, and two on the south half of the deck of each span. A catalyzed titanium mesh sandwiched between two layers of synthetic felt was used. The anode was placed in a wooden dam built to contain the electrolyte on the surface of the deck. A plastic sheet was used to cover and protect the anode and the electrolyte. Pumps and hoses were used to circulate the electrolyte. Three different electrolytes were used, including lithium borate on the northern half of span 4 and calcium hydroxide on the southern half of both spans. On the northern half of span 5, tetraphenol phosphonium chloride solution ((C6H5)4P+Cl-), which is a corrosion inhibitor, was applied on the deck surface prior to the placement of the anode system and lithium borate solution. Post-treatment analysis of powdered concrete samples collected from a depth of 0.75 to 1.25 inches (19 to 32 mm) indicated the presence of lithium borate in concentrations as high as 265 ppm and corrosion inhibitor in concentrations lower than the detectable limit of 25 ppm. Approximately 2 weeks after the ECE treatment, a 1.99-inch (51-mm)-thick silica fume overlay was placed on the entire deck.
The initial current densities for the treatment areas varied from 0.07 to 0.09 A/ft2 (0.7 to 0.9 A/m2), and the final current densities varied from 0.04 to 0.07 A/ft2 (0.4 to 0.7 A/m2). The total charge accumulated for each treatment area varied from 68.9 to 100.1 A-h/ft2 (741 to 1,077 A-h/m2), and chloride removal efficiency varied from 11.2 to 15.0 percent (see table 3).(4)
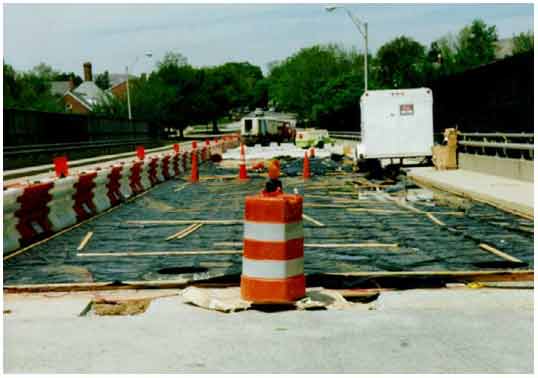
Figure 33. Photo. Northern half of the eastbound lane of 34th Street bridge in Arlington, VA, during ECE treatment.
1 m2 = 10.8 ft2 |
Two field evaluations were performed, and spans 3–5 were evaluated. The field evaluations were performed on the following dates:
No visually observable damage or delaminated areas were noted in any span during either of the evaluations.
During the first evaluation, 12 cores were collected for chloride content analysis, 2 from span 3 and 5 each from spans 4 and 5. In the second evaluation, 14 cores were collected, 6 from span 4 and 4 each from spans 3 and 5.
Span 3 suffered the most damage (29 percent delamination in 1993) and thus had the largest amount of repairs. Some of the cores (one from the first evaluation and the remaining from the second) collected from span 3 contained patch repair material. The chloride profile data for these cores was not representative of the actual chloride content of the original deck concrete. Data from cores containing patch material were excluded from the analysis.
Chloride profile data presented in figure 34 indicate that the chloride ion content in span 3 was similar to conditions before 1995, while chloride content in the treated areas was much lower and diffusion of chloride ions occurred over time. The average chloride ion content at the average steel depth of 1.29 inches (33 mm) was in excess of the threshold of 260 ppm required to initiate corrosion.
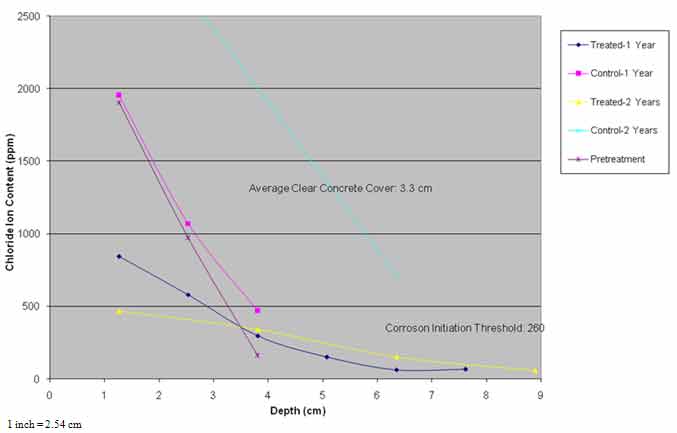
Figure 34. Graph. Chloride profiles versus time.
Half-cell potential data were collected on a 5-ft (1.53-m) grid in accordance with ASTM C-876-91, and the results from pre- and post-treatment evaluations are presented in figure 35.(5) This data show that after rehabilitation, the potential of the reinforcing steel shifted to the passive range. Shift in potential towards the passive range indicated a reduction in the propensity for corrosion. This was not only true for the ECE-treated areas but also the untreated deck of span 3.
Gecor 6 was used to measure the corrosion rate at 8–10 locations per span. Pretreatment average corrosion rate measurements and the two evaluation trip average corrosion rate measurements are presented table 4. With the exception of one average in the passive range (less than 0.6 μA/inches2 (0.1 μA/cm2)), all other averages were in the low range (0.6 to 3 μA/inches2 (0.1 to 0.5 μA/cm2)). In terms of corrosion rate measurements, there was no change from the pre-treatment status.
| Span | 1993 | 1996 | 1997 |
|---|---|---|---|
| Span 3 | 0.12 | 0.25 | 0.27 |
| Span 4 | 0.08 | 0.26 | 0.16 |
| Span 5 | 0.12 | 0.33 | 0.22 |
Sufficient length of time had not passed since the application of ECE to determine its effectiveness. The chloride ion distribution data suggest that a significant amount of chloride ions were removed from the concrete above the top mat reinforcement, and the chloride ions diffused over time. Long-term monitoring of this site is recommended to document its performance.
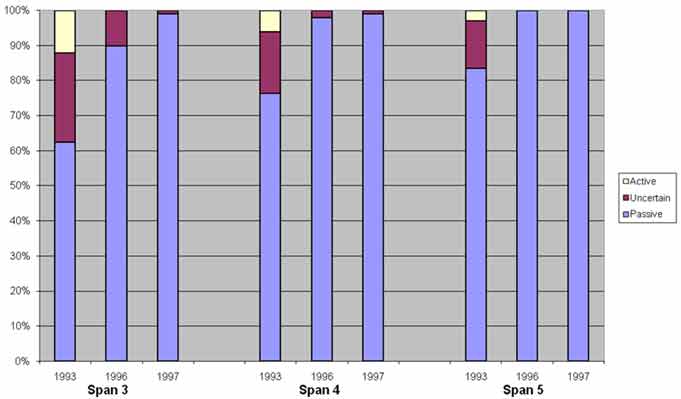
Figure 35. Graph. Half-cell potential distribution versus time.

