U.S. Department of Transportation
Federal Highway Administration
1200 New Jersey Avenue, SE
Washington, DC 20590
202-366-4000
Federal Highway Administration Research and Technology
Coordinating, Developing, and Delivering Highway Transportation Innovations
| REPORT |
| This report is an archived publication and may contain dated technical, contact, and link information |
|
| Publication Number: FHWA-HRT-13-089 Date: October 2013 |
Publication Number: FHWA-HRT-13-089 Date: October 2013 |
This manual and accompanying software program were developed to aid users in estimating traffic loading inputs for MEPDG applications for sites with insufficient site-specific traffic loading data.
This application is beneficial for developing MEPDG Level 2 or 3 traffic loading inputs for LTPP sites that have site-specific vehicle classification and/or truck volume data but no axle load information (or if the accuracy of the loading information is questionable owing to limited data availability or traffic monitoring equipment type). Traffic loading inputs are developed by selecting or computing NALS for each vehicle class and axle type based on available LTPP NALS defaults or site-specific NALS for SPS TPF WIM sites. Once default or surrogate NALS are established for a given LTPP site, the software develops a NALS input file for use with the DARWin-ME software (*.alf or *.xml file).
The LTPP PLUG database and software also can be used to develop MEPDG levels 2 and 3 traffic loading inputs and NALS defaults using agency-specific NALS (site-specific and/or defaults) or a combination of agency-specific data and LTPP-based loading defaults. The software includes a data import function for this purpose. The LTPP PLUG data dictionary is provided in appendix B to facilitate the integration of agency-specific axle load distributions and vehicle classification data.
This application is embedded in a Microsoft® Access database file and can run on any computer on which Access is installed. No LTPP PLUG software installation is required.
Start the application by opening the LTPP PLUG database file, LTPP_PLUG.mdb. Based on the user's computer and Microsoft® Access security settings, the user may need to ensure that macros/content is enabled in the application. This is accomplished by clicking the "Options…" frame located on the security warning ribbon and clicking the "Enable this content" radio button.
Microsoft® Access Reference Libraries
This application was developed using Microsoft® Access 2007. If the user is using this application with a different version of Access, references to some of the Microsoft® libraries used in this application could be lost, and these libraries will be marked as "Missing." In these circumstances, the user should add and activate the necessary reference libraries. To accomplish this task, open the VBA code window by pressing Alt+F11 and choosing "References" from the Tools menu. This will display the form showing all available reference libraries. The user should make sure that the three reference libraries shown with the checkmarks in figure 2 are available and selected.
 Pavement Loading User Guide (PLUG) database. The available reference libraries are displayed in a list box in the left side of the dialog box. The first three reference libraries are selected. They are “Visual Basic for Applications,” “Microsoft Access 12.0 Object Library,” and “Microsoft Forms 2.0 Object Library.” To the right of the list of references are up and down arrow key buttons to set the priority for the available library references. To the right of the arrow key buttons are four command buttons—OK, Cancel, Browse, and Help—listed from top to bottom. Below the list of references is a frame that shows the location of the selected library reference and the language.")
Figure 2. Screen capture. Selection of necessary library references
Select Actions from the Main Menu
When the user starts LTPP PLUG database application, the main menu, shown in figure 3, displays.
 Pavement Loading User Guide (PLUG) database. The form contains two frames. The top frame, entitled “Select action,” contains three radio buttons with the following labels. • ACTION #1: Import traffic summaries to LTPP PLUG database.
• ACTION #2: Select site-specific or default NALS for MEPDG use.
• ACTION #3: View, group, and combine NALS from multiple WIM sites.
The radio button that corresponds to Action #1 is selected by default.
The bottom frame contains the following descriptive text for the three actions listed in the top frame:
“ACTION #1: This option provides means for uploading LTPP or user supplied data to the following tables in LTPP PLUG database.
- DEFAULT_NALS—This table contains default NALS.
- SITE_SPECIFIC_NALS—This table contains representative site-specific NALS.
- DEFAULT_AxlesPerTruck—This table contains default axles per truck factors.
- SITE_SPECIFIC_AxlesPerTruck—This table contains representative site-specific axles per truck factors.
- SITE_SPECIFIC_NVCD—This table contains normalized site-specific vehicle class distributions (classes 4–13).
- PLUG_W_FACTORS_FOR_RPPIF—This table contains the W-factors for computation of the RPPIF statistic (MEPDG-based damaging potential).
See LTPP PLUG Manual for table formats.
ACTION #2: This option provides means for selecting site-specific or default NALS and development of MEPDG load distribution input files.
- Site-specific NALS—Representative site-specific NALS uploaded to the SITE_SPECIFIC_NALS table.
- Tier 1 default NALS—Global default NALS computed by averaging NALS for 26 LTPP SPS TPF sites.
- Tier 2 default NALS—Alternate default NALS that represent different loading conditions.
- User-defined NALS—NALS based on computations using user-selected site-specific NALS.
- Selection of Tier 2 NALS can be done using manual or computer assisted process.
ACTION #3: This option provides means for reviewing load spectra from multiple WIM sites and grouping of the sites based on similarities in loading characteristics or based on manual user selections. Grouped load spectra can be used to compute new NALS, such as NALS for user-defined TWRGs. These NALS can be added to the ‘SER_DEFINED_NALS’ table in the PLUG database and/or saved as DARWin-ME and/or NCHRP 1-37A MEPDG load distribution input files.”
At the bottom right of the main menu form are two command buttons—“About” and “Close.”")
Figure 3. Screen capture. Main menu for selecting different actions
This menu offers three action options:
ACTION #1 provides means for uploading LTPP or user-supplied data to the following tables in the LTPP PLUG database:
See appendix B for table formats.
ACTION #2 provides means for selecting site-specific or default NALS and development of MEPDG load distribution input files:
ACTION #3 provides means for reviewing load spectra from multiple WIM sites and grouping of the sites based on similarities in loading characteristics or based on manual user selections. Grouped load spectra can be used to compute new NALS, such as NALS for user-defined truck weight road groups (TWRG). These NALS can be added to the USER_DEFINED_NALS table in the PLUG database and/or saved as DARWin-ME and/or NCHRP 1-37A MEPDG load distribution input files.
To select ACTION #1, ACTION #2, or ACTION #3, click the radio button next to the desired action on the main menu and then click the "Select" button.
Import Traffic Summaries to LTPP PLUG Database
To import traffic summaries to the LTPP PLUG database, select ACTION #1 on the main menu and click the "Select" button (see figure 3). This action displays a data import form, shown in figure 4.
 Pavement Loading User Guide (PLUG) database. The form contains three. The top frame, entitled “Select traffic data source for upload,” has two radio buttons with the following labels. • Upload LTPP Traffic Data Summaries.
• Upload User Traffic Data Summaries.
The second frame, entitled “Select tables to upload,” contains six check boxes with the following labels.
• DEFAULT_NALS.
• SITE_SPECIFIC_NALS.
• DEFAULT_AxlesPerTruck.
• SITE_SPECIFIC_AxlesPerTruck.
• SITE_SPECIFIC_NVCD.
• PLUG_W_FACTORS_FOR_RPPIF.
The bottom frame contains the following descriptive text:
- “DEFAULT_NALS—This table contains default NALS based on user supplied or LTPP data.
- SITE_SPECIFIC_NALS—This table contains representative site-specific NALS based on user supplied or LTPP data.
- DEFAULT_AxlesPerTruck—This table contains default axles per truck factors based on user supplied or LTPP data.
- SITE_SPECIFIC_AxlesPerTruck—This table contains representative site-specific axles per truck factors based on user supplied or LTPP data.
- SITE_SPECIFIC_NVCD—This table contains normalized site-specific vehicle class distributions (classes 4–3).
- PLUG_W_FACTORS_FOR_RPPIF—This table contains damage factors for computation of the RPPIF statistic (MEPDG-based damaging potential). Users may supply their own damage factors.”
At the bottom right of the data import form are two command buttons—“Import” and “Close.”")
Figure 4. Screen capture. Data import form for importing traffic data summaries
The current version of the PLUG database requires user-supplied data in the Microsoft® Access database tables. The database table format is described in appendix B. A blank database with preset table formats is available for download along with the LTPP PLUG software application from the LTPP Customer Support Service Center (e-mail: LTPPinfo@dot.gov, telephone: (202) 493-3035, or fax: (202) 493-3161.).
To import data:
To close the form, click the "Close" button at the bottom of the screen.
Select NALS Source for MEPDG Use
To select the source of NALS for MEPDG use, select ACTION #2 on the main menu and click the "Select" button (see figure 3). This action displays the form shown in figure 5.
 source selection form of the Long-Term Pavement Performance (LTPP) Pavement Loading User Guide (PLUG) database. This form contains two main frames. The top frame, entitled “Select type of NALS,” has three radio buttons with the following labels. • OPTION #1: Site-Specific NALS.
• OPTION #2: Default NALS.
• OPTION #3: User-Defined NALS.
There is also a command button labeled “Select” at the bottom right corner of this frame.
When Option #2 is highlighted, a sub-frame to the right of the three radio buttons displays within the top frame. This sub-frame, entitled “Default Selection Method,” has two radio buttons with the following labels.
• Manual Selection.
• Assisted, Interactive Assignment.
The bottom frame contains the following descriptive text for the three actions listed in the top frame:
“Option #1: This option provides a graphical review and facilitates the development of MEPDG axle loading input files using NALS computed for LTPP SPS TPF sites or any other NALS uploaded in the SITE_SPECIFIC_NALS table of the LTPP PLUG database. This option is recommended if the pavement analyst has determined that identified site-specific NALS are the best for the specific pavement design or analysis needs (see the LTPP PLUG report for guidance).
Option #2: This option provides a graphical review and facilitates the development of MEPDG axle loading input files using the Tier 1 global or Tier 2 adefault NALS based on LTPP data or any other default NALS uploaded by the user to the DEFAULT_NALS table. Tier 1 NALS are recommended where no site-specific information is available regarding truck loading conditions at the site in question. It assigns a loading condition computed as the average of the 26 SPS TPF NALS. Tier 2 NALS allow the analyst to apply knowledge about traffic loading at the site in question. Tier 2 NALS also are recommended for setting up sensitivity analyses through the selection of NALS representing different loading conditions (e.g., light vs. heavy). If the Tier 2 option is selected, the analyst has two additional options: choosing all NALS manually or using the assisted interactive NALS assignment option that utilizes a decision tree algorithm for making NALS selections based on user responses.
Option #3: This option provides a graphical review and facilitates the development of MEPDG axle loading input files based on NALS included in the USER_DEFINED_NALS table, such as NALS representing different TWRGs. These NALS are the results of computations based on user-selected site-specific NALS.”
At the bottom right of the main menu form are two command buttons—“Back” and “Close.”")
Figure 5. Screen capture. Select NALS source form for selecting loading inputs for MEPDG use
The LTPP PLUG provides three types of NALS for development of MEPDG axle loading distribution inputs:
Option #1 provides a graphical review and facilitates development of MEPDG axle loading input files using NALS computed for LTPP SPS TPF sites or any other NALS uploaded to the SITE_SPECIFIC_NALS table of the LTPP PLUG database. This option is recommended if the pavement analyst has determined that identified site-specific NALS are the best for the specific pavement design or analysis needs (see the LTPP PLUG report for guidance).
Option #2 provides a graphical review and facilitates development of MEPDG axle loading input files using the Tier 1 global or Tier 2 default NALS based on LTPP data or any other default NALS uploaded by the user to the DEFAULT_NALS table. Tier 1 NALS are recommended where no site-specific information is available regarding truck loading conditions at the site in question. It assigns a loading condition computed as the average of the 26 SPS TPF NALS. Tier 2 NALS allow the user to apply knowledge about traffic loading at the site in question. Tier 2 NALS also are recommended for setting up sensitivity analyses through the selection of NALS representing different loading conditions (e.g., light versus heavy). If the Tier 2 option is selected, the user has two additional options: choosing all NALS manually or using the assisted interactive NALS assignment option that uses a decision tree algorithm to make NALS selections based on user responses.
Option #3 provides a graphical review and facilitates development of MEPDG axle loading input files based on NALS included in the USER_DEFINED_NALS table, such as NALS representing different TWRGs. These NALS are the results of computations based on user-selected site-specific NALS.
To select the desired the NALS option, click the appropriate radio button and then click the "Select" button.
Use the "Back" and "Close" buttons at the bottom of the screen to go back to the previous form or to close the form, respectively.
Select Site-Specific NALS for MEPDG Use
After selecting the site-specific NALS source from the options shown in figure 5, the user should click the "Select" button. This action displays the form shown in figure 6. This screen allows the user to view the NALS for each type of axle for each class of truck for a selected site (from the SITE_SPECIFIC_NALS table) to compare site-specific data with the defaults and to generate site-specific MEPDG axle load distribution files.
 input files for site-specific normalized axle load spectra (NALS). There are seven frames in the form. The left-most frame, entitled “Select state and site,” contains a drop-down box to select State and below that is a list box with site IDs for which NALS are available. To the right of this frame is another frame, entitled “Select class and axle,” that contains a table with three columns. The first column, entitled “Plot,” is a list of radio buttons assigned for each vehicle class-axle type. The next two columns, entitled “Class” and “Axle,” display all available vehicle classes (4–13) and axle types (1–4) for each vehicle class. Below these two frames is another frame entitled “Select file format for export.” It contains two check boxes labeled “ALF” and “XML” and a command button labeled “Generate” to the right of the two check boxes. Below this frame are two command buttons—“Back” and “Close.”
To the right of the “Select class and axle:” frame is another frame with the following instructions for plotting the NALS:
“INSTRUCTIONS:
Select a site from the list on the left side and then click on a radio button in the table on the left to select vehicle class and axle type for plotting.
- Use file export options in the lower left corner to create MEPDG load distribution files in *.ALF or *.XML format.
- Use options at the bottom of the form to compare selected spectra with Tier 1 or 2 defaults.”
Below this is an empty frame and toward the bottom of the form are two frames with disabled (grayed out) controls. The left frame contains the text “Select type of default to compare/view” followed by three radio buttons with the following labels:
• Tier 1 NALS—Global.
• Tier 2 NALS—Typical.
• None.
The bottom right frame contains a drop-down box to set the maximum x-axis value for the NALS plot.")
Figure 6. Screen capture. Review and generation of MEPDG input files for site-specific NALS
A list of the sites for which NALS are available is displayed on the left side of the screen. To select a site, click its site ID in the list. Use scroll bars to see all available sites. To filter sites for a specific State, select from the "Select State" drop-down box displayed above the list.
To the right of the site ID list is another list showing all available vehicle classes and axle types. Click a radio button in the "Plot" column to display a NALS plot for the corresponding vehicle class and axle type. One NALS may be selected/displayed at a time.
To generate a MEPDG NALS input file, select the desired file format (*.alf and/or *.xml) at the bottom of the screen and click the "Generate" button. The MEPDG NALS input file(s) is saved to a user-specified directory.
For the example shown in figure 7, Class 9 tandem axles have been selected for a non-LTPP site uploaded by the user to the SITE_SPECIFIC_NALS table. This NALS is displayed as a pink line. In addition, for comparison purposes, the user could display either Tier 1 default NALS (national average) or Tier 2 default NALS ("typical" default) for that type of axle and class of truck by selecting the appropriate radio buttons at the bottom of the form. The comparison NALS is displayed in blue. A text description of the NALS is provided in the box below the NALS plot.
. There are seven frames in the form. The left-most frame, entitled “Select state and site,” contains a drop-down box to select State, and below that is a list box with site IDs for which NALS are available. In this figure, “Test State” is selected in the drop-down box, and two sites, “99-xxxx” and “99-yyyy,” are displayed in the list box for site IDs. To the right of this frame is a frame entitled “Select class and axle” frame that contains a table with three columns. The first column, entitled “Plot,” is a list of radio buttons assigned for each vehicle class-axle type. The next two columns, entitled “Class” and “Axle,” display all available vehicle classes (4–13) and axle types (1–4) for each vehicle class. “Site 99-yyyy” is selected from the two sites. The radio button corresponding to “Class 9, tandem axle,” is also selected. Below these two frames is another frame entitled “Select file format for export.” It contains two check boxes labeled “ALF” and “XML” and a command button labeled “Generate.” Below this frame are two command buttons—“Back” and “Close.”
To the right of the “Select class and axle:” frame is another frame with the NALS plot for the selected site, vehicle class, and axle type. Below the NALS plot is another frame containing the following descriptive text for the NALS:
“This is a normalized Class 9 Tandem axle load spectrum for Site 99-yyyy.
STATISTICS: The distribution has 1.53% light axles (0–7,999 lbs), 64.92% moderately heavy axles (8,000–25,500 lbs), and 33.54% heavy axles (> 25,500 lbs), of which 1.18% are overloaded axles (> 34,000 lbs).
COMPARISON NALS: Tier 2 NALS—Typical. STATISTICS: The distribution has 1.38% light axles (0–7,999 lbs), 59.81% moderately heavy axles (8,000–25,500 lbs), and 38.81% heavy axles (> 25,500 lbs), of which 1.73% are overloaded axles (> 34,000 lbs). DESCRIPTION: This loading condition NALS has more loaded axles (30,000–34,000 lbs) than unloaded axles (12,000–16,000 lbs.). This is a balanced distribution with similar total %s of light and heavy loads. In this NALS, 55% of axles carry loads > 20,000 lb.”
At the bottom of the form are two more frames. The first frame, entitled “Select type of default to compare/view,” contains three radio buttons with the following labels:
• Tier 1 NALS—Global
• Tier 2 NALS—Typical
• None
In this case, “Tier 2 NALS—Typical” is selected.
The bottom right frame contains a drop-down box to set the maximum x-axis value for the NALS plot. In this case, “45999” is selected.")
Figure 7. Screen capture. Review of site-specific NALS
Select Default NALS for MEPDG Use - Manual Selection
If the Manual Selection option was selected (see figure 5), a screen displays like that shown in figure 8. This screen allows the user to select the default NALS for each type of axle for each class of truck. The same default type can be selected for all vehicle classes and axle types, or different defaults can be assigned to different vehicle classes and axle types.
 input files using default NALS. There are six frames in the form. The left-most frame contains a drop-down box to select default type and below that is a table entitled “Select default by class and axle:” with four columns. The first column, entitled “Plot,” is a list of radio buttons assigned for each vehicle class-axle type. The next two columns, entitled “Class” and “Axle,” display all available vehicle classes (4–13) and axle types (1–4) for each vehicle class. The last column, entitled “Default Name,” contains drop-down boxes with default names for each vehicle class and axle type. In this case, “Tier 2 (T)” is selected in the default type drop-down box. The radio button corresponding to “Class 9, tandem axle,” is also selected. Below these two frames is another frame entitled “Select file format for export.” It contains two check boxes labeled “ALF” and “XML” and a command button labeled “Generate.” Below this frame are two command buttons—“Back” and “Close.”
To the right of the “Select class and axle:” frame is another frame with the NALS plot for the selected site, vehicle class, and axle type. Below the NALS plot is another frame containing the following descriptive text for the NALS:
“This is a normalized Class 9 Tandem axle load spectrum for default—Tier 2—Heavy 1 (Typical)’.
STATISTICS: The distribution has 1.38% light axles (0–7,999 lbs), 59.81% moderately heavy axles (8,000–25,500 lbs), and 38.81% heavy axles (> 25,500 lbs), of which 1.73% are overloaded axles (> 34,000 lbs).
DESCRIPTION: This loading condition NALS has more loaded axles (30,000–34,000 lbs) than unloaded axles (12,000–16,000 lbs.). This is a balanced distribution with similar total %s of light and heavy loads. In this NALS, 55% of axles carry loads > 20,000 lb.
ROAD USAGE: Highways that serve a mix of urban delivery and long haul truck movements.
COMPARISON NALS: Tier 1 NALS—Global. STATISTICS: The distribution has 2.34% light axles (0–7,999 lbs), 57.62% moderately heavy axles (8,000–25,500 lbs), and 40.04% heavy axles (> 25,500 lbs), of which 3.11% are overloaded axles (> 34,000 lbs). DESCRIPTION: This default is computed based on averaging of NALS for all LTPP SPS TPF sites.”
At the bottom of the form are two more frames. The first frame, entitled “Select type of default to compare/view,” contains three radio buttons with the following labels:
• Tier 1 NALS—Global.
• Tier 2 NALS—Typical.
• None.
In this case, “Tier 1 NALS—Global” is selected.
The bottom right frame contains a drop-down box to set the maximum x-axis value for the NALS plot. In this case, “55999” is selected.")
Figure 8. Screen capture. Manual selection and generation of MEPDG input files using default NALS
To apply the same default selection to all vehicle classes and axle types, choose the desired default type from the "Select default type" drop-down box.
To apply a different default to a selected vehicle class and axle type, use the "Select default by class and axle" table shown on the left side of the screen. Identify the row with the desired vehicle class and axle type and use the drop-down box in the "Default Name" column to make a different default selection.
To view NALS for the selected vehicle class and axle type, click the radio button for the appropriate "Plot." (For example, in figure 8, Class 9 tandem axles have been selected.)
To compare the selected default with either Tier 1 or Tier 2 default NALS for that type of axle and class of truck, click the appropriate radio buttons at the bottom of the form. These two default options provide means for comparing the manually selected alternative NALS with the default NALS.
A text description of the NALS is provided in the box displayed below the NALS plot.
To generate a MEPDG NALS input file, select the desired file format (*.alf and/or *.xml) at the bottom left and click the "Generate" button. The MEPDG NALS input file(s) is saved to a user-specified directory.
To compare all of the available alternative Tier 2 default NALS against the Tier 1 national average defaults, click the drop-down list for the desired class of trucks and type of axle in the "Default Name" column. These manual selections must be made for each class of vehicles and type of axles. The intent of this selection process is to allow the user to apply known information about the site loading conditions to select the NALS alternative that best describes these conditions. The user should step through each class of trucks and type of axles, comparing the alternative Tier 2 NALS against the Tier 1 default.
For example, the user can compare the selected and default NALS to determine which is heavier. Figure 9 shows that the selected Tier 2 heavy (H2) NALS has a much higher percentage of heavy axles than the Tier 1 NALS. Thus, the Tier 2 heavy (H2) NALS for Class 7 tridem axles will cause the MEPDG software to predict more pavement damage than the Tier 1 global default.
. There are six frames in the form. The left-most frame contains a drop-down box to select default type, and below that is a table entitled “Select default by class and axle” with four columns. The first column, entitled “Plot,” is a list of radio buttons assigned for each vehicle class-axle type. The next two columns, entitled “Class” and “Axle,” display all available vehicle classes (4–13) and axle types (1–4) for each vehicle class. The last column, entitled “Default Name,” contains dro-down boxes with default names for each vehicle class and axle type. In this case, “Tier 2 (T)” is selected in the default type dro-down box. The radio button corresponding to Class 7, tridem axle is selected, and “VH2” is selected from the drop-down box that corresponds to Class 7 tridem in the “Default Name” column. Below these two frames is another frame entitled “Select file format for export.” It contains two check boxes labeled “ALF” and “XML” and a command button labeled “Generate.” Below this frame are two command buttons—“Back” and “Close.”
To the right of the “Select class and axle” frame is another frame with the NALS plot for the selected site, vehicle class, and axle type. Below the NALS plot is another frame containing the following descriptive text for the NALS:
“This is a normalized Class 7 Tridem axle load spectrum for default—‘Tier 1—Global NALS’.
STATISTICS: The distribution has 0.02% light axles (0–11,999 lbs), 4.48% moderately heavy axles (12,000–38,999 lbs), and 95.5% heavy axles (>= 39,000 lbs), of which 73.61% are overloaded axles (>= 51,000 lbs).
DESCRIPTION: This tridem NALS should be used where Class 7 tridems are primarily loaded well over the federal legal limit. The median axle weight for this NALS is roughly 54,000 pounds.
ROAD USAGE: Roads where tridem axles are heavily overloaded.
COMPARISON NALS: Tier 1 NALS—Global. STATISTICS: The distribution has 0.66% light axles (0–11,999 lbs), 33.52% moderately heavy axles (12,000–38,999 lbs), and 65.82% heavy axles (>= 39,000 lbs), of which 25.61% are overloaded axles (>= 51,000 lbs). DESCRIPTION: This default is computed based on averaging of NALS for all LTPP SPS TPF sites.”
At the bottom of the form are two more frames. The first frame, entitled “Select type of default to compare/view,” contains three radio buttons with the following labels:
• Tier 1 NALS—Global.
• Tier 2 NALS—Typical.
• None.
In this case, “Tier 1 NALS—Global” is selected.
The bottom right frame contains a drop-down box to set the maximum x-axis value for the NALS plot. In this case, “101999” is selected.")
Figure 9. Screen capture. Review of manually selected default NALS
Select Default NALS for MEPDG Use - Assisted, Interactive NALS Assignment
If the user chooses the Assisted, Interactive NALS Assignment option (see figure 5), the software displays a screen that looks like that shown in figure 10. At the top of this screen, the user should identify the LTPP test site for which the NALS selection will apply. This could be any LTPP site that has truck volume by class information or any other site with truck volume by class information added to the LTPP PLUG database table SITE_SPECIFIC_NVCD. The site ID is formed by using the numerical State Code ID and Strategic Highway Research Program (SHRP) ID, which together uniquely identify an LTPP site. The optional "State Filter" drop-down box at the top of the form allows the user to narrow the selection to a specific State. If no State name is selected, all sites available in the LTPP traffic database are displayed.
. There are four frames with controls in the form. Above these frames are two drop-down box controls with the labels “Select LTPP site for NALS default assignment” and “State filter (optional).” In this case, the first drop-down box has site “24-5807” selected, and the selected State is “Maryland” in the second drop-down box. Below these drop-down box controls is the first frame, entitled “Select type of traffic characteristic for determination of dominant vehicle class.” The frame contains a table with 12 columns. The first column, entitled “Select,” contains radio buttons that allow the user to select a row in the table. The second column, entitled “Vehicle Class,” describes columns 3 through 12, which show Vehicle Classes 4 through 14. The radio buttons in the first column allow the user to select a row in the table designated “% Volume by Class, % Total Load (ESAL), or “% Total Load (RPPIF).” In this case, the radio button “% Total Load (RPPIF)” is selected.
The following two notes appear below this table.
• Note 1: Class 5s should be excluded from determination of dominant heavy vehicle class by volume only.
• Note 2: If no dominant class is identified, select different traffic characteristic above.
The second frame appears below the first frame. The top-left part of the frame has the label “1st dominant vehicle class” followed by the class number, which, in this case, is Class 9. To the right of this is a sub-frame with the question “Are 50% or more of these trucks empty or almost empty?” followed by three radio buttons labeled “Yes,” “No,” and “Don’t know.” In this case, “No” is selected. Below the first dominant class label are three check boxes with the title “Select all that apply” and the following labels:
• High percentage of loads in the dominant class close to the Federal legal weight limit.
• High percentage of loads in the dominant class above the Federal legal weight limit due to permitted loads or illegal activity.
• None of the above.
In this case, the first checkbox is checked.
The third frame appears below the second frame. The top-left part of the frame has the label “2nd dominant vehicle class:” followed by the class number, which, in this case, is Class 4. To the right of this is a sub-frame with the question “Are 50% or more of these trucks empty or almost empty?” followed by three radio buttons labeled “Yes,” “No,” and “Don’t know.” In this case, “Don’t know” is selected. Below the first dominant class label is a drop-down box with the title “Select road use.” In this case, “Urban roads carrying heavily loaded transit buses and over the road coaches” is selected.
The fourth frame, which appears below the third frame, is entitled “Select any other truck classes that are likely to carry unusual loads.” There are 10 check boxes with the following labels from left to right—Class 4, Class 5, Class 6, Class 7, Class 8, Class 9, Class 10, Class 11, Class 12, and Class 13. All of the check boxes in this frame are unchecked.
The bottom-left portion of the frame has two command buttons labeled “Back” and “Next.”")
Figure 10. Screen capture. Assisted, interactive assignment of default NALS
For each of the identified dominant truck classes, the user is asked whether 50 percent or more of these trucks are empty or almost empty. If the user answers "Yes," then the load spectrum best describing this loading condition is selected from the list of available defaults. If the user answers "No," then a list of options with check boxes displays to help better define the expected loading condition. The following options are provided:
The first two options provide means to determine a likely shape of a heavy loading distribution that helps identify heavy NALS defaults. One or both of these options could be selected. If the user selects the "None of the above" option, a Tier 2 default "typical" distribution is used for the dominant vehicle class.
If the user has no knowledge of the loading condition and specifies the "Don't know" option on the form, a drop-down list displays to provide different road use options for the user to select. The number and type of entries in this list depends on the vehicle class. Each default has assigned road use recommendations in the LTPP PLUG database DEFAULT_NALS table. This list could be updated when new default NALS are added to the database or new road uses are identified for the LTPP Tier 2 NALS.
This input screen is designed to accommodate up to two dominant classes. If the user wishes to identify additional heavily loaded vehicle classes, this can be done by selecting those additional classes at the bottom of the screen.
When all questions have been answered and appropriate selections made on the form, click the "Next" button at the bottom of the screen. This displays a screen similar to the one shown in figure 8, except, unlike the manual selection of Tier 2 NALS, not all vehicle class and axle types are set to the "typical" (default) Tier 2 NALS conditions. Instead, the data entered for the dominant truck classes have been used to select specific Tier 2 NALS defaults. Also, vehicle classes and axle types that are likely to have a significant effect on pavement damage for the selected site will be colored black in the table displaying all available vehicle classes and axle types.
The user may now review and change any or all of the cluster assignments for each class of vehicle and type of axle. Thus, even if this NALS selection option is used, the user may still manually apply information previously learned about trucking patterns at the test site. This screen also may be used to select other NALS to test the sensitivity of MEPDG outputs to different loading conditions.
Select User-Defined NALS for MEPDG Use
This option facilitates the review of NALS computed using ACTION #3 (View, group, and combine NALS from multiple WIM sites) provided in the LTPP PLUG software. Once user-defined NALS have been added to the LTPP PLUG database by executing ACTION #3, these NALS can be viewed by selecting "user-defined" as the NALS source from the options shown in figure 5 and clicking the "Select" button on that form. Clicking the "Select" button displays the form shown in figure 11.
. There are six frames in the form. The left-most frame contains a drop-down box to select user-defined NALS. In this case, “CUSTOM” is selected. Below this frame is another frame entitled “Select vehicle class and axle to view plot” that contains a table entitled “Select default by class and axle:” with four columns. The first column, entitled “Plot,” is a list of radio buttons assigned for each vehicle class-axle type. The next two columns, entitled “Class” and “Axle,” display all available vehicle classes (4–13) and axle types (1–4) for each vehicle class. The last column, entitled “Default Name,” contains drop-down boxes with default names for each vehicle class and axle type. In this case, “CUSTOM” is selected for all drop-down boxes in the “Default Name” column except for the drop-down box that corresponds to Class 10 quad axle, for which “N/A” is selected. The radio button corresponding to Class 9, tandem axle, is also selected.
Below this table is another frame entitled “Select file format for export.” It contains two check boxes labeled “ALF” and “XML” and a command button labeled “Generate,” Below this frame are two command buttons—“Back” and “Close.”
To the right of the “Select class and axle:” frame is another frame with the NALS plot for the selected user-defined NALS, vehicle class, and axle type. Below the NALS plot is another frame containing the following descriptive text for the NALS:
This is a normalized Class 9 Tandem axle load spectrum for ‘Custom Description’.
STATISTICS: The distribution has 1.88% light axles (0–7,999 lbs), 56.05% moderately heavy axles (8,000–25,500 lbs), and 42.07% heavy axles (> 25,500 lbs), of which 1.45% are overloaded axles (> 34,000 lbs).
DESCRIPTION: Custom Description
ROAD USAGE: Custom road use
COMPARISON NALS: None
At the bottom of the form are two more frames. The first frame, entitled “Select type of default to compare/view,” contains three radio buttons with the following labels:
• Tier 1 NALS—Global.
• Tier 2 NALS—Typical.
• None.
In this case, “None” is selected.
The bottom right frame contains a drop-down box to set the maximum x-axis value for the NALS plot. In this case, “81999” is selected.")
Figure 11. Screen capture. Review of user-defined NALS
This screen allows the user to view the NALS for each type of axle for each class of truck for a user-defined NALS, such as NALS computed for TWRGs (from the LTPP PLUG USER_DEFINED_NALS table), to compare user-defined NALS with the defaults, and to generate site-specific MEPDG axle load distribution files. The same user-defined NALS type can be selected for all vehicle classes and axle types, or different user-defined NALS types can be assigned to different vehicle classes and axle types.
To apply the same user-defined NALS type to all vehicle classes and axle types, select the desired user-defined NALS type from the "Select user-defined NALS" drop-down box in the top left corner of the screen.
To apply a different user-defined NALS type to a selected vehicle class and axle type, use the table shown on the left side of the screen. Identify the row with the desired vehicle class and axle type and click the appropriate drop-down box in the "User-Defined" column.
To view user-defined NALS for the selected vehicle class and axle type, click the appropriate "Plot" button on the left of the screen.
To compare the selected user-defined NALS with either Tier 1 or Tier 2 default NALS for that type of axle and class of truck, select the appropriate radio button at the bottom of the form. These two default options provide means for comparing user-defined NALS to the default NALS.
A text description of the NALS is provided in the box displayed below the NALS plot.
To generate a MEPDG NALS input file, select the desired file format (*.alf and/or *.xml) and click the "Generate" button. The MEPDG NALS input file(s) is saved to a user-specified directory.
Generate MEPDG NALS Input Files
Functionality to generate the MEPDG NALS input file is provided for each "Select NALS for MEPDG Use" option. The button to generate MEPDG NALS input files is located at the bottom left corner of the "Review NALS and Generate Input Files" form presented in figure 9. MEPDG axle load spectra files are developed automatically by a software routine using two of the file formats supported by DARWin-ME: *.alf and *.xml. Files are saved to a user-specified directory. To execute this function, select the file format and click the "Generate" button. The NALS selection displayed in the table located above the "Generate" button will be used in the development of the MEPDG NALS input file.
View, Group, and Combine NALS from Multiple WIM Sites
To view, group, and combine NALS from multiple WIM sites, select ACTION #3 on the main menu and click the "Select" button (see figure 3). This action displays the data import form shown in figure 12.
 from multiple weight-in-motion (WIM) sites. There are six frames in the form. The left-most frame, entitled “Select state and site,” contains a drop-down box to select State and below that is a list box with site IDs for which NALS are available. In this figure, “Test state” is selected in the drop-down box and seven sites, “99-AAAA,” “99-BBBB,” “99-CCCC,” “99-DDDD,” “99 EEEE,” “99-FFFF,” and “99-GGGG,” are displayed in the list box for site IDs. To the right of this frame is a frame entitled “Select class and axle” that contains a table with three columns. The first column, entitled “Plot,” is a list of radio buttons assigned for each vehicle class-axle type. The next two columns, entitled “Class” and “Axle,” display all available vehicle classes (4 13) and axle types (1–4) for each vehicle class. All seven sites are selected, and the radio button corresponding to Class 9, tandem axle, is also selected. Below these two frames is another frame containing three command buttons “Record/compute NALS,” “Help,” and “Close.”
To the right of the “Select class and axle” frame is another frame with the NALS plot for the selected site, vehicle class, and axle type. The NALS plot has a total of seven series of bimodal distributions, one for each site selected. Each series has peaks corresponding to unloaded and loaded trucks. The NALS plot also has a black vertical line at 34,000 lb that represents the Federal legal limit for Class 9 vehicles.
Below the NALS plot is another frame containing two radio buttons used to select the method for grouping sites for selected vehicle class and axle type. The two radio buttons are labeled “% Heavy Axles” and “Damage Potential (RPPIF).” In this case, the latter is selected.
Below the radio button group in the same frame is a table with eight columns. It displays results based on the selections of sites and class and axle made in the first two frames described above. Columns are labeled with the various loading conditions from Very Light through Very Heavy 2. Below these are the respective relative pavement performance impact factors (RPPIF) for those conditions. In this case, the sites selected are displayed in the Heavy1, Heavy 2, and Very Heavy 1 columns. Note that the table includes the instructions: “To read description of a load spectrum, click on a site ID (select one site at a time).”
Below this table on the left is a command button labeled “Re-plot for highlighted sites” and to the right, a dro-down box to set the maximum x-axis value for the NALS plot. In this case, “51999” is selected.
At the bottom of the form is one more frame, entitled “Select type of default to compare/view,” containing three radio buttons with the following labels:
• Tier 1 NALS—Global.
• Tier 2 NALS—Typical.
• None.
In this case, “None” is selected.")
Figure 12. Screen capture. View, group, and combine NALS from multiple WIM sites
A list of the sites for which NALS are available is displayed on the left side of the screen. To filter sites for a specific State, select from the "Select State" drop-down box displayed above the site list. To select the sites for comparison and viewing of NALS, select the site IDs displayed in the list. Hold the Ctrl or Shift key to select multiple sites. Use scroll bars to see all available sites. Click the "Select" button under the site ID list to apply the selection.
To the right of the site ID list is a list of all available vehicle classes and axle types. Click a radio button in the "Plot" column to display a NALS plot for the corresponding vehicle class and axle type. One class and axle combination may be selected at a time.
If site selection has been changed, click the "Plot" button at the bottom of the table to refresh the plot for the selected class and axle.
The site IDs for the selected sites display in a table located under the axle load spectra plot. Site IDs display in different columns depending on the percentages of heavy axles or the damaging potential of the axle load spectrum. Use this information to group sites with similar loading conditions. To change the method for grouping load spectra, click the radio buttons displayed above the table to specify the statistical parameter used for grouping: "% of Heavy Loads" or "Damage Potential (RPPIF)."
Vehicle classes and axle types that are likely to have a significant effect on pavement damage for the selected site(s) are colored black; purple indicates that the selected class-axle combination is likely to have a significant effect for some but not all of the selected sites. This determination is made based on vehicle class distributions and axle load spectra for the selected sites.
In addition to site-specific load spectra, default load spectra can be displayed using the radio buttons at the bottom of the screen.
To narrow down site selection or plot only a few sites at a time, hold the Shift or Ctrl key to highlight site IDs in the table below the load spectra plot and click the "Re-plot for highlighted sites" button.
To record average NALS for sites displayed in the table below the load spectra plot, and to generate MEPDG load distribution files, click the "Record/Compute NALS" button at the bottom of the screen.
Compute and Record User-Defined NALS for Groups of Sites
This function facilitates development of user-defined NALS by vehicle class and axle type. This is accomplished by grouping sites with similar loading conditions, or based on manual selection of site IDs, and computing average NALS for each group of sites. Groupings are performed for the sites selected by the user on the "View, group, and combine NALS from multiple WIM sites" screen (see figure 12). Click the "Record/Compute NALS" button on that form to display a form containing the selected sites, as shown in figure 13.
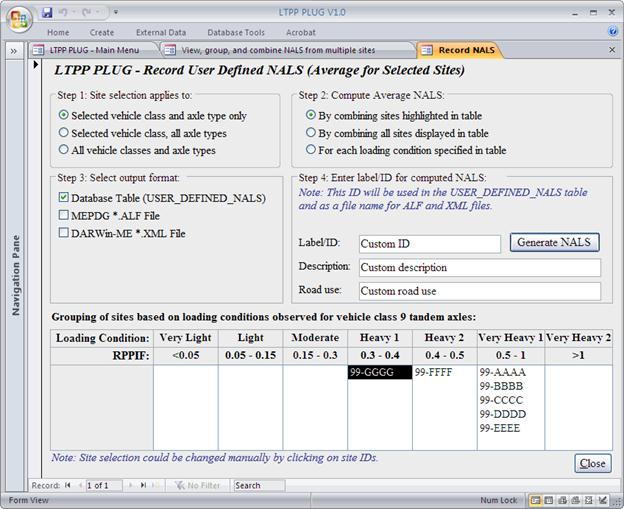
Figure 13. Screen capture. Compute and record user-defined NALS.
This form shows instructions for four steps and a table at the bottom of the form populated with the site IDs selected on the previous screen. The site IDs are placed in different columns of the table based on axle loading conditions observed for the selected vehicle class and axle type.
The LTPP PLUG provides multiple options for computation of average NALS for the selected group of sites. Step 1 on the form asks the user to select whether site selection for computation of average NALS should apply to:
It is recommended that the loading conditions observed for the dominant vehicle class are used as the basis for grouping of sites, at least to develop alternative NALS for that vehicle class. For the light vehicle classes and axle types that do not contribute much to the total loading, all sites may be combined to compute an average NALS. In some circumstances, where several heavy vehicle types are well represented on the road or loading conditions observed for different vehicle classes are different (for example, for a road with moderate Class 9 trucks and very heavy Class 7 trucks), it is recommended that NALS alternatives are computed based on grouping of sites for individual vehicle classes and axle types.
Step 2 offers the following options for grouping the sites for computation of the average NALS for each group:
To change the selection of sites for grouping, highlight the desired site IDs in the table by clicking them. Use Shift or Ctrl key to select multiple sites.
Step 3 asks the user to select the output format from the following options:
In step 4, the user is asked to provide several characteristics for the average NALS being computed based on user selection, including:
After steps 1 through 4 have been completed, click the "Generate NALS" button to compute and save the new user-defined NALS. If NALS have been written to the USER_DEFINED_NALS table of the LTPP PLUG database, use Option #3 of the "Select NALS Source for MEPDG Use" form (see figure 5) to view the computed NALS.
Click the "Close" button to close the form.

