U.S. Department of Transportation
Federal Highway Administration
1200 New Jersey Avenue, SE
Washington, DC 20590
202-366-4000
Federal Highway Administration Research and Technology
Coordinating, Developing, and Delivering Highway Transportation Innovations
 |
| This report is an archived publication and may contain dated technical, contact, and link information |
|
Publication Number: FHWA-RD-01-097 Date: January, 2002 |
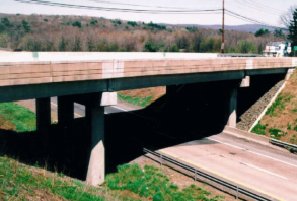
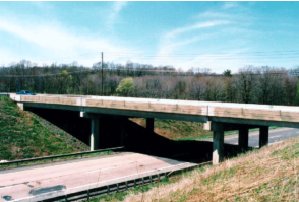
The Pennsylvania State Road (SR) 2042 bridge consists of two three-span structures and carries traffic in an east-west direction over the north and southbound lanes of I-81. The west bridge carries SR 2042 traffic over southbound I-81, and the east bridge carries SR 2042 traffic over northbound I-81. Each bridge is approximately 43 m long and 12 m wide, consisting of two 3.66-m-wide traffic lanes and two 2.44-m-wide breakdown lanes. Piers are numbered 1 through 4 from east to west. Piers 1 and 2 are on the east bridge, and piers 3 and 4 are on the west bridge. Figures 3-1 (a) and (b) show general views of the west bridge and the east bridge, respectively.
Piers 1, 2, and 3 were selected for SHRP C-103 field trial installation of shotcrete/corrosion- inhibitor repair systems. Areas of unsound concrete were delineated and removed to a depth of 19 millimeters (mm) below the reinforcing steel level with pneumatic hammers before repairs were begun. The exposed steel was sandblasted to near-white metal prior to application of the shotcrete and inhibitor treatment. In all patch repair areas, a wire mesh was tied to the reinforcing steel mat.
Pier 1 was used as the control. The repair cavities on this pier were backfilled with a standard shotcrete mix without any inhibitor treatment.
Pier 2 was repaired with shotcrete admixed with DCI inhibitor added at a rate of 1.9 liters (L) per bag of cement (approximately 4.99 L/m3 of concrete). In addition, four spray applications of Postrite (a 15-percent calcium-nitrite solution) were applied to the repair cavities with exposed steel prior to backfilling with inhibitor-treated shotcrete. The surface of the repair cavity for each application was sprayed until it was saturated. The second application was done approximately 2 hours after the initial application, the third 8 hours after the initial application, and the final application was done immediately prior to the application of the shotcrete.
Pier 3 was repaired with shotcrete treated with Cortec MCI 2000 inhibitor. The MCI 2000 admixture was added at a rate of 0.18 L per bag of cement (approximately 1.2 L/m3 of concrete).
All testing was limited to equal areas of 7.6 m2 on one face of each of the three pier caps. The east face was chosen for piers 1 and 2, and the west face was chosen for pier 3.
Figures 3-2 (a-c) show the test areas on piers 1, 2, and 3, respectively, while figure 3-2 (d) shows testing in progress utilizing a snooper.
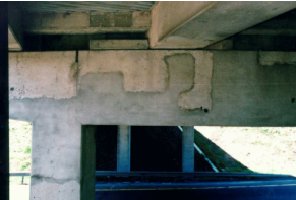
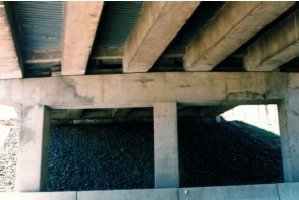
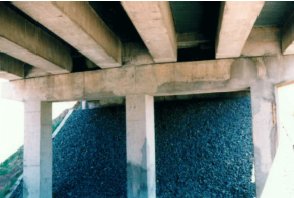
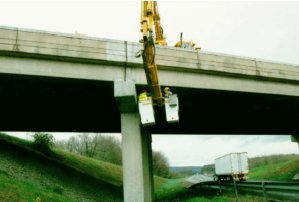
Figure 3-2. General views of piers: (a) pier 1, (b) pier 2, (c) pier 3, and (d) field evaluation in progress.
A total of three field evaluations were performed in this study on the following dates:
| First evaluation | November 16-18, 1994 | ~2 years after treatment |
| Second evaluation | May 5-6, 1997 | ~5 years after treatment |
| Third evaluation | September 29-30, 1998 | ~6 years after treatment |
Six types of information were gathered. These results are discussed below.
During the first visit, the concrete surface of the three pier caps did not have spalls. All patched areas on the three pier caps were cracked. Detailed mapping of the cracks was not performed. Cracks generally occurred along patch perimeters and the crack pattern within patched areas was typical of drying shrinkage cracking. Cracking was not observed in the original concrete areas. Visual observations of the three piers during the second visit did not show much change compared to the first evaluation. During the third visit, approximately 2.5 m of new cracks were documented in the patch areas of pier 3 (treated with Cortec 2000). These cracks did not appear to be caused by drying shrinkage. Outside the survey area of pier 3, corrosion products were visible in the original concrete. The shrinkage cracks on the other two piers remained the same. Spalls were not visible on any of the three pier caps.
During the first visit, hollow-sounding areas were detected in the patched areas and original concrete of pier 2 (treated with DCI Postrite). The hollow-sounding areas were 0.372 m2 and 0.093 m2 for the patched and original concrete, respectively. During the third visit, 0.093 m2 of hollow-sounding area in the original concrete was found on pier 1 (control). The hollow-sounding area in the original concrete on pier 2 remained the same. However, the hollow-sounding area in the patched section on pier 2 was found to be somewhat less than that documented during the first visit. This discrepancy resulted from a confusion of the grids marked on the surface of the test area. Drawings of the delaminations suggest that the delaminations increased with time. No hollow-sounding sections were identified on pier 3 (treated with Cortec 2000). Table 3-1 summarizes the delamination survey results.
Notes:
Survey section in each case is (1.07 x 7.41)m = 7.93 m2
Original = original concrete
Patch = patch concrete placed in October 1992
3.3.3. Clear Concrete Cover Survey
A clear concrete cover survey was performed during the first evaluation using a cover meter. Readings were taken in the patch concrete, at the interface, and in the original concrete. The results of the cover meter were verified at random locations, with actual cover measurements at drill holes. The results are shown in table 3-2. The average clear concrete cover for the middle pier was greater than for the south and the north piers.
3.3.4. Corrosion Potential Survey
Corrosion potential measurements were conducted according to ASTM C-876(4) during all three visits. Potential measurements were taken on a 0.61-m grid on patched (P) areas, interface (I), and original (O) concrete. However, the bulk of the measurements were for patched and original concrete. Summaries of corrosion potential measurements for the three visits are shown in tables 3-3 through 3-5. Guidelines for interpretation of corrosion potentials were discussed earlier.
Notes:
O = original concrete; I = interface of original and patch concrete
(0,0) coordinate is at the southern top corner of pier cap; x is measured in the northerly direction, and y measured in the southerly direction
O = original concrete; P = patch concrete
* millivolts measured against a copper-copper sulfate electrode
* millivolts measured against a copper-copper sulfate electrode
* millivolts measured against a copper-copper sulfate electrode
Corrosion rate tests were conducted on all three visits. An NBS-3LP (linear polarization) corrosion rate device was used and measurements were made at a total of 18 locations (6 measurements per pier). On each pier, two measurements were made in the original concrete, at patch areas, and at the interface of the original and patch concrete. The results are presented in table 3-6. Corrosion rate measurements made on the original concrete taken prior to the rehabilitation in October 1992 are also included. However, it should be mentioned that the locations for the 1992 corrosion rate measurements were not the same as for the 1994-1998 measurements. The corrosion rate measurements obtained in the patch areas were not accurate because: (1) no reinforcing steel layout information was available, and (2) the calculated corrosion rate values did not take into account the polarized area of the mesh. The relative difference in the data can be used to study the impact of inhibitors in mitigating corrosion.
1 mA/m2 = 10.753 mA/ft2
O = original concrete; P = patch concrete placed in 1992; I = interface of original and patch
It should be noted that the corrosion rates measured on the original concrete in October 1992, shortly after rehabilitation, were quite high. However, the locations were not the same as those used in the subsequent measurements from 1994 to 1998. Corrosion rates in patched areas had practically remained stable and were similar for all three piers, whereas at the patch/original concrete interface, corrosion rate data from pier 3 exhibited a significantly larger increase than that for the other two piers.
3.3.6. Chloride Ion Content Analysis
During the first visit in November 1994, powdered concrete samples were collected from the original concrete, patches, and interface areas from each of the three piers (a total of nine locations). At each location, 4 samples were collected at progressive increments of 13 mm down from the surface for a total of 36 samples. The chloride analyses data for the first visit are presented in table 3-7. Data collected prior to rehabilitation are also included in table 3-7. The three pier caps had high chloride contamination before rehabilitation. Chloride contents near the depth of the reinforcing steel were 6 to 13 times the corrosion threshold level (260 ppm). Two years after rehabilitation, chloride contents were very high at the interface areas, demonstrating that high chloride-contaminated concrete was left adjacent to patch areas. The patch concrete chloride content was low. The chloride content of pier 2 in the original concrete after 2 years was well above the corrosion threshold level.
Notes:
* Preconstruction data
O = original concrete; P = patch concrete placed in 1992; I = interface of original and patch concrete
(0,0) coordinate is at the southern top corner of pier cap; x measured in the northerly direction and y measured in the southerly direction
During the third visit, chloride samples were collected from nine locations adjacent to the locations used on the first visit. At each location, 4 samples were collected at progressive increments of 13 mm down from the surface for a total of 36 samples. The chloride analyses data for the third visit are presented in table 3-8.
All patches on the control pier and the treated piers were experiencing shrinkage cracking. By the third evaluation, additional cracks had developed in the patches treated with Cortec inhibitor. Rust staining that originated in a crack at the patch concrete interface of a patch treated with the Cortec inhibitor was noted in the third evaluation. Hollow-sounding areas were observed on the patch of the pier treated with DCI inhibitor and they increased with time.
The chloride ion content at the steel depth in the patches was below the threshold required to initiate corrosion.
Corrosion rate measurements in patched areas were not accurate, because the correct surface area of the steel subjected to the measurement could not be determined. But the trends in the corrosion rate measurements indicated that corrosion rates in the patched areas remained relatively constant with time in the control pier and the treated piers, and the rates for the treated patches and the control patches were similar. Corrosion rates at the interface were generally higher than those in the patches.
The signs of ongoing corrosion in the patches of the treated areas and at the interfaces suggest that the inhibitors were not providing any protection.
Notes:
O = original concrete; I = interface; P = patch

