U.S. Department of Transportation
Federal Highway Administration
1200 New Jersey Avenue, SE
Washington, DC 20590
202-366-4000
Federal Highway Administration Research and Technology
Coordinating, Developing, and Delivering Highway Transportation Innovations
 |
| This report is an archived publication and may contain dated technical, contact, and link information |
|
Publication Number: FHWA-RD-01-097 Date: January, 2002 |
The Hood Canal bridge, located west of Seattle, WA, is a primary link to the Olympic Peninsula. The 2397-m-long pontoon bridge carries Washington Route 104 traffic across the Hood Canal, which contains brackish tidal water. Due to the extreme depth of the natural canal, greater than 92 m at mid-channel, the structure was designed as a floating bridge that opens at the center to allow passage of ship traffic. The roadway is elevated above the pontoon decks. The bridge substructure, columns, and crossbeams are supported by the pontoons. Figures 4-1 (a) and (b) show general views of the Hood Canal bridge.
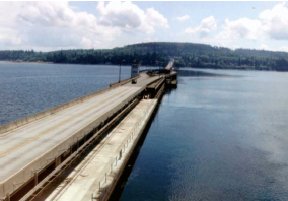
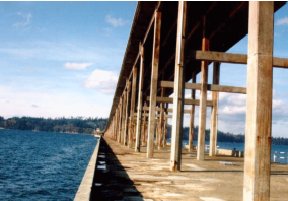
Figure 4-1. General views of the Hood Canal bridge.
The floating bridge was constructed in 1961. In 1979, the western half of the bridge sank in a storm and was subsequently replaced. Corrosion of the concrete reinforcing steel in the pontoon decks and substructure members is evident throughout the older eastern half of the floating bridge. Previous repairs to the eastern half of the bridge included patching of the pontoon decks, columns, and crossbeams, and the coating of these surfaces with epoxy. Even though the pontoon decks are about 1.5 m above high tide, they are constantly exposed to wind-blown brackish water mist, especially on the southern side of the decks. Water tends to pond on the deck surface. As a result, corrosion has continued unabated in the original and repaired concrete areas.
In July 1992, the three southern pontoon deck cells (1D, 2D, and 3D) of pontoon S on the eastern half of the bridge, each measuring 3.66 m by 9.14 m, were selected as a SHRP C-103 corrosion-inhibitor-treatment field-trial site. Delaminated areas on these cells were identified and delineated. Hollow-sounding areas in cells 1D, 2D, and 3D were found to be 8.9, 25.6, and 30.4 percent, respectively. Deteriorated concrete from the delaminated areas was removed to a depth of about 19 mm below the top reinforcing steel and the cavities backfilled with non-air-entrained cementitious patching material. The exposed reinforcing steel in all three cells was sandblasted to near-white metal on the day of patching. Immediately prior to the placement of the repair concrete, patch cavities were painted with a neat cement slurry. Cell 1D had no inhibitor treatment and was designated as the control. Corrosion inhibitor treatment was applied to the patches in cells 2D and 3D. Cell 1D had 11 patches, cell 2D had 13 patches, and cell 3D had 9 patches. The size of the patches ranged from 0.072 m2 to 2.6 m2. Figures 4-2 (a), (b), and (c) show partial views of the test locations.
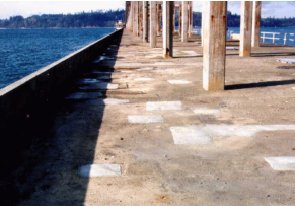
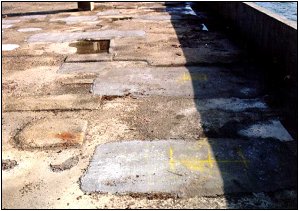
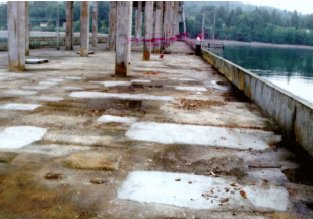
Figure 4-2. Partial views of test cells on the Hood Canal bridge: (a) cell 1D (control), (b) cell 2D (MCI 2020/2000), (c) cell 3D (Postrite/DCI).
Cortec MCI 2020/2000 was used as the corrosion-inhibitor system in cell 2D. Cell 3D was treated with the Postrite/DCI inhibitor system. Cortec 2020 was sprayed on the exposed reinforcing steel prior to the placement of the patch concrete, and Cortec 2000 was added to the patch concrete at a rate of 1.2 kg/m3. Care was taken during the spraying of Cortec 2020 to avoid contact with substrate concrete, because Cortec 2020 has been reported to cause a detrimental reduction in bond strength. For the 3D cell repairs, Postrite was sprayed on the exposed reinforcing steel and substrate concrete prior to the placement of the repair concrete, which contained DCI at a dosage rate of 39.94 L/m3.
Field evaluations were conducted under the FHWA contract and done on the following dates:
| First evaluation | November 5 and 6, 1994 | ~2 years after treatment |
| Second evaluation | June 25 and 26, 1996 | ~4 years after treatment |
A limited evaluation consisting of visual and delamination surveys was conducted under the SHRP program in October 1993. The observations from the 1993 survey are also included here.
The six types of results collected are presented below.
Visual inspections were performed in October 1993, November 1994, and June 1996, about 1.3 years, 2.4 years, and 4 years after the repairs were completed. During the October 1993 inspection, no cracking or spalling was observed in the control, Cortec, or Postrite/DCI cells. However, a 0.3-m-long crack was observed in patch # 2 in the Postrite/DCI cell during the November 1994 inspection. The crack appeared to be caused by drying shrinkage. No further cracks were documented during the 1996 evaluation.
Delamination surveys were conducted in October 1993 and November 1994. Due to inclement weather, the delamination survey could not be conducted during the 1996 evaluation. The results of the delamination survey are presented in table 4-1. Hollow-sounding areas were first detected 1.3 years after patching in the Cortec cell (cell 2D) and after 2.4 years in the control and Postrite/DCI cells (cells 1D and 3D, respectively). During the 1994 evaluation, hollow-sounding areas were detected in 2 of the 11 patches in cell 1D; 2 of the 13 patches in cell 2D; and 3 of the 9 patches in cell 3D. The corresponding delaminations were computed to be 2.2, 5.2, and 12.2 percent, respectively. The hollow-sounding areas in cell 2D increased in size between the first and second evaluations.
4.3.3. Clear Concrete Cover Survey
Table 4-2 presents the patch cover depths measured at about 3 days (July 1992) and 2.4 years (November 1994) after repair. The cover depths measured in July 1992 and November 1994 were in general agreement and showed that cover depths were shallow in all three cells. The average cover depths for cells 1D, 2D, and 3D were 3.35, 3.53, and 3.10 cm, respectively. The original concrete cover depths prior to repair were also shallow, with averages of 2.90, 2.87, and 3.10 cm for cells 1D, 2D, and 3D, respectively.
4.3.4. Corrosion Potential Survey
Potential measurements were made at the center of each patch in the respective cells. Table 4-3 presents a summary of the corrosion potential distribution in the three cells measured just prior to repair and about 1.3 years, 2.4 years, and 4 years after repair.
Corrosion potentials were mostly in the active range before the repairs were performed, but were less active with time after the repairs. However, as apparent from table 4-3, a significant percentage of the potentials remained in the active range for the inhibitor-treated patches as compared to the control patches.
* Pretreatment data
** millivolts measured against a copper-copper sulfate
electrode
The corrosion rate measurements were made with an NBS-3LP device at the center of selected patches; results are presented in table 4-4. The average corrosion rates in all three test cells had progressively increased from the pre-repair values.
Table 4-4. Corrosion rate measurements.
| Cell | Patch No. | Corrosion Rate, mA/m2 | |||
|---|---|---|---|---|---|
| July 1992 | Oct. 1993 | Nov. 1994 | June 1996 | ||
| 1 D (control) |
1 |
0.299 | 0.384 | 0.619 | |
| 2 | |||||
| 3 | |||||
| 4 | |||||
| 5 | 0.042 | 0.254 | 0.196 | 0.220 | |
| 6 | |||||
| 7 | |||||
| 8 | 0.265 | 0.183 | 0.279 | ||
| 9 | 0.149 | 0.323 | 0.310 | 0.465 | |
| 10 | |||||
| 11 | 0.320 | 0.521 | 0.955 | ||
| Average | 0.095 | 0.292 | 0.319 | 0.508 | |
| 2 D (Cortec MCI 2020/2000) |
1 |
|
|||
| 2 | |||||
| 3 | 0.379 | 0.369 | 0.248 | 0.333 | |
| 4 | |||||
| 5 | |||||
| 6 | 0.379 | 0.589 | 0.992 | ||
| 7 | |||||
| 8 | 0.410 | 0.777 | 0.718 | ||
| 9 | 0.246 | 0.356 | 0.540 | ||
| 10 | |||||
| 11 | 0.443 | 0.264 | 0.304 | 0.303 | |
| 12 | |||||
13 |
0.358 | ||||
| Average | 0.411 | 0.338 | 0.455 | 0.578 | |
| 3 D (Postrite/DCI) |
1 |
0.370 | 0.407 | 0.512 | |
| 2 | |||||
| 3 | 0.347 | 0.443 | 0.950 | 1.143 | |
| 4 | |||||
| 5 | 0.135 | 0.277 | 0.432 | 0.990 | |
| 6 | |||||
| 7 | 0.247 | 0.283 | 0.697 | 0.443 | |
| 8 | |||||
| 9 | 0.246 | 0.640 | 0.998 | ||
| Average | 0.243 | 0.324 | 0.625 | 0.817 | |
* Pretreatment data
1 mA/m2 = 10.753 mA/ft2
Corrosion rates were higher for the inhibitor-treated patches than for the control. The Postrite/DCI-treated patches had the highest average corrosion rates and the largest increase with time.
4.3.6. Chloride Ion Content Analysis
The chloride content of the test cells was not determined before the November 1994 field evaluation, and no chloride data were collected in 1996. Data collected in 1994 are presented in table 4-5. The rate of chloride ingress into the patched areas appeared to be fairly rapid. The chloride content near the steel depth in the patches, as well as in the original concrete, was greater than the minimum threshold value of 260 ppm required to initiate corrosion.
With the exception of one crack observed during the first evaluation in a patch treated with Cortec inhibitor, no other cracking was noted in the patches. Delaminations were first detected in patches treated by the Cortec inhibitor and, with time, delaminations were noted in the control patches and patches treated with the DCI inhibitor.
The chloride ion content at the steel depth in patches generally exceeded the threshold required to initiate corrosion.
Average corrosion rates in patches increased with time for the patches in the control area and the treated patches, and were higher in treated patches than in the control patches. Also, the increase in corrosion rate with time in the treated patches was higher than that for the control patches.
Clear evidence of ongoing corrosion in inhibitor-treated patches indicated that the inhibitors were not providing any protection.
* Original concrete

