U.S. Department of Transportation
Federal Highway Administration
1200 New Jersey Avenue, SE
Washington, DC 20590
202-366-4000
Federal Highway Administration Research and Technology
Coordinating, Developing, and Delivering Highway Transportation Innovations
 |
| This report is an archived publication and may contain dated technical, contact, and link information |
|
Publication Number: FHWA-RD-01-097 Date: January, 2002 |
The TH-3 bridge over Southview Boulevard is located in south St. Paul, MN. TH-3 (recently renamed TH-52) is a main northbound arterial carrying southern traffic into St. Paul. The bridge was built in 1973 and is approximately 50 m long and 14 m wide, with one breakdown lane and two traffic lanes. The breakdown and right traffic lanes are approximately 3.35 m and 3.65 m wide, respectively. There is also a 0.92-m-wide shoulder adjoining the left traffic lane. Spans 1, 2, and 3 are 13.5 m, 23.0 m, and 12.5 m long, respectively. The deck, parapets, and substructure are cast-in-place reinforced concrete. The superstructure consists of precast, prestressed I-beams. Figures 5-1 (a) and (b) show general views of the structure and deck, respectively.
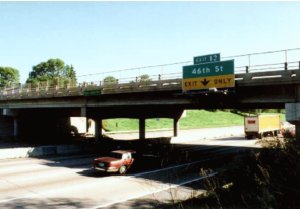
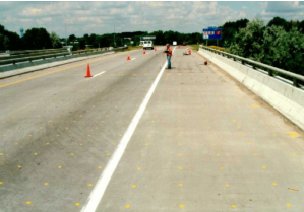
Figure 5-1. TH-3 over the Southview Boulevard bridge: (a) structure and (b) deck.
The deck was rehabilitated and overlaid with a 5.08-cm Low-Slump Dense Concrete (LSDC) mix in May-June 1992. About 3.81 cm of the original chloride-contaminated concrete was milled off to the top layer of reinforcing steel and unsound areas were removed with a pneumatic hammer. The entire deck surface was sandblasted to remove laitances prior to placement of the overlay.
Two corrosion-inhibitor treatment methods were used in rehabilitation of the deck. Cortec MCI 2000 (an organic amine) was used in span 1 and was added to the overlay concrete at a rate of 1.2 L/m3. Span 2 was treated with DCI (calcium nitrite), which was added to the overlay concrete at a rate of 19.96 L/m3. In addition, span 2 received three spray-on applications of Postrite (a 15-percent solution of calcium nitrite) prior to the placement of the DCI-treated overlay. The application rate for Postrite was about 3.75 L/m3. Span 3 was designated as the control span and was overlaid with standard Minnesota Department of Transportation (MNDOT) LSDC mix.
Field evaluations were performed on the following dates:
| First evaluation | October 5-7, 1994 | ~2.4 years after treatment |
| Second evaluation | August 1-2, 1996 | ~4.3 years after treatment |
| Third evaluation | May 12-13, 1998 | ~6.0 years after treatment |
Some data collected in May 1992 (prior to the rehabilitation) and in May 1994 (about 2 years after the inhibitor treatment) are also included in this report for comparison.
The results of six types of data collection are presented below.
The visual survey results (crack-length measurements) for all three evaluations are presented in table 5-1.
During the first evaluation, the concrete surface of the right traffic and breakdown lanes appeared to be sound. However, some longitudinal cracking was observed on the deck surface. Span 1 (Cortec 2000 treatment) exhibited larger cracks than span 2 (Postrite/DCI treatment) and span 3 (control). The crack frequencies for spans 1, 2, and 3 were 0.265 m/m2, 0.004 m/m2, and 0.053 m/m2, respectively. All the cracks appeared to be caused by drying shrinkage. It should be mentioned that no cracking was observed in August 1992, about 3 months after placement of the overlay. Crack surveys were not performed between August 1992 and October 1994.
During the second evaluation, a visual survey of the right traffic lanes and the breakdown lanes was performed. Crack lengths in the right traffic lane were found to increase significantly since the first evaluation in October 1994. The DCI-treated span (span 2) exhibited significantly less cracking than the other two spans. Crack frequencies for the right lane of spans 1, 2, and 3 were 0.309 m/m2, 0.018 m/m2, and 0.280 m/m2, respectively. Crack frequencies for the breakdown lane of spans 1, 2, and 3 were 0.034 m/m2, 0.020 m/m2, and 0.051 m/m2, respectively.
During the third evaluation, the right traffic and breakdown lanes were found to be in good condition, with the exception of small areas that showed light scaling. A significant increase in crack length was evident in the breakdown lane of span 1 and span 3. Overall, the DCI- treated span exhibited less cracking than the other two spans, though there was an increase in the crack frequency when compared to the second evaluation. Crack frequencies for the right traffic lane were 0.309 m/m2, 0.069 m/m2, and 0.280 m/m2 for spans 1, 2, and 3, respectively, and for the breakdown lane of spans 1, 2, and 3 were 0.131 m/m2, 0.024 m/m2, and 0.211 m/m2, respectively.
No hollow-sounding areas were detected during any of the three evaluations.
5.3.3. Clear Concrete Cover Survey
The concrete cover depth survey results are shown in table 5-2. The mean cover depths for the Cortec (span 1), Postrite/DCI (span 2), and control (span 3) locations were 7.16, 6.50, and 7.95 cm, respectively. The variability of cover depths was the least for the Postrite/DCI span, with a coefficient of variation (CV) of 5.8 percent, and the greatest for the control span with a CV of 14.0 percent. The control span cover depth variability was considered to be typical.
CV = Coefficient of variation
5.3.4. Corrosion Potential Survey
Corrosion potential measurements were conducted on a 0.61-m grid following ASTM C-876 during all three evaluations; the summary results are shown in table 5-3.
* = Pretreatment data
** = Total number of measurements
*** millivolts measured against a copper-copper sulfate electrode
The corrosion potential data interpretation guidelines have been discussed previously. It can be seen from Table 5-3 that the corrosion potentials were mostly in the passive range before the rehabilitation. About 2 years after the rehabilitation (first evaluation), the corrosion potential distribution was approximately the same. During the second evaluation, a shift was noticed in the corrosion potential distribution toward the uncertain range for all three spans; however, no active potentials were encountered. During the third evaluation, some active potentials were found that amounted to 1 percent, 4 percent, and 3 percent for spans 1, 2, and 3, respectively. Overall, the corrosion activity on this structure can be categorized as low.
Corrosion rate tests were conducted during all three evaluations with an NBS-3LP corrosion rate device and measurements were made at 32 locations (8 in span 1, 16 in span 2, and 8 in span 3). The results are shown in table 5-4 which also includes some data obtained in May 1992 before rehabilitation. The guidelines for interpreting corrosion rate data obtained with the 3LP device were discussed in an earlier section of this report.
The average corrosion rate in all three spans before rehabilitation was quite high (in the range of 5.70 to 7.27 A/cm2). The rates decreased significantly after about 2 years, as reflected by the data collected during the first evaluation in October 1994. However, there was no significant difference in the corrosion rates in the inhibitor-treated and untreated spans. Most corrosion rate measurements obtained for spans 1 and 2 during the second evaluation were comparable to measurements obtained during the first evaluation. The corrosion rate measurements obtained for span 3 were suspect, probably due to a measurement error; thus, they are not reported here. Data obtained during the third evaluation showed an increase in the average rates for span 3 (control), while the average rates for spans 1 and 2 remained about the same.
The corrosion rate measurements may be considered as moderately high as per the interpretation guidelines. However, they were not consistent with the largely passive corrosion potentials measured on the deck surface and the low levels of chloride measured at the depth of the reinforcing steel (see section below).
5.3.6. Chloride Ion Content Analysis
Powdered concrete samples were collected with a hammer drill from 15 different locations (5 on each span) during the first evalutation. At four locations on each span, sampling was at the approximate average steel depth, while at one location in each case, samples were collected at nominal 1.27-cm increments down to the average steel depth. The powdered samples were analyzed for total chloride ion content using the standard AASHTO T-260 procedure. The results are shown in table 5-5. As mentioned earlier, the average cover depths for the Cortec (span 1), DCI (span 2), and control (span 3) locations were 7.16, 6.50, and 7.95 cm, respectively.
Notes:
1 mA/m2 = 10.753 mA/ft2
(0,0) coordinate is at the southeast corner of the structure; x is measured in a westerly direction and y is measured in a northerly direction
Note:
The average chloride content at the average steel depth prior to rehabilitation was below the threshold level of 260 ppm.
The average steel depths for spans 1 and 3 were approximately 7.62 cm; span 2 was approximately 6.35 cm. Total chloride ion content at the average steel depth in span 1 (except for one location) was below the minimum threshold value of the 260 ppm required to initiate corrosion of steel embedded in concrete. A similar situation was evidenced in span 2. In span 3 (control), the chloride ion content was much below the threshold value. Limited chloride analysis was also carried out during the third evaluation and showed the same trends. The results are not reported here.
The chloride content at the average steel depth in the right traffic lane before rehabilitation of the bridge deck in May-June 1992 was below the minimum threshold value of 260 ppm for all three spans.
Cracking of the overlay was prevalent in all spans and increased with time. The span treated with the Cortec inhibitor exhibited the highest crack density, followed by the control, and the DCI-treated span exhibited the least amount of cracking. No delaminations were detected in any evaluations.
The average corrosion rates were in a range that could result in damage in 2 to 10 years and any corrosion would increase with time. The average corrosion rates in the inhibitor-treated spans were higher than the control span. The corrosion rates were probably exaggerated due to deep cover over the reinforcing steel.
The chloride ion content at the steel depth prior to the installation of the repairs was below the threshold and the corrosivity of the environment was mild. It was difficult to judge the performance of the inhibitors at this site.
Based on the findings of the long-term evaluations, the following conclusions were reached:
In three out of the four structures evaluated in this study, the control areas and the treated areas experienced shrinkage cracking.
Signs of ongoing corrosion in patched areas treated with corrosion inhibitors were noted in three out of the four structures.
The corrosion inhibitors did not provide any protection against corrosion in the environments in which they were evaluated.

