U.S. Department of Transportation
Federal Highway Administration
1200 New Jersey Avenue, SE
Washington, DC 20590
202-366-4000
Federal Highway Administration Research and Technology
Coordinating, Developing, and Delivering Highway Transportation Innovations
 |
| This report is an archived publication and may contain dated technical, contact, and link information |
|
Publication Number: FHWA-RD-02-088 Date: May 2003 |
Previous | Table of Contents | Next
This chapter presents the results of the analysis of LTE calculated from the LTPP FWD data using the procedure described in chapter 3. This analysis included:
The LTTP database contains FWD deflection data for PCC pavement sections throughout the United States and Canada. These sections vary in age, design features, and site conditions. Therefore, it is not a surprise that the resulting LTEs vary from very low (less than 20 percent) to very high (close to or greater than 100 percent). Figures 8 and 9 present cumulative frequency curves for mean LTE for joints in the LTPP JCP and cracks in the LTPP CRCP, respectively. These frequency curves are based on the results of the analysis of mean values of LTE for individual cracks and joints performed for the same FWD pass from multiple drops and FWD load levels. In the LTPP FWD load-testing program, the FWD loads are applied at both sides of the joints, so the resulting LTEs were grouped by load plate positions.
Comparison of figures 8 and 9 shows that the LTEs of joints in JCP vary over a much wider range than do the LTEs of cracks in CRCP. Approximately 10 percent of joints exhibited LTE of less than 50 percent, whereas the vast majority of cracks had LTE greater than 85 percent. Also, in more than 60 percent of cases, CRCP cracks exhibited LTE greater than 90 percent, whereas less than 40 percent of JCP joints had the same level of LTE. Steel reinforcement in a properly designed CRCP keeps cracks tight, which provides a high level of LTE.
One can observe that a small fraction of joints and cracks exhibited LTE greater than 100 percent. Although it is possible that high LTEs might be results from measurement errors, it is also possible that the ratios of deflections from the unloaded and loaded slabs measured 152 mm (6 inches) away from the joint can exceed 100 percent. To investigate this phenomenon, an ISLAB2000 finite element model with the following parameters was developed:
Three cases of temperature loading and four void sizes (a total of nine cases) were considered. The difference between the temperatures of the top and the bottom surfaces was equal to -13, 0, or 13 oC (8.6, 32, or 55 oF). The void length in the longitudinal direction was equal to 0 [no void], 0.76, 1.52, and 2.29 m (0, 30, 60, 90 inches). The void width was assumed to be equal to the PCC slab width for all cases.
For each combination of void size and temperature differential, deflections were calculated using ISLAB2000 for FWD loads of 50.0 and 0 [no FWD load] kN. Table 4 presents the differences between these deflections for four locations at the slab centerline:
Table 4 also presents calculated true and measured LTEs determined as ratios of deflections from unloaded and loaded slabs calculated at the joint and 152 mm (6 inches) from the joint, respectively.
Table 4. Deflections from ISLAB2000 near joints.
|
Void length (m (inches)) |
Temperature Difference (oC (oF)) |
Deflections at Different Distances from the Joint (mm (inches)) |
LTE |
||||
|---|---|---|---|---|---|---|---|
|
Loaded Slab |
Unloaded Slab |
||||||
|
152 mm (6 inches) |
0 mm (0 inches) |
0 mm (0 inches) |
152 mm (6 inches) |
True % |
Computed % |
||
|
0 (0) |
-13 (8.6) |
0.562940 |
0.618033 |
0.618033 |
0.549885 |
100.0 |
97.7 |
|
0 (0) |
0 (32) |
0.243180 |
0.266040 |
0.266040 |
0.230429 |
100.0 |
94.8 |
|
0 (0) |
13 (55) |
0.306476 |
0.325552 |
0.325552 |
0.290093 |
100.0 |
94.7 |
|
0.76 (30) |
-13 (8.6) |
0.639851 |
0.705231 |
0.705231 |
0.633959 |
100.0 |
99.1 |
|
0.76 (30) |
0 (32) |
0.338836 |
0.375437 |
0.375437 |
0.333477 |
100.0 |
98.4 |
|
0.76 (30) |
13 (55) |
0.401396 |
0.437515 |
0.437515 |
0.397256 |
100.0 |
99.0 |
|
1.52 (60) |
-13 (8.6) |
0.657174 |
0.728802 |
0.728802 |
0.669798 |
100.0 |
101.9 |
|
1.52 (60) |
0 (32) |
0.379501 |
0.421945 |
0.421945 |
0.383413 |
100.0 |
101.0 |
|
1.52 (60) |
13 (55) |
0.433349 |
0.474777 |
0.474777 |
0.438937 |
100.0 |
101.3 |
|
2.29 (90) |
-13 (8.6) |
0.545617 |
0.607289 |
0.607289 |
0.566420 |
100.0 |
103.8 |
|
2.29 (90) |
0 (32) |
0.397053 |
0.442011 |
0.442011 |
0.407873 |
100.0 |
102.7 |
|
2.29 (90) |
13 (55) |
0.441731 |
0.484734 |
0.484734 |
0.452145 |
100.0 |
102.4 |
Analysis of table 4 shows that true LTEs are the same for all cases, whereas computed LTEs vary from 94.7 to 103.8 percent. Computed LTE increases as void size and temperature differential increase, supporting the hypothesis that the presence of voids and slab lift-off may lead to FWD measurements corresponding to LTE higher than 100 percent.
From these data, one can conclude that high LTE does not necessary mean measurement error; it can be explained by the fact that measurements are usually taken 152 mm (6 inches) away from the joint. Therefore, these LTEs were retained in the analysis.
Analysis of figure 8 also shows that loading position has a significant effect on resulting LTEs of individual cracks of CRCP sections. Indeed, less that 30 percent of cracks had mean LTEs of less than 90 percent from the FWD test with a load plate on the leave side of a crack (loading position C5). Moreover, more than 37 percent of cracks had mean LTEs of less than 90 percent if an FWD load plate was placed on the approach side of a crack (loading position C4).
As observed in figure 9, the loading position has an even greater effect on the resulting LTEs of individual joints of JCP sections. For example, more that 30 percent of joints had mean LTE less than 70 percent from the FWD test with a load plate on the approach side of a joint (loading position J4). In addition, fewer than 24 percent of joints had mean LTEs less than 70 percent if an FWD load plate was placed on the leave side of a joint (loading position J5).

Figure 8. Distribution of crack LTE mean values, CRCP sections.

Figure 9. Distribution of joint LTE mean values, JCP sections.
Because loading position has a significant effect on mean LTEs for individual cracks and joints, it is not a surprise that mean values for LTPP sections were also affected by loading position. Figures 10 and 11 present comparisons of mean LTEs derived from data under the approach and leave tests for CRCP and JCP sections, respectively, calculated for each test section for each FWD pass.
To further investigate this effect, a Student t-test was conducted for the FWD tests conducted on each section in the same FWD pass to compare the average LTEs computed from approach and leave tests deflection data. The data were considered to come from the same population if the null hypothesis of equal means and mean could not be rejected at the 95 percent confidence level (p-value < 0.05).
Table 5 presents the results of this analysis. For CRCP sections, 223 of 353 data sets (66 percent) did not exhibit a significant difference between the LTEs determined from approach and leave tests. Twenty-one data sets (6 percent) resulted in LTEs from approach tests statistically higher than LTEs from leave tests. Finally, 99 data sets (28 percent) resulted in LTEs from leave tests statistically higher than LTEs from approach tests.
For JCP sections, 1893 of 2652 data sets (71 percent) did not exhibit significant differences between LTEs determined from approach and leave tests. Only 163 data sets (6 percent) resulted in LTEs from approach tests statistically higher than LTEs from leave tests. Finally, 596 data sets (22 percent) resulted in LTEs from leave tests statistically higher than LTEs from approach tests.
Although a significant number of data sets were identified as producing statistically different mean LTEs from approach and leave tests, in many cases the differences of mean values from those data sets were not practically significant. To address this issue, the results of t-tests were re-evaluated and data sets with an absolute difference in LTEs from approach and leave tests less than 5 percent were assigned to be indifferent to FWD load position. The results of this analysis are presented in table 6. As expected, the number of FWD data sets for which mean LTEs from leave and approach test were found to be statistically and practically different are lower than the number of data sets for which these LTEs are just statistically different. At the same time, however, the number of data sets for JCP sections for which mean LTEs from tests approach and leave are different both statistically and practically is still quite high.
Table 5. Comparison of statistical significance of LTEs from approach and leave deflection tests.
|
Pavement |
Number of FWD Passes |
|||
|---|---|---|---|---|
|
Type |
Total |
Statistically Similar |
Approach LTE is Greater |
Leave LTE is Greater |
|
CRCP |
353 |
233 |
21 |
99 |
|
JCP |
2652 |
1893 |
163 |
596 |
Table 6. Comparison of practical difference between LTEs from approach and leave deflection tests.
|
Pavement |
Number of FWD Passes |
|||
|---|---|---|---|---|
|
Type |
Total |
Practically Similar |
Approach LTE is Greater |
Leave LTE is Greater |
|
CRCP |
353 |
346 |
1 |
6 |
|
JCP |
2652 |
2174 |
63 |
415 |
As was discussed in chapter 2, an attempt was made to explain this effect by considering the presence of voids under the leave slab. However, that model could only provide an explanation for the cases when mean LTE from the approach test is greater than mean LTE from the leave test. For the majority of the cases when the opposite trend was observed, no good mechanistic explanation was found. As suggested by Byrum (2001), test sequence can affect LTE measurements significantly. Since in the LTPP testing program the approach test is always performed prior to the leave test, aggregate interlock is better established after the approach tests are completed, which may result in higher measured LTE. This hypothesis, however, could not be verified under this study.

Figure 10. Effect of FWD load position on mean section crack LTE for CRCP.

Figure 11. Effect of FWD load position on mean section LTE for JCP.
The LTPP database contains up to 12 records of LTE measurements for each joint at any specific time (4 repetitive measurements at 3 different load levels). This provides an opportunity to investigate the extent of variability in measured LTE for a single joint. To characterize this variability, standard deviations of LTE for individual cracks/joints were computed.
Figure 12 presents a frequency histogram of standard deviations for CRCP and JCP for leave and approach tests. Most joints showed low variability in LTE measurement with a standard deviation of less that 2 percent. Moreover, variability in LTE for cracks was lower than for joints. Joint LTEs determined from the leave slab test exhibited slightly higher variability than LTEs from the approach slab test.
For JCP sections, comparison of variability of joint LTE for doweled and nondoweled sections was also conducted. It was found that doweled joints exhibited slightly lower coefficient of variation than nondoweled joints for both approach and leave tests, as can be observed from figures 13 and 14, respectively. Therefore, one can conclude that the presence of dowels reduces the variability of load transfer.
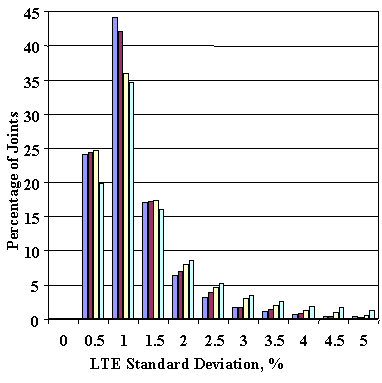

Figure 12. Frequency distributions of standard deviations of LTEs for individual cracks/joints from different test types.

Figure 13. Frequency distributions of standard deviations of LTEs for nondoweled and doweled joints, approach test.

Figure 14. Frequency distributions of standard deviations of LTEs for nondoweled and doweled joints, leave test.
It is generally believed that the LTE of cracks and joints does not depend on load level if the load level is sufficiently large. However, for joints that exhibited high variability (or poor repeatability) in LTE measurements, load level dependency might be one of the reasons for such variability. To investigate this hypothesis, an analysis of the load dependency index was performed. The load dependency index classifies joint/crack LTE as load-dependent if the mean LTE for the lowest load level is more than 5 percent different from the mean LTE for the highest load level.
Table 7 presents the summary of load dependency indexes for all joints and cracks evaluated. The majority of LTEs of cracks in CRCP were classified as load level independent (more than 96 percent for both leave and approach tests). A higher percentage of LTEs of JCP joints were classified as load level dependent (decreasing or increasing with the FWD load level) (9 percent for approach slab tests and 16 percent for leave slab tests).
It is interesting to note that, for approach slab testing, the number of joints that exhibited an increase in LTE level with load level increase is almost equal to the number of joints that exhibited a decrease in LTE with an increase in load level. Moreover, for the leave slab testing, almost all load level-dependent LTEs increased as load levels increased.
Table 7. Joint LTE load level dependence.
|
Test Type |
Percentage of Joint with LTE Load Level Relationship |
|||
|---|---|---|---|---|
|
Independent |
Decreasing with Load Increasing |
Decreasing with Load Decreasing |
Not Defined |
|
|
C4 (approach) |
96.8 |
2.0 |
1.0 |
0.2 |
|
C5 (leave) |
96.4 |
1.9 |
1.5 |
0.2 |
|
J4 (approach) |
90.0 |
5.0 |
4.1 |
0.9 |
|
J5 (leave) |
82.9 |
1.2 |
15.2 |
0.8 |
Different percentages of load level-dependent joints for leave and approach tests for the same type of pavement indicate that the same joint may exhibit load level-dependent behavior for FWD tests on one side of the joint and load level-independent behavior for another side of the joint. Figures 15 and 16 give examples of such behavior. The joints of section 370201 in North Carolina exhibited very low load level dependency for an approach test on November 27, 1995. During the same FWD pass, a leave test indicated that joint LTE increased as the load level increased.
To further evaluate this phenomenon, mean LTEs were computed for each LTPP section for individual FWD passes and load levels. Similar to what was discussed above for LTE of individual joints, load level dependency for each FWD pass was determined. The section was identified to exhibit load level-independent behavior for a certain FWD pass and test type (leave or approach) if a student t-test finds LTEs from the lowest and highest load level statistically different and mean values for the lowest and highest load level LTEs differ by more than 5 percent.
Table 8 presents a summary of load dependency indexes for all FWD passes evaluated. The vast majority of LTPP sections were classified as having load level-independent LTEs (99.7 and 98.9 percent of FWD passes of CRCP sections for approach and leave tests, respectively, and 97.2 percent of approach test FWD passes for JCP sections). In addition, more than 10 percent of FWD passes of leave tests of JCP sections resulted in load level-dependent LTE (mostly LTE increasing with FWD load increasing).
Table 8. FWD pass LTE load level dependence.
|
Test Type |
Independent, Percentage of FWD Passes |
Decreased, Percentage of FWD Passes |
Increased, Percentage of FWD Passes |
|---|---|---|---|
|
C4 (approach) |
99.7 |
0.0 |
0.3 |
|
C5 (leave) |
98.9 |
0.3 |
0.8 |
|
J4 (approach) |
97.2 |
1.4 |
1.4 |
|
J5 (leave) |
89.6 |
0.2 |
10.2 |
To evaluate whether load level dependency is a repeatable effect, sections with multiple FWD visits were evaluated. For each section that exhibited load level-dependent LTE behavior on at least one FWD visit, the ratio of the visits that resulted in load level-dependent behavior to the total number of FWD visits of that section was calculated. The averages of those ratios then were computed and found to be 0.36 and 0.52 for approach and leave tests, respectively. Thus, if a section exhibited load level-dependent LTE for a leave test, there is only about a 50 percent chance that the next FWD visit also will find the LTE for this section load level dependent.
Conversely, such low repeatability may be explained by variability from visit to visit in the actual LTE measurements. LTE level may vary from one visit to another, as a result of changes in temperature conditions. As will be discussed later in this chapter, FWD passes with higher mean LTE have lower overall variability than passes with lower mean LTE. Therefore, an increase in LTE level from one pass to another may render the difference in LTEs from different load levels statistically insignificant.
To eliminate this effect, the analysis of load dependency variability was repeated for FWD passes with mean LTEs of less than 80% and for FWD passes with mean LTEs of less than 70%. The results of those analyses are summarized in table 9. If only passes with low LTEs are considered, the repeatability of load level dependency for the leave test increases to 82%. Therefore, it is quite likely that load level dependency is a repeatable effect for the leave test. However, no explanation was found for why the same trend was not observed for approach tests.
Table 9. Repeatability ratios for different LTE levels.
|
Test Type |
Average Repeatability Ratio |
||
|---|---|---|---|
|
All Passes |
Passes with Mean LTE Lower than 80% |
Passes with Mean LTE Lower than 70% |
|
|
Approach (J4) |
0.36 |
0.42 |
0.45 |
|
Leave (J5) |
0.52 |
0.73 |
0.82 |
| 1 m = 3.28 ft |

Figure 15. LTE for section 370201 on November 27, 1995, approach (J4) test.
| 1 m = 3.28 ft |

Figure 16. LTE for section 370201 on November 27, 1995, leave (J5) test.
Variability in LTE Along Section Length
In this study, mean values and standard deviations of joint/crack LTEs were calculated for each FWD pass of GPS and SPS sections. To further examine how well these mean values represent pavement section joint/crack properties, distributions of coefficients of variation of LTE for FWD visits were analyzed. Figure 17 shows cumulative frequency distributions of the coefficient of variation of LTE for JCP and CRCP sections. The variability in LTE is much lower for CRCP sections than for JCP sections. The coefficient of variation in crack LTE is less than 5 percent for more than 90 percent of CRCP pavement sections. In addition, more than 30 percent of JCP sections exhibited a coefficient of variation greater than 10 percent.
The lower spatial variability in CRCP crack LTE can be explained by the fact that the LTE of CRCP cracks is expected to be very high (in the range of 90 to 100 percent) for pavements that are performing well. To achieve this, low spatial variability is required. Because joint LTE is expected to deteriorate over time, higher variability is possible for older sections.
The relationship between LTE level and LTE variability was first identified by Wu and Tayabji (2002). They found that the LTE coefficient of variation (a ratio of the standard deviation and mean LTE) is inversely related to the mean LTE. This hypothesis was confirmed by this study.

Figure 17. Coefficient of variation of LTE within a section.
Figure 18 shows the coefficients of variation as a function of mean LTE. The coefficient of variation decreases as the mean LTE increases. The figure also confirms the observation made by Wu and Tayabji that variability of coefficients of variation among sections with lower LTE is higher than those with a higher level of LTE.
The effect of load location on spatial variability also was investigated. Analysis of figure 17 shows no appreciable difference in spatial variability from LTE tests of approach slabs (J4 and C4) and from leave sides (J5 and C5) for JCP and CRCP sections. Moreover, it was found that doweled JCP sections exhibited lower spatial variability than nondoweled JCP sections for both leave and approach tests (see figures 19 and 20).

Figure 18. Coefficient of variation versus mean LTE for approach tests.

Figure 19. Comparison of standard deviations of section LTE for doweled and nondoweled JCP sections
(approach tests).

Figure 20. Comparison of standard deviations of section LTE for doweled and nondoweled JCP sections (leave tests).
The effects of design features and site conditions affecting LTE were investigated in this study. The effects of the following parameters were investigated:
Type of Load Transfer Device
As expected, the type of load transfer device has a major effect on the LTE of JCP joints. Figures 21 and 22 show comparisons of cumulative distributions of mean LTEs for each FWD pass for doweled and nondoweled sections for approach and leave tests, respectively. Doweled joints exhibited much higher LTE than nondoweled joints. For example, 64 and 68 percent of doweled sections exhibited mean LTE greater than 80 percent for approach and leave tests, respectively. For nondoweled sections, the corresponding values were only 40 and 48 percent of sections.
Surprisingly, dowel diameter was not found to have a significant effect on LTE (see figures 24 and 26). However, these results could be confounded by many factors, including pavement age, traffic level, PCC properties, and construction quality.

Figure 21. Distribution of section LTE mean value, nondoweled versus doweled, approach test (J4).

Figure 22. Distribution of section LTE mean value, nondoweled versus doweled, leave test (J5).

Figure 23. Distribution of joint LTE mean value, nondoweled versus doweled, approach test (J4).
| 1 inch = 25.4 mm |

Figure 24. Distribution of joint LTE mean value for different dowel diameters, approach test (J4).

Figure 25. Distribution of joint LTE mean value, nondoweled versus doweled, leave test (J5).
| 1 inch = 25.4 mm |

Figure 26. Distribution of joint LTE mean value for different dowel diameters, leave test (J5).
Effect of Base Type
The LTPP PCC pavement sections employ many different types of materials as the base layer. To analyze the effects of base type on joint/crack LTE determined from the FWD deflection data, these different types were combined into four groups: untreated aggregate base (AGG), asphalt-treated base (ATB), cement-treated base (CTB), and lean concrete base (LCB). The materials used for AGG included gravel or crushed stone, limerock, and soil-aggregate mixture. The materials used for ATB included dense-graded asphalt cement, open-graded asphalt concrete, and sand asphalt. The materials used for CTB included cement-aggregate mixture and cement-treated subgrade soil.
LTEs of individual joints were separated according these base types. Figures 27 and 28 show cumulative distributions of doweled joints LTEs for different base types calculated from approach and leave tests, respectively. No significant correlation was found between LTE distribution and base type for doweled joints.
LTE distributions for nondoweled joints for different base types computed from approach and leave tests are shown in figures 29 and 30, respectively. AGG, ATB, and CTB exhibited very similar distributions of LTE. In addition, joints in JCP sections with LCB exhibited lower LTE than joints in JCP sections with other base types. A statistical t-test was conducted to compare the significance of the difference in LTE for pavements with LCB and other bases. It was found that this difference was statistically significant (p-value equal to 1.e-9).
This analysis was conducted for mean joint LTE. Some joints were tested several times a day, whereas others were tested only once per visit. An additional analysis was conducted to compare mean section LTEs. Only the first FWD pass from each visit was considered in this analysis. A t-test was conducted to compare mean section LTEs for the nondoweled sections with LCB with other nondoweled JCP sections. Table 10 presents the results of the analysis. As in the analysis of LTEs from individual joints, mean LTE for sections with LCB is lower than mean LTE for all other sections. A moderate level of statistical significance (p-value equal to 0.1) was found.
This result is somewhat unexpected, as it commonly is believed that the presence of a stabilized base should improve LTE. However, the presence of a stiff base may increase PCC slab curling and also may contribute to lower LTE. In addition, a crack in LCB often exists directly beneath the joint in the PCC slab above, which would cause a reduction in LTE of the PCC slab and base.

Figure 27. Distribution of joint LTE mean values for different base types, doweled joints, approach test (J4).

Figure 28. Distribution of joint LTE mean values for different base types, doweled joints, leave test (J5).
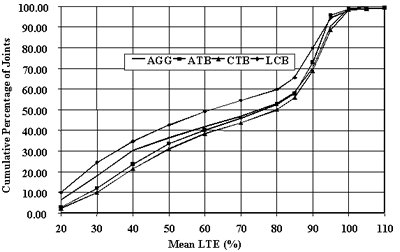
Figure 29. Distribution of joint LTE mean values for different base types, nondoweled joints, approach test (J4).
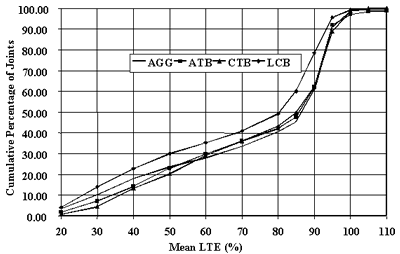
Figure 30. Distribution of joint LTE mean values for different base types, nondoweled joints, leave test (J5).
Table 10. Results of t-test for the effects of LCB on mean section LTE.
|
Test |
Mean LTE |
p-value |
Statistical |
|
|---|---|---|---|---|
|
LCB |
Other JCP |
Significance* |
||
|
Approach (J4) |
57.48 |
62.9 |
0.10 |
Moderately significant |
|
Leave (J5) |
65.46 |
70.3 |
0.11 |
Moderately significant |
* p-value less than or equal to 0.05 was considered significant.
Effect of Subgrade Type on LTE
LTPP rigid pavement section support conditions vary from soft, fine-graded material to rock subgrade. Using the American Association of State Highway and Transportation Officials' (AASHTO) soil classification, the PCC test section subgrade soils were grouped into coarse subgrade (AAHTO soil types A-1, A-2, and A-3) and fine subgrade (AASHTO soil types A-4, A-5, A-6, and A-7).
Mean joint LTEs were compared separately for doweled and nondoweled joints. Figures 31 and 32 show comparisons of cumulative distributions of LTE for doweled joints from approach and leave tests, respectively. The joints of PCC sections with fine subgrade exhibited higher LTEs than sections with coarse subgrade for both approach and leave tests. For example, in the approach test, only 30 percent of joints of the sections with fine subgrade had LTEs less than 80 percent, whereas for sections with coarse subgrade such joints account for almost 40 percent of all joints. Although mean LTEs for fine and coarse subgrade sections were quite close (81.9 and 78.5, respectively, for approach tests, and 83.9 and 81.0, respectively, for leave tests), a statistical t-test showed that the difference between LTE for fine and coarse subgrade sections is statistically significant, as shown in table 11.
Although this observation is somewhat surprising, it can be explained mechanistically. As was explained in chapter 2, joint LTE is governed by a nondimensional joint stiffness parameter, AGG*, defined as
 (21)
(21)
where:
- AGGtot = the combined joint stiffness due to dowel and aggregate load transfer.
- k = the subgrade k-value.
-  = the radius of relative stiffness.
If two pavements have the same joint and other design features but are placed on different subgrades, they should have the same joint stiffness. In addition, a section with a lower k-value will have lower product of k-value and the radius of relative stiffness. Therefore, a section with a lower k-value will have higher nondimensional joint stiffness, AGG, and higher joint LTE.
As found by Khazanovich et al. (2001), the LTPP sections with a coarse subgrade have, on average, higher k-values than the sections with fine subgrade, and this difference is statistically significant. Therefore, it is reasonable to expect that JCP with a coarse subgrade would exhibit lower LTE, on average.
However, an analysis of the effect of subgrade type on LTE of nondoweled joints found higher LTE for sections with fine subgrade only for approach tests, as presented in figure 33. A statistical t-test also confirmed the significance of the difference. No difference was found for LTE calculated from the leave slab test, as demonstrated in figure 34. A statistical t-test confirmed lack of significance (see table 11).
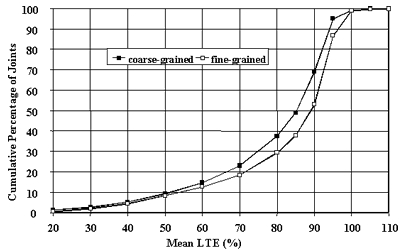
Figure 31. Distribution of joint LTE mean values for different subgrade types, doweled joints, approach test (J4).
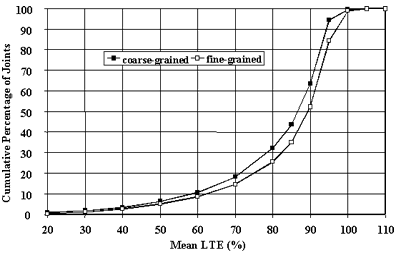
Figure 32. Distribution of joint LTE mean values for different subgrade types, doweled joints, leave test (J5).
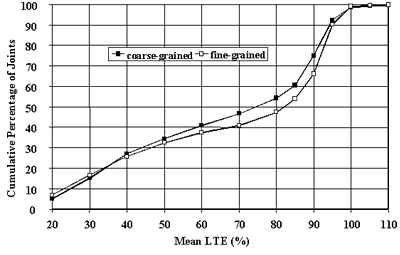
Figure 33. Distribution of joint LTE mean values for different subgrade types, nondoweled joints, approach test (J4).
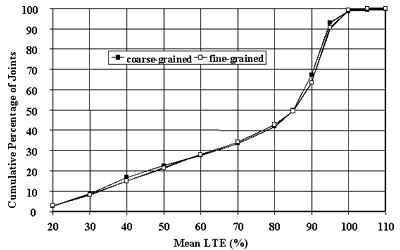
Figure 34. Distribution of joint LTE mean values for different subgrade types, nondoweled joints, leave test (J5).
Table 11. Results of t-test for the effects of subgrade type on mean section LTE.
|
Joint Type |
Test |
Mean LTE |
p-value |
Statistical |
|
|---|---|---|---|---|---|
|
Fine Subgrade |
Coarse Subgrade |
Significance* |
|||
|
Doweled |
approach |
78.54 |
81.99 |
0.000240 |
significant |
|
Doweled |
leave |
81.00 |
83.95 |
0.000001 |
significant |
|
Nondoweled |
approach |
65.35 |
67.51 |
0.000481 |
significant |
|
Nondoweled |
leave |
72.82 |
73.25 |
0.427858 |
not significant |
* p-value less than or equal to 0.05 was considered significant.
Effect of PCC Thickness on LTE
The effects of PCC thickness of cracks and joints on LTE were analyzed in this study. To exclude the effects of multiple visits and passes, only one LTE value for each section was used in the analysis (the value that corresponds to the lowest mean LTE from all visits from both test types). The analysis was performed separately for CRCP, doweled JCP, and nondoweled JCP. Figures 35, 36, and 37 present the results of this analysis. No significant correlation between PCC thickness and LTE level was observed for any pavement type.
| 1 mm = .039 inch |
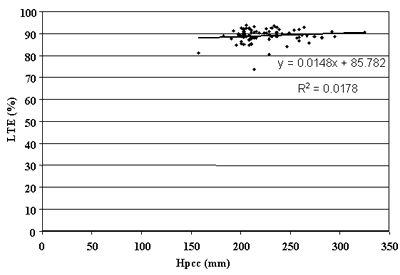
Figure 35. PCC thickness versus LTE in CRCP sections.
| 1 mm = .039 inch |
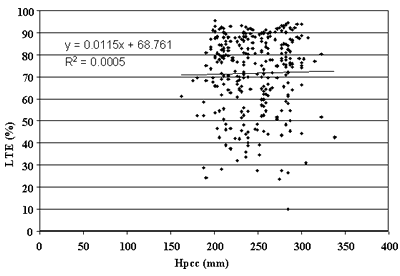
Figure 36. PCC thickness versus LTE in JCP doweled sections.
| 1 mm = .039 inch |
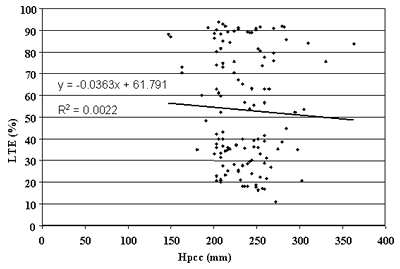
Figure 37. PCC thickness versus LTE in JCP nondoweled sections.
Effect of PCC Strength on LTE
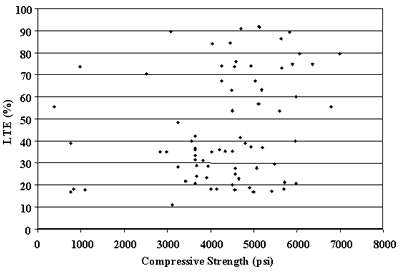
The effect of PCC compressive strength on LTE of cracks and joints was analyzed in this study. The analysis was performed separately for CRCP, doweled JCP, and nondoweled JCP, using only the minimum LTE values from all FWD visits and test types. Figures 38, 39, and 40 present the results. No significant correlation was found between PCC strength and LTE level for any pavement type. For CRCP, a slight decrease in LTE level was observed with strength increase. This may be explained by the higher level of shrinkage usually associated with high-strength PCC mixes. A higher level of shrinkage may increase crack opening and reduce LTE. It should be noted, however, that the trend is not significant enough to draw any definitive conclusions.
| 1 psi = 6.895 kPa |
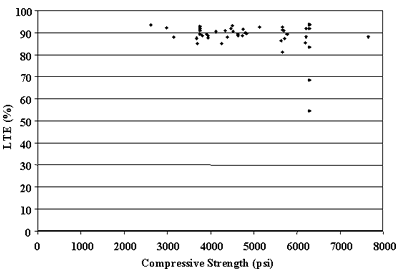
Figure 38. PCC compressive strength versus LTE in CRCP sections.
| 1 psi = 6.895 kPa |
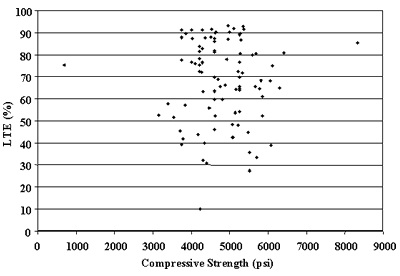
Figure 39. PCC compressive strength versus LTE in JCP doweled sections.
| 1 psi = 6.895 kPa |
Figure 40. PCC compressive strength versus LTE in nondoweled sections.
Effect of Design Steel Content on LTE
The effect of the longitudinal reinforcement on LTE of cracks in CRCP sections was investigated in this study, using only the minimum LTE values from all FWD visits and test types. Figure 41 presents the results. No significant correlation between PCC thickness and LTE level was observed for any pavement type.
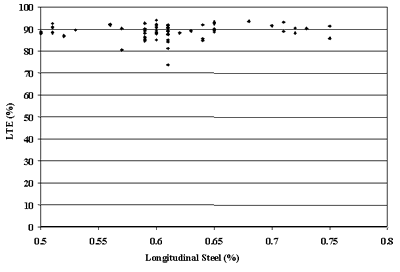
Figure 41. Steel content versus LTE in CRCP sections.
Effect of Joint and Crack Spacing on LTE
The effects of contraction joint spacing on lowest mean LTE of JCP joints and cracks in CRCP sections were investigated in this study. Figures 42 and 43 present plots of LTE of JCP sections versus mean joint spacing, and LTE of CRCP sections versus mean crack spacing, respectively. No significant correlation between LTE and joint/crack spacing was observed in either case.
| 1 ft = .305 m |
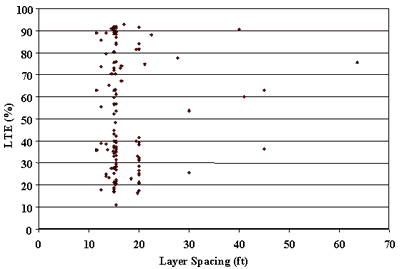
Figure 42. Mean joint spacing versus LTE in nondoweled JCP sections.
| 1 m = 3.28 ft |
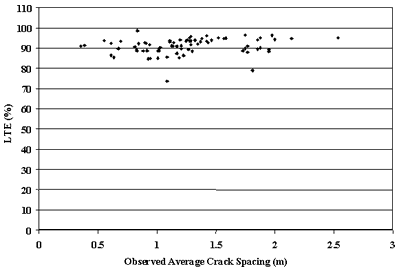
Figure 43. Mean crack spacing versus LTE in CRCP sections.
Effect of Joint Orientation on LTE
Although the practice of skewing joints has been common for many years, there exists little evidence of its benefits. The effects of joint skewness on LTE were investigated in this study. As can be observed from Figurefigure 44, no significant correlation between LTE and joint skewness was found.
| 1 ft = .305 m |
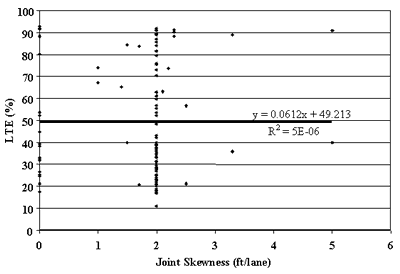
Figure 44. Joint skewness versus JCP LTE.
The effects of four climatic parameters (annual precipitation, number of annual freezing-thawing cycles, annual freezing index, and mean annual temperature) on LTE were also analyzed in this study. The analysis was conducted separately for CRCP, doweled JCP, and nondoweled JCP. Annual precipitation showed no appreciable effect on LTE. Figure 45 shows a slight decrease in LTE as precipitation increases. This effect is even less pronounced for nondoweled JCP and CRCP sections. Analysis of the effects of temperature factors show that sections in a cold climate (Freezing Index of greater that 800 o C-day) exhibited higher LTE than sections located in a warmer climate, as can be observed from figure 46. No appreciable effect of climatic variables on LTE of nondoweled JCP and CRCP sections was found, as can be observed from figures 47 and 48.
| 1 mm = .039 inch |
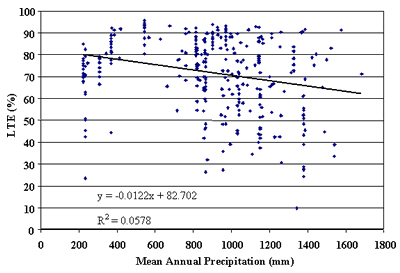
Figure 45. Annual precipitation versus LTE of doweled JCP.
| °F-days = 1.8 °C-days |
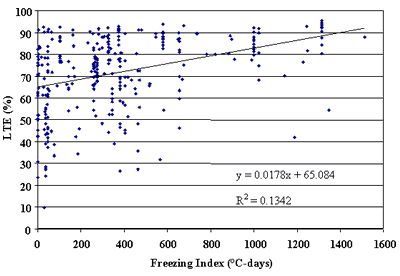
Figure 46. Freezing index versus LTE of doweled JCP.
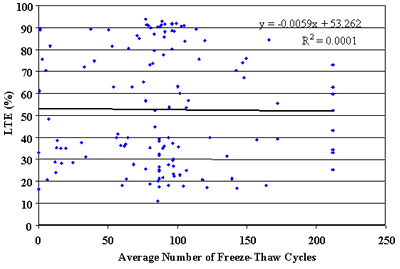
Figure 47. Annual number of freeze-thaw cycles versus LTE of nondoweled JCP.
| F = 1.8C + 32 |
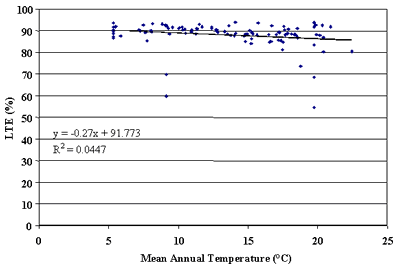
Figure 48. Mean annual temperature versus LTE of CRCP.
Effect of Pavement Age on LTE
It is expected that the LTE of joints and cracks deteriorate over time. However, the rate of deterioration depends on many parameters, such as climatic conditions, design features, traffic loading, and PCC material properties. Figures 49, 50, and 51 show LTEs of nondoweled JCP, doweled JCP, and CRCP, respectively, versus time for approach slab testing. No strong trends were observed. For example, many old JCP and CRCP exhibited a high level of LTE after more than 20 years of service. Additionally, In addition, several recently constructed JCP, both doweled and nondoweled, show a low level of LTE after only a few years of construction. This is a phenomenon that should be investigated further investigated. Analysis of LTEs from leave slab tests also did not identify any definitive trend.
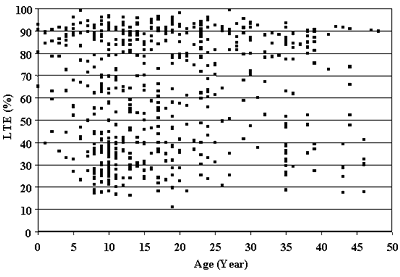
Figure 49. Age versus LTE of nondoweled sections, approach test (J4).
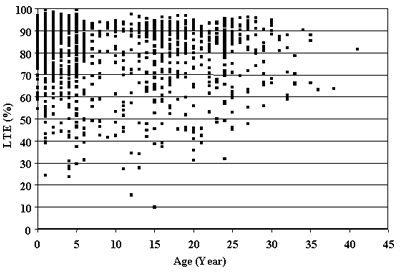
Figure 50. Age versus LTE of doweled sections, approach test (J4).
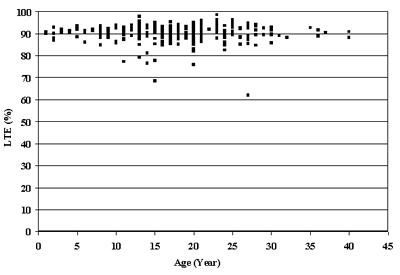
Figure 51. Age versus LTE of CRCP sections, approach test (C4).
In this study, the effect of LTE on JCP faulting of JCP and CRCP punchouts of CRCP was investigated.
Effect of LTE on Joint Faulting
Low LTE is one of the factors that contributes to transverse joint faulting in PCC pavements. The maximum faulting for JCP sections was plotted versus the corresponding lowest recorded mean section LTEs, as presented for doweled and nondoweled sections, figures 52 and 53, respectively. No strong correlation was found for doweled sections, although a few doweled sections exhibited significant faulting. A stronger correlation was found for nondoweled sections. Sections that exhibited average joint faulting greater than 2.5 mm (0.1 inch) have a lower percentage of sections with high LTE level greater than 80 percent than the sections with low faulting level (see figure 54).
| 1 mm = .039 inch |
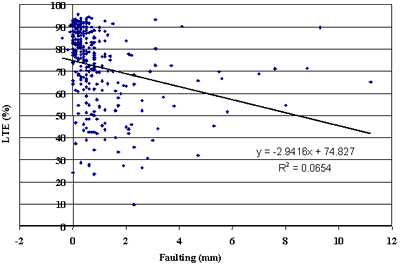
Figure 52. Faulting versus. LTE of doweled JCP.
| 1 mm = .039 inch |
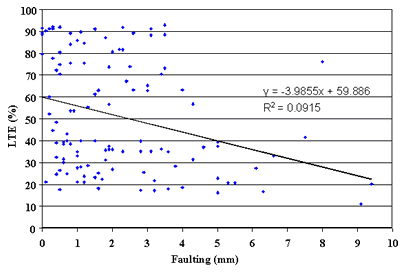
Figure 53. Faulting versus. LTE of nondoweled JCP.
| 1 mm = .039 inch |
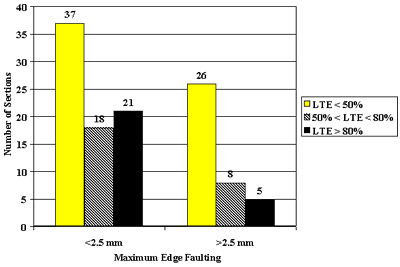
Figure 54. Effect of LTE on faulting of nondoweled pavements.
Effect of LTE on Punchouts
The majority of the LTPP CRCP sections exhibited very good performance, with only a few developing significant punchout levels. No significant relationship between crack LTE and number of punchouts was found in this study, as illustrated by figure 55.
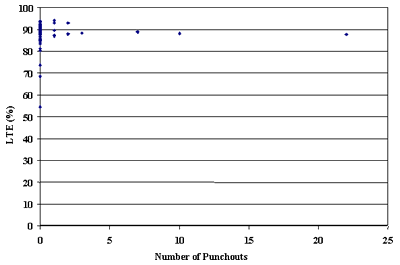
Figure 55. Number of punchouts (all severity levels) versus LTE.