U.S. Department of Transportation
Federal Highway Administration
1200 New Jersey Avenue, SE
Washington, DC 20590
202-366-4000
Federal Highway Administration Research and Technology
Coordinating, Developing, and Delivering Highway Transportation Innovations
 |
| This report is an archived publication and may contain dated technical, contact, and link information |
|
Publication Number: FHWA-RD-02-088 Date: May 2003 |
Previous | Table of Contents | Next
The FWD data collected for the SMP LTPP sections allow for analysis of the effect of season and time of day on joint LTE. Analysis of LTE was performed for 19 SMP sections, with a total of 1,945 FWD passes. The number of passes is much higher than the number of sections because the sections could be tested several times a day and several times per year. The deflection data were downloaded during the summer of 2001 from the LTPP database table MON_DEFL_DROP_DATA. Information about sensor locations was obtained from database tables MON_DEFL_LOC_INFO and MON_DEFL_DEV_SENSORS (June 2001 release). The procedure described in chapter 3 was used to calculate LTE from the FWD deflection basins and determine representative LTE indexes for individual joints and for each FWD pass.
The collected FWD data allow for analysis of the effect of time of day on measured joint LTE. Typically, several passes are conducted on SMP sections to study the variations that may occur over a single day. Almost all sections showed dependence of calculated LTE on the time of the testing. Figures 56 and 57 show the LTEs from approach (J4) and leave (J5) tests, respectively, for nondoweled section 163023 (Idaho) obtained from the three FWD passes conducted in September 1992 at 10:45 a.m., 1:10 p.m., and 3:15 p.m. The results show great variation over the course of the day. The lowest LTE values came from the first FWD pass for that day, when the calculated LTEs for several joints are approximately three times lower than from the 3:15 p.m. testing. Figures 58 and 59 show daily variation in LTEs for doweled section 040215 (Arizona) in March 1996. The lowest level of LTE for this section was measured at 10 a.m., whereas the highest one was measured after 2 p.m.
Similar effects were observed for many sections located in different climatic regions. Figures 60 and 61 present comparisons of mean LTEs for the doweled and nondoweled SMP sections, obtained for the same day from the first and third FWD pass deflection data. Significant differences in mean LTEs from different FWD passes were observed for many doweled and nondoweled sections. Moreover, the nondoweled sections exhibited much higher variability in LTE than the doweled sections for both approach and leave tests.
To investigate daily variation in LTE further, coefficients of variation of the mean section LTE for the SMP LTPP sections from different FWD passes made on the same day of testing were computed. Table 12 presents mean and maximum values of these coefficients of variation.
The mean coefficient of variation of mean LTE was found to be less than 10 percent for all doweled SMP sections for both approach and leave tests. However, of the 12 SMP doweled sections for which multiple FWD passes were available, a coefficient of variation in mean LTE greater than 10 percent was observed on at least 1 day of testing for 4 sections for test approach (J4) and for 5 sections for leave (J5) test.
1 m = 3.28 ft |
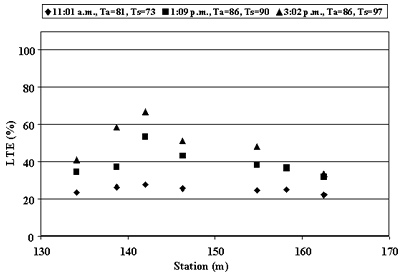
Figure 56. Daily variation in calculated approach LTE, section 163023 (September 1992).
1 m = 3.28 ft |
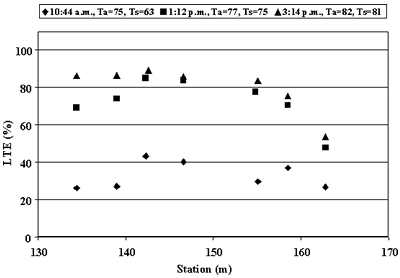
Figure 57. Daily variation in calculated leave LTE, section 163023 (October 1992).
1 m = 3.28 ft |
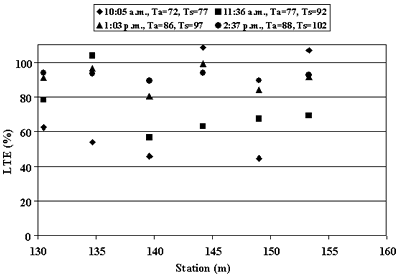
Figure 58. Daily variation in calculated approach LTE, section 4_0215 (March 1996).
1 m = 3.28 ft |
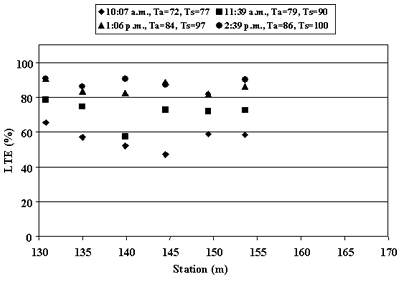
Figure 59. Daily variation in calculated leave LTE, section 4_0215 (March 1996).
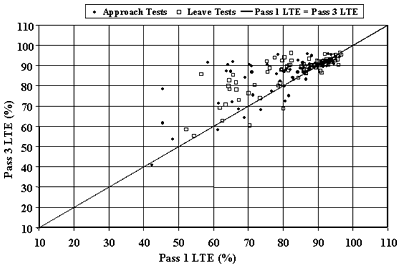
Figure 60. Comparison of mean LTEs for doweled SMP sections from different FWD passes on the same day of testing.
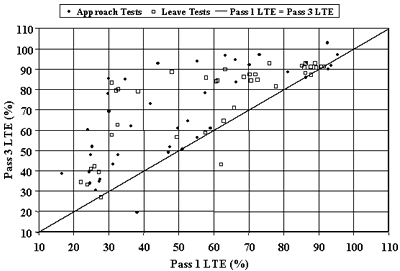
Figure 61. Comparison of mean LTEs for nondoweled SMP sections from different FWD passes on the same day of testing.
Table 12. Coefficients of variation of the section mean LTEs from the same day of testing.
|
Section |
State |
Type |
Approach (J4) |
Leave (J5) |
||
|---|---|---|---|---|---|---|
Mean |
Max |
Mean |
Max | |||
040215 |
Arizona |
doweled |
0.088 |
0.181 |
0.070 |
0.192 |
133019 |
Georgia |
doweled |
0.088 |
0.267 |
0.041 |
0.110 |
183002 |
Indiana |
doweled |
0.084 |
0.147 |
0.080 |
0.156 |
274040 |
Minnesota |
doweled |
0.062 |
0.104 |
0.063 |
0.102 |
320204 |
Nevada |
doweled |
0.025 |
0.047 |
0.019 |
0.034 |
364018 |
New York |
doweled |
0.031 |
0.058 |
0.043 |
0.079 |
|
370201 |
North Carolina |
doweled |
0.041 |
0.076 |
0.103 |
0.103 |
|
390204 |
Ohio |
doweled |
0.010 |
0.013 |
0.010 |
0.018 |
|
421606 |
Pennsylvania |
doweled |
0.025 |
0.060 |
0.030 |
0.059 |
|
484142 |
Texas |
doweled |
0.009 |
0.019 |
0.011 |
0.032 |
484143 |
Texas |
doweled |
0.022 |
0.060 |
0.027 |
0.070 |
893015 |
Quebec |
doweled |
0.007 |
0.012 |
0.007 |
0.015 |
063042 |
California |
nondoweled |
0.063 |
0.142 |
0.086 |
0.173 |
|
163023 |
Idaho |
nondoweled |
0.250 |
0.470 |
0.147 |
0.412 |
|
204054 |
Kansas |
nondoweled |
0.057 |
0.152 |
0.068 |
0.160 |
313018 |
Nebraska |
nondoweled |
0.243 |
0.478 |
0.307 |
0.447 |
493011 |
Utah |
nondoweled |
0.259 |
0.538 |
0.136 |
0.455 |
533813 |
Washington |
nondoweled |
0.031 |
0.045 |
0.022 |
0.032 |
833802 |
Manitoba |
nondoweled |
0.213 |
0.213 |
0.102 |
0.102 |
Much higher variability was observed for nondoweled sections. Only three of seven nondoweled SMP sections showed a mean coefficient of variation less than 10 percent. The remaining four sections exhibited a mean coefficient of variation greater than 20 percent for mean LTEs calculated from approach tests. Three sections (163023, 313018, and 493011) exhibited a coefficient of variation in mean LTE greater than 40 percent on at least one day of testing for both approach and leave tests. Only one section, 533813, did not exhibit significant daily variability in LTE. Significant daily variability in subgrade k-values backcalculated from FWD center slab deflections (test J1) for this section was reported in another study by Khazanovich et al. (2001).
It is reasonable to conclude, therefore, that the time of day of FWD testing may significantly affect joint LTE. This effect is most likely due to temperature differences and the resulting joint movement and slab curling. Therefore, accounting for the effect of PCC slab curling is very important for reliable interpretation of FWD deflection data. The effects of temperature conditions and joint opening on measured LTE will be discussed further in chapter 7. Nevertheless, the results presented above suggest that it is important to conduct FWD basin testing early in the morning to measure the lowest level of LTE, or during cold times of the year, when temperature remains constant all day.
As expected, the season in which testing was performed was found to affect measured joint LTE. This effect is highly confounded, however, with the time of testing. To reduce the latter effect, only first FWD passes for each day of testing were considered in the analysis of seasonal variation in joint LTE.
For each SMP section, mean LTEs obtained from different days of testing for the first FWD pass on each day were analyzed. Mean, maximum, and minimum values of those LTEs, as well as corresponding standard deviations and coefficients of variation, were determined. The results of that analysis for doweled sections for FWD for approach and leave test are summarized in tables 13 and 14, respectively. Tables 15 and 16 present corresponding results for nondoweled sections.
Significant seasonal variability in LTE, as well as between the LTEs from approach and leave tests, was observed for both doweled and nondoweled pavements. Analysis of tables 13 and 14 shows that every doweled SMP sections exhibited mean LTE of greater than 90 percent for at least one day of testing. At the same time, six sections exhibited an LTE lower than 60 percent (and four lower than 50 percent) from approach tests on at least one day of testing. Although slightly lower variability in LTE was observed for leave tests of doweled sections, five sections exhibited lower than 60 percent LTE on at least one day of testing.
Table 13. Seasonal variation of approach LTE (test J4) for doweled SMP sections.
|
Section |
Mean LTE, percent |
Minimum LTE, percent |
Maximum LTE, percent |
Standard Deviation, percent |
Coefficient of Variation |
|---|---|---|---|---|---|
40215 |
75.2 |
45.4 |
96.2 |
13.6 |
0.18 |
133019 |
80.3 |
45.5 |
95.8 |
15.2 |
0.19 |
183002 |
81.4 |
64.3 |
93.5 |
10.5 |
0.13 |
274040 |
76.8 |
57.7 |
94.5 |
9.9 |
0.13 |
320204 |
88.4 |
80.4 |
98.6 |
5.9 |
0.07 |
364018 |
80.6 |
59.9 |
91.5 |
6.5 |
0.08 |
370201 |
72.1 |
41.8 |
96.8 |
19.3 |
0.27 |
390204 |
93.3 |
87.6 |
98.2 |
2.7 |
0.03 |
|
421606 |
73.0 |
39.1 |
94.0 |
21.5 |
0.29 |
484142 |
90.3 |
83.1 |
97.0 |
2.8 |
0.03 |
484143 |
89.1 |
79.0 |
96.2 |
5.2 |
0.06 |
893015 |
90.5 |
76.6 |
102.7 |
4.6 |
0.05 |
Table 14. Seasonal variation of leave LTE (test J5) for doweled SMP sections.
Section |
Mean LTE, percent |
Minimum LTE, percent |
Maximum LTE, percent |
Standard Deviation, percent |
Coefficient of Variation |
|---|---|---|---|---|---|
40215 |
75.1 |
54.4 |
91.2 |
12.0 |
0.16 |
133019 |
84.6 |
56.1 |
94.8 |
9.6 |
0.11 |
183002 |
82.6 |
64.6 |
93.4 |
10.6 |
0.13 |
274040 |
74.5 |
52.4 |
92.1 |
10.9 |
0.15 |
320204 |
88.8 |
84.0 |
96.0 |
4.2 |
0.05 |
|
364018 |
78.4 |
62.5 |
92.0 |
6.7 |
0.09 |
|
370201 |
79.3 |
58.4 |
96.6 |
13.8 |
0.17 |
|
390204 |
93.3 |
88.0 |
96.8 |
3.0 |
0.03 |
|
421606 |
78.7 |
52.2 |
92.0 |
13.6 |
0.17 |
|
484142 |
90.8 |
84.8 |
95.4 |
2.6 |
0.03 |
|
484143 |
88.9 |
78.6 |
98.1 |
6.5 |
0.07 |
|
893015 |
90.4 |
81.9 |
95.4 |
3.6 |
0.04 |
Table 15. Seasonal variation of approach LTE (test J4) for nondoweled SMP sections.
|
Section |
Mean LTE, percent |
Minimum LTE, percent |
Maximum LTE, percent |
Standard Deviation, percent |
Coefficient of Variation |
|---|---|---|---|---|---|
63042 |
64.4 |
27.6 |
96.6 |
22.5 |
0.35 |
|
163023 |
51.1 |
24.9 |
91.8 |
20.8 |
0.41 |
|
204054 |
74.3 |
53.7 |
90.1 |
14.1 |
0.19 |
|
313018 |
38.1 |
23.8 |
85.8 |
15.8 |
0.41 |
493011 |
41.5 |
16.7 |
92.7 |
23.0 |
0.56 |
533813 |
72.7 |
37.6 |
95.6 |
18.0 |
0.25 |
|
833802 |
58.7 |
18.6 |
96.9 |
26.9 |
0.46 |
Table 16. Seasonal variation of leave LTE (test J5) for nondoweled SMP sections.
Section |
Mean LTE, percent |
Minimum LTE, percent |
Maximum LTE, percent |
Standard Deviation, percent |
Coefficient of Variation |
|---|---|---|---|---|---|
63042 |
64.4 |
27.6 |
96.6 |
22.5 |
0.35 |
163023 |
51.1 |
24.9 |
91.8 |
20.8 |
0.41 |
204054 |
74.3 |
53.7 |
90.1 |
14.1 |
0.19 |
|
313018 |
38.1 |
23.8 |
85.8 |
15.8 |
0.41 |
|
493011 |
41.5 |
16.7 |
92.7 |
23.0 |
0.56 |
|
533813 |
72.7 |
37.6 |
95.6 |
18.0 |
0.25 |
|
833802 |
58.7 |
18.6 |
96.9 |
26.9 |
0.46 |
As expected, seasonal variability is much higher for nondoweled sections. Analysis of tables 15 and 16 shows that every nondoweled SMP section exhibited mean LTE greater than 85 percent for at least one day of testing. In addition, of the 7 nondoweled sections, 5 and 4 exhibited lower than 30 percent LTE from approach and leave tests, respectively, on at least 1 day of testing. Therefore, the same section may be ranked as having very good or very poor LTE, depending on the day the testing was performed.
Figures 62 through 68 show mean LTEs and mean PCC surface temperature (for the duration of a FWD pass) obtained from different days of testing for the first FWD pass on each day. Analysis of these figures shows that, as a general trend, LTE increases when the PCC surface temperature increases. However, when PCC temperature drops below the freezing temperature of water (0 ºC [32 ºF]), LTE may increase dramatically (see figure 63).
It may be concluded that joint LTE depends significantly on the season and time of testing. Therefore, the results of LTE measurements taken in hot summer weather are not useful. Also, the poor correlations between design features and site conditions presented in chapter 4 may be explained by the fact that GPS sections were tested under a wide variety of climatic conditions.
F = 1.8C + 32 |
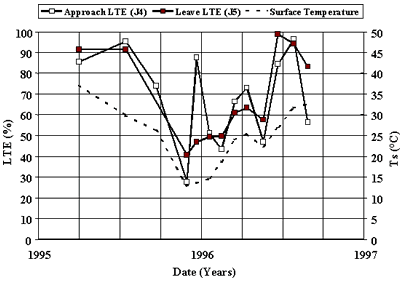
Figure 62. Seasonal variation in LTE and PCC surface temperature, section 63042.
F = 1.8C + 32 |
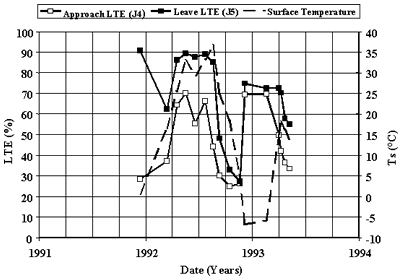
Figure 63. Seasonal variation in LTE and PCC surface temperature, section 163023.
F = 1.8C + 32 |
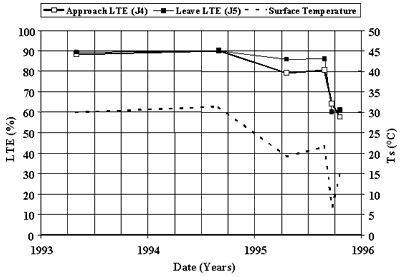
Figure 64. Seasonal variation in LTE and PCC surface temperature, section 204054.
F = 1.8C + 32 |
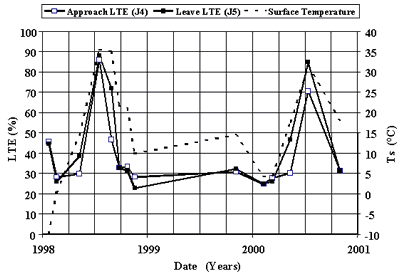
Figure 65. Seasonal variation in LTE and PCC surface temperature, section 313018.
F = 1.8C + 32 |
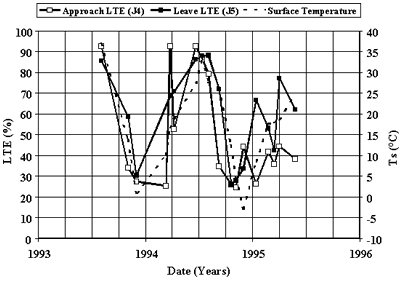
Figure 66. Seasonal variation in LTE and PCC surface temperature, section 493011.
F = 1.8C + 32 |
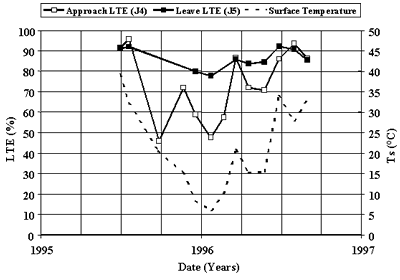
Figure 67. Seasonal variation in LTE and PCC surface temperature, section 533813.
F = 1.8C + 32 |
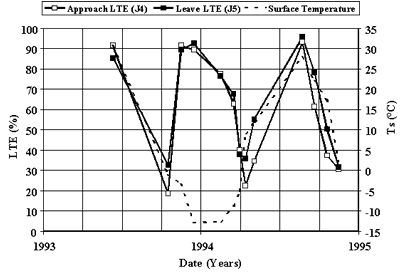
Figure 68. Seasonal variation in LTE and PCC surface temperature, section 833802.

