U.S. Department of Transportation
Federal Highway Administration
1200 New Jersey Avenue, SE
Washington, DC 20590
202-366-4000
Federal Highway Administration Research and Technology
Coordinating, Developing, and Delivering Highway Transportation Innovations
 |
| This report is an archived publication and may contain dated technical, contact, and link information |
|
Publication Number: FHWA-RD-02-088 Date: May 2003 |
Previous | Table of Contents | Next
Mechanistic modeling of joints and cracks in PCC pavements using a finite element program requires input of certain parameters. The most commonly used finite element programs for rigid pavement analysis usually require input of joint stiffness. This chapter presents a procedure for backcalculation of joint stiffness for the LTPP rigid sections and assessment of the results.
To backcalculate joint/crack stiffness, the following information must be available:
To calculate LTEs for cracks and joints, coefficients of subgrade reaction and radii of relative stiffness were downloaded during the summer of 2001 from the LTPP database table MON_DEFL_RGD_BAKCAL_SECT (June 2001 release). This table provides representative k-values and radii of relative stiffness for rigid LTPP sections for different FWD passes.
Representative joint stiffnesses were calculated using the following procedure:
Step 1. Select LTE value
For each FWD pass, compare mean LTEs from leave and approach tests (tests J4 and J5 for JCP and C4 and C5 for CRCP) and select the lowest value.
Step 2. Calculate nondimensional joint stiffness
Using the LTE value from step 1, calculate nondimensional joint stiffness using the following equation:
 (22)
(22)
where:
- AGG* is = nondimensional joint stiffness.
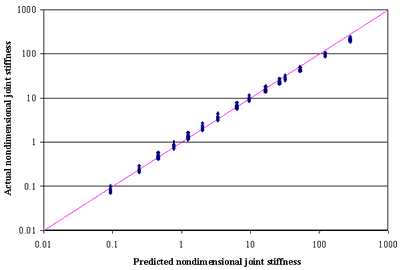
This equation is obtained by inverting Crovetti's equation (presented in equation 8). Analysis of the ISLAB2000 deflection data presented in figure 69 shows that these equations adequately predict nondimensional joint stiffness for a wide range of values.

Figure 69. Predicted versus actual ISLAB2000 nondimensional joint stiffness.
Step 3. Calculate joint stiffness
Using the following equation, calculate joint stiffness:
![]() (23)
(23)
where:
- k a is = the coefficient of subgrade reaction
-
![]() is =
radius of relative stiffness
is =
radius of relative stiffness
- AGG is = joint stiffness
This procedure cannot account for several effects discussed in chapters 4 and 5, such as possible load level -dependency and different behavior under loading on the leave and approach side of the joint. However, an advantage of this procedure is that the resulting joint stiffness can be used for a forward analysis using a popular finite element program for rigid pavement analysis, such as ILLI-SLAB and J-SLAB.
Joint stiffnesses were backcalculated for those LTPP sections and FWD visits for which the LTPP database table MON_DEFL_RGD_BAKCAL_SECT contained k-values and radii of relative stiffness. This resulted in representative crack stiffness for 134 visits of 72 CRCP sections and 910 visits of 250 JCP sections.
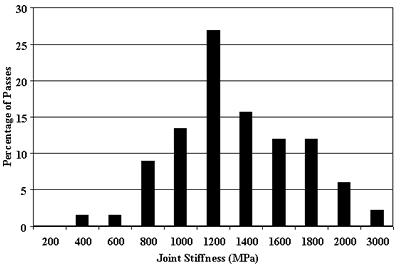
Figure 70 presents a frequency distribution of crack stiffness for CRCP sections. For more than two-thirds of the cases, the backcalculated CRCP crack stiffnesses ranged between 800 and 1600 MPa. The mean crack stiffness value for all cases was 1240 MPa.
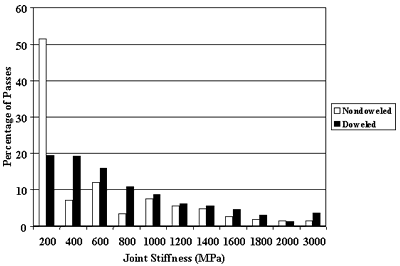
Frequency distributions of representative joint stiffness of joints of doweled and nondoweled JCP pavements are presented in figure 71. Comparingson of these distributions show that nondoweled joints usually have much lower stiffness than doweled joints. More than half of the backcalculated stiffness for nondoweled joints were less than 200 MPa, and the average value from all cases was 470 MPa. In addition, more than 60 percent of doweled joints had stiffnesses greater than 600 MPa, with the average value equal to 730 MPa.
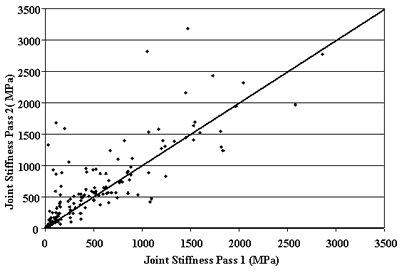
As stated above, LTE of cracks and joints varies with time, as do joint and crack stiffnesses. Figure 72 presents a comparison of joint stiffnesses backcalculated from the FWD deflections obtained on the same day of testing, but from different FWD passes. Significant variability exists for some joints, especially for those that exhibited lower stiffness at the time of the first FWD pass.
Currently, very little guidance is available for selecting joint and crack stiffness parameters for analyses of rigid pavement using finite element programs like ILLI-SLAB or JSLAB. This findings of this study have resulted in recommendations for the selection of joint stiffness values if they cannot be obtained from other sources. These recommendations are summarized in table 17. However, more research is needed to validate these recommendations.
Table 17. Recommended joint/crack stiffnesses for different types of pavements.
|
Pavement Type |
Recommended Ranges (MPa) |
|---|---|
|
Non-doweled JCP |
100 -500 |
|
Doweled JCP |
400 -1000 |
|
CRCP |
800 -1400 |

Figure 70. Frequency distribution of representative CRCP crack stiffness.

Figure 71. Frequency distributions of representative joint stiffnesses for joints of doweled and nondoweled JCP.

Figure 72. Comparison of backcalculated joint stiffness from two FWD passes on the same day of testing.