U.S. Department of Transportation
Federal Highway Administration
1200 New Jersey Avenue, SE
Washington, DC 20590
202-366-4000


Skip to content
Facebook iconYouTube iconTwitter iconFlickr iconLinkedInInstagram

Federal Highway Administration Research and Technology
Coordinating, Developing, and Delivering Highway Transportation Innovations

Report
This report is an archived publication and may contain dated technical, contact, and link information
Publication Number: FHWA-RD-02-088
Date: May 2003

Evaluation of Joint and Crack Load Transfer Final Report

Previous | Table of Contents | Next

As part of the LTPP program, data of rigid pavement joint movement are regularly obtained with gage measurements on all SMP test sections.  This testing program is being conducted periodically to study the daily and seasonal joint movements.  These data are intended to provide valuable pavement structural characteristics that are needed to achieve the goals of the LTPP program.  This chapter presents the procedure used in determination of representative joint movements from the measurements of distances between gages collected for the LTPP SMP sections.  This is followed by an assessment of joint movement data and a trend analysis.

Joint Movement Measurements

Gage distance measurements are performed at the joints of the LTPP SMP sections for which FWD deflection data are also collected.  The gage distance data were downloaded during the summer of 2001 from LTPP database table MON_JOINT_GAGE_DATA.  To determine the temperature distribution throughout the PCC layer at the time of gage distancemeasurements, PCC temperature measurements were downloaded from LTPP database table MON_DEFL_TEMP_VALUES.

For rigid pavements in the SMP LTPP program, three pairs of gages are installed at each joint where joint movements are measured:

Any change in distance between gages indicates a change in joint opening.

PCC slab temperature gradients are measured during the time of the deflection and joint movement testing with an interval of 30 minutes.  PCC temperatures are measured at 25 mm (1 inch) from the top of the PCC surface, at the middepth of the PCC layer, and at 25 mm (1 inch) from the bottom surface of the PCC layer.  An attempt was made to address temperature conditions at the time of gage distance measurements.  Since the time of temperature gradient measurements does not correspond exactly to the time of temperature measurements, PCC temperatures at the time of measurement were obtained by interpolation between the closest measurements.

Assessment of Gage Measurement Data

A total of 4,279 records were extracted from the LTPP database for 18 JCP sections.  The extracted data were examined to ensure their consistency and reasonableness.  Some records were excluded from the analysis for the following reasons:

A total of 3,278 records were used in the analysis.

Joint Movement Calculation Procedures

From the gage distance measurement data and PCC temperature measurement data, relative joint movements and corresponding PCC temperature profiles were calculated using the following procedures:

  1. DeterminePCC temperatures at the time of gage measurements.
  2. Determine gage pass number.
  3. Determinereference measurement.
  4. Determinechange in PCC temperature and corresponding change in joint opening.
  5. Determinejoint movement statistics.

Figure 73 presents an overview of the calculation process.  Each of the above steps are discussed in detail in the following sections.
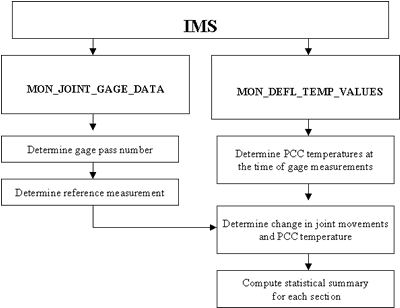
Figure 73. Flow chart of the overall process for joint movement calculation. Starting from information management system the procedures can go two ways; LTPP database table "mon joint gage data" or defl temp values." When computing values," the first process is to determine portland cement concrete temperatures at time of measurements, then change in movements and temperature, last compute statistical summary for each section. data, procedure pass numbers, reference measurement

Figure 73.  Flowchart of the overall process for joint movement calculation.

Step 1.  DeterminePCC temperatures at the time of gage measurements

To evaluate the effects of change in PCC temperature on joint opening, it is important to estimate PCC temperature at the time gage distance is measured.  To this end, PCC temperature measurements performed at the same section within 30 minutes before and after a gage distance measurement were located from LTPP database table MON_DEFL_TEMP_VALUES.  If two or more temperature records measured before gage measurements were found, the one that was measured at the closest location to the gage measurement at the closest time was selected.  If two or more temperature record measured after gage measurements were found, the one that was measured at the closest location to the gage measurement at the closest time was selected.  If a total of two records were selected (one before and one after the measurements), then the PCC temperature at the time of gage measurement, TG, was determined using the following equation:

Equation 24 The portland cement concrete temperature at the time of gage measurement equals the sum total of the portland cement concrete temperature at time the nearest time of portland cement concrete temperature measurement before the time of gage measurement times the total of the time of gage measurement minus the nearest time of portland cement concrete temperature measurement before the time of gage measurement, plus the sum total of the portland cement concrete temperature at time the nearest time of portland cement concrete temperature measurement after the time of gage measurement times the total of the nearest time of portland cement concrete temperature measurement after the time of gage measurement minus the time of gage measurement, all divided by the sum total of the nearest time of portland cement concrete temperature measurement after the time of gage measurement minus the nearest time of portland cement concrete temperature measurement before the time of gage measurement.    (24)

where:

-          tg = the time of gage measurement.

-          tb = the nearest time of PCC temperature measurement before the time of gage    measurement.

-          ta = the nearest time of PCC temperature measurement after the time of gage measurement.

-          Tb = PCC temperature at time tb.

-          Ta = PCC temperature at time ta.

If only one record with temperature measurement either before or after the gage measurements was found, then that PCC temperature was assigned.

Step 2.  Determine gage pass number

To compute statistics for changes in joint opening for the SMP LTPP sections, gage distance measurements were grouped by gage passes.  Each gage measurement and joint opening parameter received a gage pass number from 1 to 9.  The following procedure was used:

Step 3.  Determine reference measurement

By default, for each section, measurements during the first gage pass at the earliest test day are assigned as reference measurements.  However, if these measurements are incomplete or exhibit an unrealistically high difference in change in joint opening from different gages at the same joint (indicating either measurement error or significant slab rotation), then another set of measurements should be assigned as a reference by specifying test date and gage pass.

Step 4.  Determinechange in PCC temperature and corresponding change in joint opening

To obtain a change in joint opening, the corresponding reference gage measurement was subtracted from each gage measurement.  Also, a change in temperature measurement was compared to the temperature at the time the reference gage measurement was computed.

Because only uniform PCC slab extraction/contraction was investigated in this study, pair-wise comparisons of joint movements, obtained from different gages for the same test time, were made.  If the difference in movements was greater than the acceptable value 1 mm (0.039 inch), then the record was excluded from joint movement statistics calculation.  A threshold of 1 mm (0.039 inch) was selected because it represents a high level of expected change in joint opening during one day.  If the measured magnitude of change in joint opening for the same joint and test time but at different joint locations (inner slab edge, midlane, outer slab edge) exceeds this value, then it indicates either a measurement error, or significant slab rotation in addition to extraction/contraction.  Investigation of nonuniform joint opening was beyond the scope of this study.

Step 5.  Determine joint movement statistics

For each gage pass, the mean, minimum, maximum, and standard deviation of joint movements from all gages at all locations were determined, as well as the mean, minimum, maximum, and standard deviation of change in PCC temperature.

Daily Variation in Joint Opening

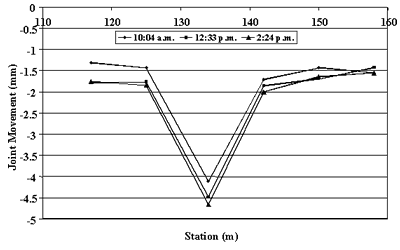
The collected gage distance data do not allow for determining absolute joint opening but can be used to study changes in joint opening, including daily changes.  Typically, several FWD passes are conducted each day on SMP sections to study the variations that may occur over a single day.  For many of those passes, gage distance measurements were performed.  As an example, figure 74 presents changes in joint opening for individual joints of section 274040 in May 1997 from three sets of measurements made at 10 a.m., noon, and 2 p.m.  The reference gage distancemeasurements were made on October 18, 1993.  Negative values of joint movements indicate that the joints were narrower than at the time of the reference measurement.  On May 6, 1997, the majority of the joints were open the most at 10 a.m. After 2 p.m., the majority of the joints were tighter than at 10 a.m. or noon.

1 m = 3.28 ft

Figure 74. Relative changes in joint opening for section 274040 on May 6, 1997, compared to joint opening in October 1993. Station, from 110 to 160 meters, is graphed on the horizontal axis. Joint movement, from negative 5 to 0 millimeters, is graphed on the vertical axis. The figure has three sites; 10:04 AM, 12:33 PM, and 2:24 PM. The three sites begin at the highest joint movement (negative 1.7 to negative 1.3) at 116 meters and decrease to the lowest movement (negative 5.7 to negative 4.1) at 135 meters. All sites increase to negative 2 millimeters at 142 meters. The negative values of joint movements indicate that the joint were narrower than at the time of the reference measurement

Figure 74.  Relative changes in joint opening for section 274040 on May 6, 1997  compared to joint opening in October 1993.

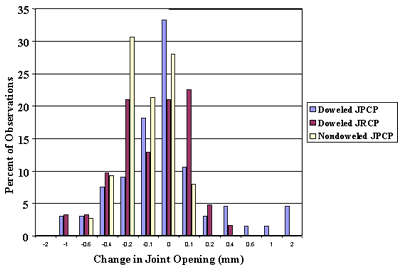
To further investigate daily joint movements, changes in joint opening from the first to the second gage distance measurement pass were calculated for each section visit. Table 18 presents average, minimum, and maximum changes in joint opening for each section from multiple visits.  Figure 75 shows frequency distributions of those changes for nondoweled SMP jointed plain concrete pavement (JPCP) sections, doweled SMP JPCP sections, and doweled SMP jointed reinforced concrete pavement (JRCP) sections. 

Analyses of table 18 and figure 75 show that the majority of all computed changes in joint opening are within reasonable limits (less than 2 mm (0.078 inches)).  Many sections exhibited a positive change in joint opening, although PCC temperature increased from the first to second pass for all but one case considered.  For example, the largest increase in joint opening, 1.70 mm (0.066 inch), was observed for section 370201 on January 23, 1996.  Although that day was relatively cold for North Carolina (PCC temperature was approximately 6 oC [42.8 oF]), the temperature did increase at the time of second pass by about 2 oC (35.6 oF).  No good explanation for this observation was found.

Table 18.  Changes in joint opening from different measurement passes  on the same day of measurements.

Section

State

Joint Type

Pavement Type

Joint Spacing
(m (ft))

Change in Joint Opening* (mm (inches))

Mean

Max.

Min.

133019

Georgia

doweled

JPCP

6
(19.68)

-0.04
(-0.0016)

 0.04
(0.0016)

-0.27
(-0.0105)

183002

Indiana

doweled

JPCP

     4.65
(15.25)

-0.17
(-0.0066)

 0.01
(0.0004)

-0.42
(-0.0164)

893015

Quebec

doweled

JPCP

     5.91
(19.38)

-0.09
(-0.0035)

 0.00
(0.00)

-0.17
(-0.0066)

040215

Arizona

doweled

JPCP

   4.5
(14.76)

-0.11
(-0.0043)

 0.70
(0.0273)

-0.84
(-0.0328)

320204

Nevada

doweled

JPCP

   4.5
(14.76)

-0.22
(-0.0086)

   --0.10
(-0.0039)

-0.35
(-0.0136)

370201

N. Carolina

doweled

JPCP

   4.5
(14.76)

 0.10
(0.0039)

 1.70
(0.0663)

-1.39
(-0.0542)

390204

Ohio

doweled

JPCP

   4.5
(14.76)

-0.15
(-0.0059)

 0.00
(0.00)

-0.49
(-0.0191)

063042

California

nondoweled

JPCP

     4.65
(15.25)

-0.18
(-0.0070)

 0.00
(0.00)

-0.34
(-0.0133)

313018

Nebraska

nondoweled

JPCP

     4.65
(15.25)

-0.15
(-0.0059)

 0.05
(0.0020)

-0.44
(-0.0172)

493011

Utah

nondoweled

JPCP

   4.5
(14.76)

-0.18
(-0.0070)

 0.09
(0.0035)

-0.51
(-0.0199)

833802

Manitoba

nondoweled

JPCP

   4.5
(14.76)

-0.23
(-0.0090)

 0.05
(0.0020)

-0.64
(-0.0250)

274040

Minnesota

doweled

JRCP

   8.1
(26.57)

-0.21
(-0.0082)

 0.18
(0.0070)

-1.06
(-0.0413)

364018

New York

doweled

JRCP

   19.05
(62.48)

-0.15
(-0.0059)

 0.38
(0.0148)

-0.67
(-0.0261)

484142

Texas

doweled

JRCP

   18.15
(59.53)

-0.04
(-0.0016)

 0.03
(0.0012)

-0.32
(-0.0125)

421606

Pennsylvania

doweled

JRCP

   13.95
(45.76)

-0.30
(-0.0117)

 0.12
(0.0047)

-1.49
(-0.0581)

484143

Texas

doweled

JRCP

  18.15
(59.53)

-0.07
(-0.0027)

 0.01
(0.0004)

-0.23
(-0.0090)

204054

Kansas

nondoweled

JRCP

9
(29.52)

-0.13
(-0.0051)

 0.00
(0.00)

-0.46
(-0.0179)

*positive values indicate increase in joint opening

Analysis of figure 75 also shows no appreciable difference in joint movement distributions between doweled JPCP and JRCP, although mean joint spacing of the latter is much greater.  A possible explanation is that development of midpanel cracks in JRCP effectively reduces JRCP joint spacing.  It was also observed that daily joint movements of nondoweled joints were somewhat lower than doweled joints.  No reasonable explanation was found for this phenomenon.

1 mm = .039 inch

Figure 75. Changes in joint opening from different measurement passes on the same day of measurements. Change in joint opening, from negative 2 to 2 millimeters, is graphed on the horizontal axis. Percent of observations, from 0 to 35, is graphed on the vertical axis. The figure is a histogram with three sites. The sites are doweled jointed plain concrete pavement, doweled jointed reinforced concrete pavement, and nondoweled jointed plain concrete pavement. All three joints begin at low points but increase towards zero millimeters, then decrease again. There is no appreciable difference in joint movement distributions between doweled joint plain concrete pavement and joint reinforced concrete pavement.

Figure 75.  Changes in joint opening from different measurement passes on the same day of measurements.

Seasonal Variation in Joint Opening

In this study, gage distance data were used to evaluate seasonal variation in joint opening.  To reduce the effect of daily variability in joint opening, only measurements from the first pass of gage measurements were considered.  The changes in joint opening from the reference measurement were matched with changes in mean PCC temperature throughout the PCC slab thickness (average of PCC temperatures at the top surface, at the bottom surface, and in the middepth location).  For each SMP section, plots of changes in joint opening versus change in mean PCC temperature were then prepared and analyzed.  It was found that, for several sections, significant changes in relationships between joint movement and PCC temperature might exist if a significant gap (several years) in joint opening measurements exists.  In these cases, a new reference measurement was assigned for subsequent changes in joint opening and PCC temperature.  Finally, a linear regression for change in joint opening and change in PCC temperature was performed for each section.

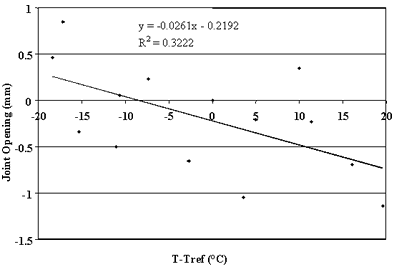
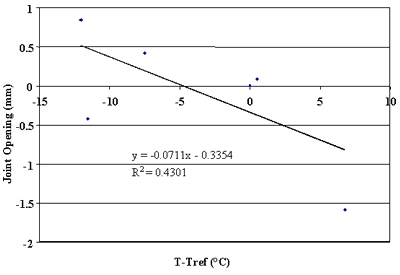
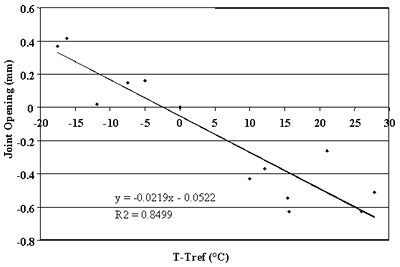
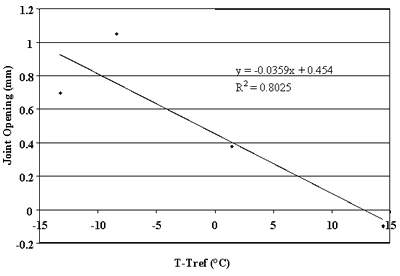
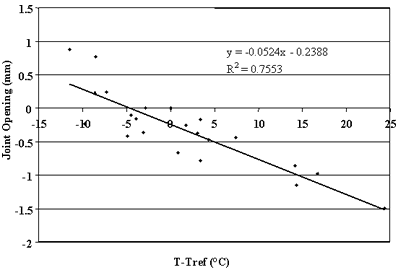
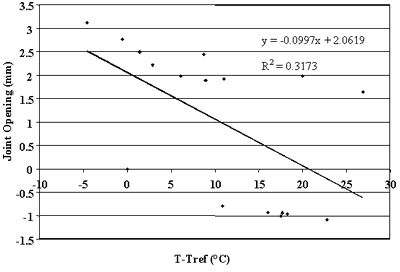
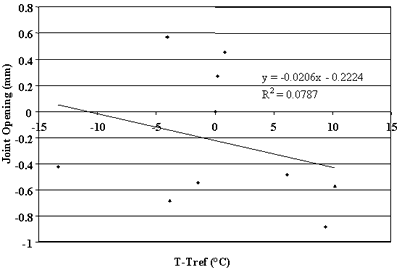
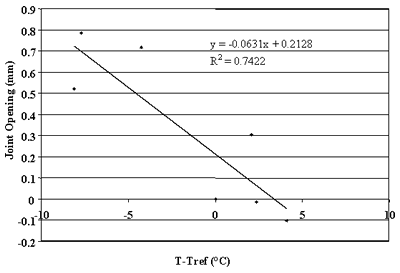
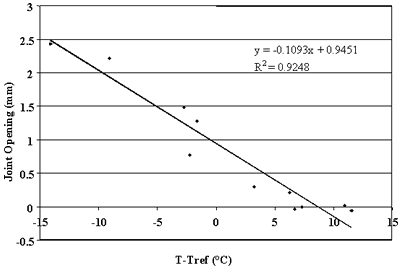
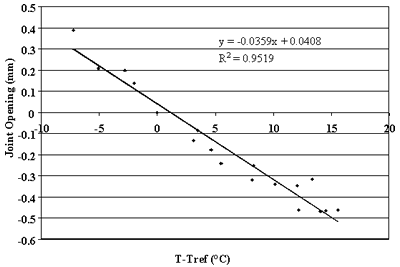
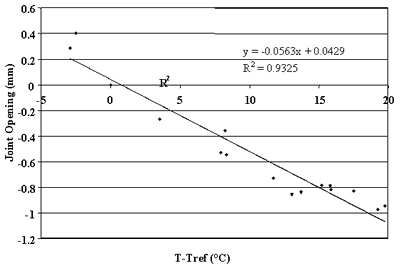
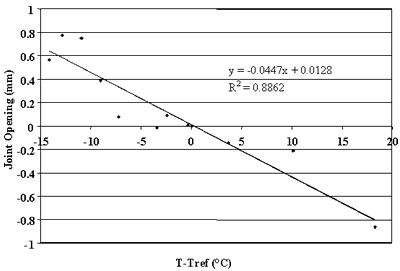
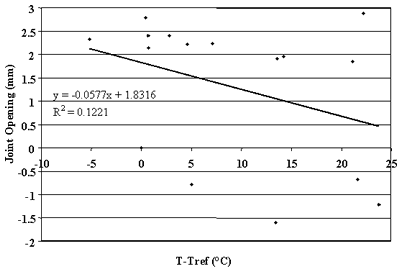
Figures 76 through 90 present some trends identified in this study.  Strong correlations were observed between changes in joint opening and changes in PCC temperature for sections 133019, 204054, 274040, 39024, 421606, 484142, 484143, and 493011.  For these sections, linear regressions between changes in joint opening and changes in PCC temperatures that resulted in percent.  Thus, more than 75 percent of the changes in joint opening can be explained by changes in PCC temperature.  Conversely, very poor correlations were found for sections 040215, 370201, and 893015 (see figures 76, 83, and 90).

F = 1.8C + 32

Figure 76. Change in joint opening versus change in PCC temperature, section 040215. T-Tref, or portland cement concrete temperature, from negative 20 to 20 degrees Celsius, is graphed on the horizontal axis. Joint opening, from negative 1.5 to 1 millimeters, is graphed on the vertical axis. The figure is a scatter plot with a linear slope of Y equals negative 0.0261 times X minus 0.2192 and a differential coefficient (R squared) equals 0.3222. The line begins at the highest joint opening (0.3 millimeters) at negative 18 degrees and decreases in a straight line to the lowest joint opening (negative 0.7) at 19 degrees. As the temperature increases, the joint opening decreases. There was not a strong correlation between changes in joint opening and changes in portland cement concrete temperature.

Figure 76.  Change in joint opening versus change in PCC temperature, section 040215.

F = 1.8C + 32

Figure 77. Change in joint opening versus change in PCC temperature, section 063042. T-Tref, or portland cement concrete temperature, from negative 15 to 10 degrees Celsius, is graphed on the horizontal axis. Joint opening, from negative 2 to 1 millimeter, is graphed on the vertical axis. The figure has a linear slope of Y equals negative 0.0711 times X minus 0.3354 and a coefficient of determination (R squared) equals 0.4301. The line begins at the highest joint opening (0.5 millimeters) at negative 13 degrees and decreases in a straight line to the lowest joint opening (negative 0.7) at 7 degrees. As the temperature increases, the joint opening slightly decreases. There is a significant correlation between changes in joint opening and changes in portland cement concrete temperature.

Figure 77.  Change in joint opening versus change in PCC temperature, section 063042.

F = 1.8C + 32

Figure 78. Change in joint opening versus change in PCC temperature, section 133019. T-Tref, or portland cement concrete temperature, from negative 20 to 30 degrees Celsius, is graphed on the horizontal axis. Joint opening, from negative 0.8 to 0.6 millimeters, is graphed on the vertical axis. The figure has a linear slope of Y equals negative 0.0219 times X minus 0.0522 and a coefficient of determination (R squared) equals 0.8499. The line begins at the highest joint opening (0.3 millimeters) at negative 18 degrees and decreases in a straight line to the lowest joint opening (negative 0.7) at 28 degrees. As the temperature increases, the joint opening decreases. There is a strong correlation between changes in joint opening and changes in portland cement concrete temperature.

Figure 78.  Change in joint opening versus change in PCC temperature, section 133019.

F = 1.8C + 32

Figure 79. Change in joint opening versus change in PCC temperature, section 204054. T-Tref, or portland cement concrete temperature, from negative 15 to 15 degrees Celsius, is graphed on the horizontal axis. Joint opening, from negative 0.2 to 1.2 millimeters, is graphed on the vertical axis. The figure has a linear slope of Y equals negative 0.0359 times X plus 0.454 and a coefficient of determination (R squared) equals 0.8025. The line begins at the highest joint opening (0.9 millimeters) at negative 13 degrees and decreases in a straight line to the lowest joint opening (negative 0.1) at 14 degrees. As the temperature increases, the joint opening decreases. There is a strong correlation between changes in joint opening and changes in portland cement concrete temperature.

Figure 79. Change in joint opening versus change in PCC temperature, section 204054.

F = 1.8C + 32

Figure 80. Change in joint opening versus change in PCC temperature, section 274040. T-Tref, or portland cement concrete temperature, from negative 15 to 25 degrees Celsius, is graphed on the horizontal axis. Joint opening, from negative 2 to 1.2 millimeters, is graphed on the vertical axis. The figure has a linear slope of Y equals negative 0.0524 times X minus 0.2388 and a coefficient of determination (R squared) equals 0.7553. The line begins at the highest joint opening (0.4 millimeters) at negative 12 degrees and decreases in a straight line to the lowest joint opening (negative 1.5) at 24 degrees. As the temperature increases, the joint opening decreases. There is a strong correlation between changes in joint opening and changes in portland cement concrete temperature.

Figure 80.  Change in joint opening versus change in PCC temperature, section 274040.

F = 1.8C + 32

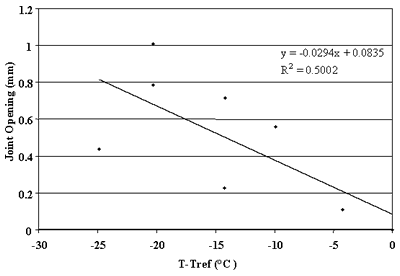
Figure 81. Change in the joint opening versus change in PCC temperature, section 313018. T-Tref, or portland cement concrete temperature, from negative 30 to 0 degrees Celsius, is graphed on the horizontal axis. Joint opening, from 0 to 1.2 millimeters, is graphed on the vertical axis. The figure has a linear slope of Y equals negative 0.0294 times X plus 0.0835 and a coefficient of determination (R squared) equals 0.5002. The line begins at the highest joint opening (0.8 millimeters) at negative 25 degrees and decreases in a straight line to the lowest joint opening (0.1) at 0 degrees. As the temperature increases, the joint opening decreases. There is a strong correlation between changes in joint opening and changes in portland cement concrete temperature.

Figure 81.  Change in joint opening versus change in PCC temperature, section 313018.

F = 1.8C + 32

Figure 82. Change in joint opening versus change in PCC temperature, section 364018. T-Tref, or portland cement concrete temperature, from negative 10 to 30 degrees Celsius, is graphed on the horizontal axis. Joint opening, from negative 1.5 to 3.5 millimeters, is graphed on the vertical axis. The figure has a linear slope of Y equals negative 0.0997 times X plus 2.0619 and a coefficient of determination (R squared) equals 0.3173. The line begins at the highest joint opening (2.5 millimeters) at negative 5 degrees and decreases in a straight line to the lowest joint opening (negative 0.5) at 25 degrees. As the temperature increases, the joint opening decreases. There is a strong correlation between changes in joint opening and changes in portland cement concrete temperature.

Figure 82.  Change in joint opening versus change in PCC temperature, section 364018.

F = 1.8C + 32

Figure 83. Change in joint opening versus change in PCC temperature, section 370201. T-Tref, or portland cement concrete temperature, from negative 15 to 15 degrees Celsius, is graphed on the horizontal axis. Joint opening, from negative 1 to 0.8 millimeters, is graphed on the vertical axis. The figure has a linear slope of Y equals negative 0.0206 times X minus 0.2224 and a coefficient of determination (R squared) equals 0.0787. The line begins at the highest joint opening (0.05 millimeters) at negative 14 degrees and decreases in a straight line to the lowest joint opening (negative 0.42) at 10 degrees. As the temperature increases, the joint opening slightly decreases. There is a poor correlation between changes in joint opening and changes in portland cement concrete temperature.

Figure 83. Change in joint opening versus change in PCC temperature, section 370201.

F = 1.8C + 32

Figure 84. Change in joint opening versus change in PCC temperature, section 390204. T-Tref, or portland cement concrete temperature, from negative 10 to 10 degrees Celsius, is graphed on the horizontal axis. Joint opening, from negative 0.2 to 0.9 millimeters, is graphed on the vertical axis. The figure has a linear slope of Y equals negative 0.0631 times X plus 0.2128 and a coefficient of determination (R squared) equals 0.7422. The line begins at the highest joint opening (0.73 millimeters) at negative 8 degrees and decreases in a straight line to the lowest joint opening (negative 0.05 millimeters) at 4 degrees. As the temperature increases, the joint opening decreases. There is a strong correlation between changes in joint opening and changes in portland cement concrete temperature.

Figure 84.  Change in joint opening versus change in PCC temperature, section 390204.

F = 1.8C + 32

Figure 85. Change in joint opening versus change in PCC temperature, section 421606. T-Tref, or portland cement concrete temperature, from negative 15 to 15 degrees Celsius, is graphed on the horizontal axis. Joint opening, from negative 0.5 to 3 millimeters, is graphed on the vertical axis. The figure has a linear slope of Y equals negative 0.1093 times X plus 0.9451 and a coefficient of determination (R squared) equals 0.9248. The line begins at the highest joint opening (2.5 millimeters) at negative 14 degrees and decreases in a straight line to the lowest joint opening (negative 0.3 millimeters) at 12 degrees. As the temperature increases, the joint opening decreases. There is a strong correlation between changes in joint opening and changes in portland cement concrete temperature.

Figure 85.  Change in joint opening versus change in PCC temperature, section 421606.

F = 1.8C + 32

Figure 86. Change in joint opening versus change in PCC temperature, section 484142. T-Tref, or portland cement concrete temperature, from negative 10 to 20 degrees Celsius, is graphed on the horizontal axis. Joint opening, from negative 0.6 to 0.5 millimeters, is graphed on the vertical axis. The figure has a linear slope of Y equals negative 0.0359 times X plus 0.0408 and a coefficient of determination (R squared) equals 0.9519. The line begins at the highest joint opening (0.3 millimeters) at negative 7 degrees and decreases in a straight line to the lowest joint opening (negative 0.5 millimeters) at 15 degrees. As the temperature increases, the joint opening decreases. There is a strong correlation between changes in joint opening and changes in portland cement concrete temperature.

Figure 86.  Change in joint opening versus change in PCC temperature, section 484142.

F = 1.8C + 32

Figure 87. Change in joint opening versus change in PCC temperature, section 484143. T-Tref, or portland cement concrete temperature, from negative 5 to 20 degrees Celsius, is graphed on the horizontal axis. Joint opening, from negative 1.2 to 0.6 millimeters, is graphed on the vertical axis. The figure has a linear slope of Y equals negative 0.0563 times X plus 0.0429 and a coefficient of determination (R squared) equals 0.9325. The line begins at the highest joint opening (0.2 millimeters) at negative 3 degrees and decreases in a straight line to the lowest joint opening (negative 1 millimeters) at 18 degrees. As the temperature increases, the joint opening decreases. There is a strong correlation between changes in joint opening and changes in portland cement concrete temperature.

Figure 87.  Change in joint opening versus change in PCC temperature, section 484143.

F = 1.8C + 32

Figure 88. Change in joint opening versus change in PCC temperature, section 493011. T-Tref, or portland cement concrete temperature, from negative 15 to 20 degrees Celsius, is graphed on the horizontal axis. Joint opening, from negative 1 to 1 millimeter, is graphed on the vertical axis. The figure has a linear slope of Y equals negative 0.0447 times X plus 0.0128 and a coefficient of determination (R squared) equals 0.8862. The line begins at the highest joint opening (0.6 millimeters) at negative 14 degrees and decreases in a straight line to the lowest joint opening (negative 0.8 millimeters) at 18 degrees. As the temperature increases, the joint opening decreases. There is a strong correlation between changes in joint opening and changes in portland cement concrete temperature.

Figure 88. Change in joint opening versus change in PCC temperature, section 493011.

F = 1.8C + 32

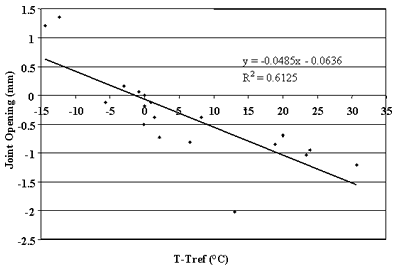
Figure 89. Change in joint opening versus change in PCC temperature, section 833802. T-Tref, or portland cement concrete temperature, from negative 15 to 35 degrees Celsius, is graphed on the horizontal axis. Joint opening, from negative 2.5 to 1.5 millimeters, is graphed on the vertical axis. The figure has a linear slope of Y equals negative 0.0485 times X minus 0.0636 and a coefficient of determination (R squared) equals 0.6125. The line begins at the highest joint opening (0.6millimeters) at negative 14 degrees and decreases in a straight line to the lowest joint opening (negative 1.5 millimeters) at 30 degrees. As the temperature increases, the joint opening decreases. There is a strong correlation between changes in joint opening and changes in portland cement concrete temperature.

Figure 89.  Change in joint opening versus change in PCC temperature, section 833802.

F = 1.8C + 32

Figure 90. Change in joint opening versus change in PCC temperature, section 893015. T-Tref, or portland cement concrete temperature, from negative 10 to 25 degrees Celsius, is graphed on the horizontal axis. Joint opening, from negative 2 to 3 millimeters, is graphed on the vertical axis. The figure has a linear slope of Y equals negative 0.0577 times X plus 1.8316 and a coefficient of determination (R squared) equals 0.1221. The line begins at the highest joint opening (2.1 millimeters) at negative 5 degrees and decreases in a straight line to the lowest joint opening (0.4 millimeters) at 23 degrees. As the temperature increases, the joint opening slightly decreases. There is a poor correlation between changes in joint opening and changes in portland cement concrete temperature.

Figure 90.  Change in joint opening versus change in PCC temperature, section 893015.

The slopes of linear regressions between changes in joint opening and changes in PCC temperatures were used to calculate the PCC/base friction factor for each section.

According to Darter et al. (1977), change in PCC temperature should produce the following change in joint opening:

Equation 25 The change in joint opening equals the portland cement concrete/base friction factor times the portland cement concrete coefficient of thermal expansion times the effective joint spacing times the change in portland cement concrete temperature.(25)


where:

-          The change in joint opening = the change in joint opening.

-          The change in PCC temperature = the change in PCC temperature.

-          b = the PCC/base friction factor.

-          a= the PCC coefficient of thermal expansion.

-          L = the effective joint spacing.

The PCC/base friction factor adjusts unrestrained movement of a slab at a joint to a lower value as a result of slab base friction.  Fora given section, a linear relationship between changes in joint opening and changes in PCC temperature has the following form:

Equation 26 The change in joint opening equals the sum total of the slope of the joint opening-temperature change relationship times the change in portland cement concrete temperature, plus the intercept of that relationship.                                                        (26)                

where:

-          k = the slope of the joint opening-temperature change relationship.

-          b = the intercept of that relationship.

If intercept b is ignored, then the friction factor can be determined from the following relationship:

Equation 27 The portland cement concrete/base friction factor equals the slope of the joint opening-temperature change relationship divided by the sum total of the portland cement concrete coefficient of thermal expansion times the effective joint spacing.                                                      (27)

Using this relationship, friction coefficients were determined for the sections with very low intercepts in the identified relationships.  For sections where joint spacing was longer than 6 m (20 ft), the presence of working transverse cracks reduced effective slab length.  To account for this effect, an effective joint spacing equal to one-half or one-third was assigned for each slab.  These spacing represent typical distances between transverse joints and cracks in jointed reinforced pavements.  Table 19 presents the results of this analysis.  One can observe that only one section (133019) resulted in a very low friction factor.  For all other sections, the friction factor ranges from 0.34 to 0.8, which agrees with the results of previous studies.

Table 19.  PCC/base friction factors for SMP LTPP sections.

Section

State

Base Type

Coefficient of Thermal Expansion, mm/mm/oC (inch/inch/°F)

Joint Spacing, m (ft)

Effective Joint Spacing, m (ft)

Slope k mm/oC (inch/°F)

Friction Factor

133019

Georgia

AGG

      1.00 (0.56)

6 .00(19.68)

6.0 (19.68)

0.0068 (0.00015)

0.11

204054

Kansas

CTB

1.09 (0.61)

9.00 (29.52)

  4.5 (14.76)

0.0111 (0.00024)

0.40

274040

Minnesota

AGG

1.02 (0.57)

  8.10 (26.57)

4.05 (13.28)

0.0161 (0.00035)

0.69

390204

Ohio

AGG

0.95 (0.53)

 4.50 (14.76)

4.5 (14.76)

0.0194 (0.00043)

0.81

421606

Pennsylvania

AGG

1.24 (0.69)

 13.95 (45.76)

  6.9 (22.63)

0.0339 (0.00075)

0.70

484142

Texas

AGG

0.95 (0.53)

 18.15 (59.53)

6.0 (19.68)

0.0111 (0.00024)

0.35

484143

Texas

CTB

0.95 (0.53)

 18.15 (59.53)

6.0 (19.68)

0.0172 (0.00038)

0.53

493011

Utah

CTB

0.95 (0.53)

4.50 (14.76)

4.5 (14.76)

0.0139 (0.00031)

0.58

833802

Manitoba

CTB

1.03 (0.58)

4.50 (14.76)

4.5 (14.76)

0.0149 (0.00033)

0.57

 1 mm/mm/°C = 0.56 inch/inch/°F
1 mm/°C = 0.22 inch/°F

Effects of Joint Opening on LTE

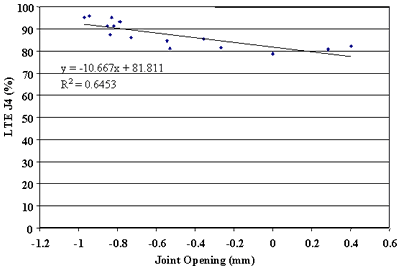
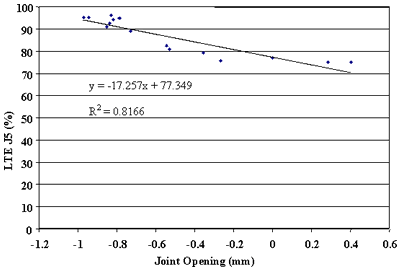
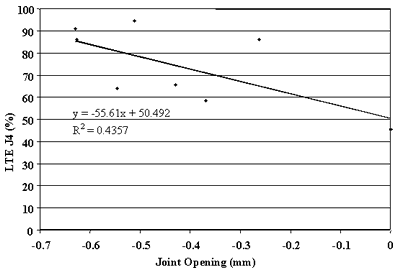
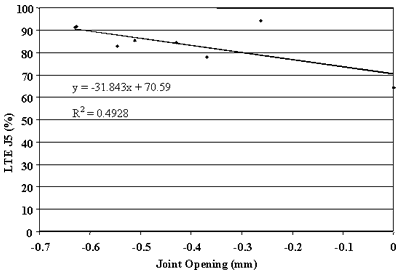
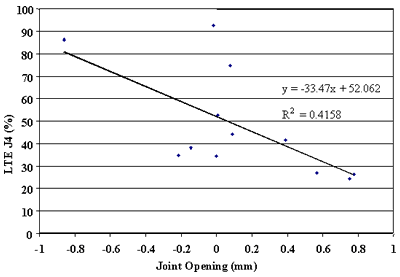
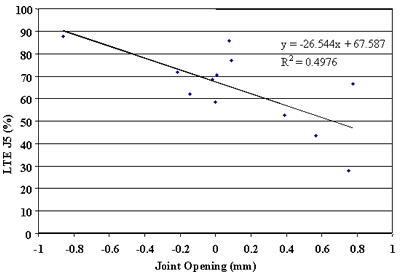
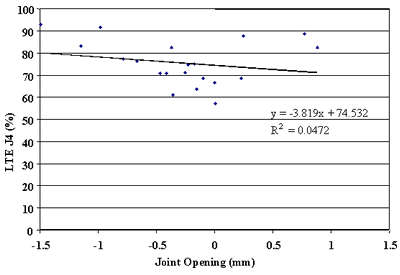
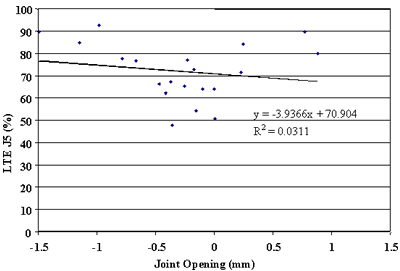
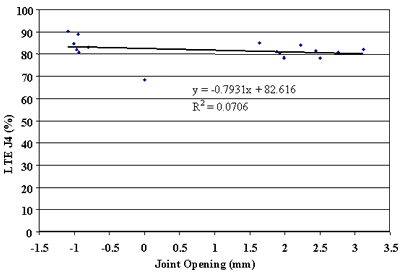
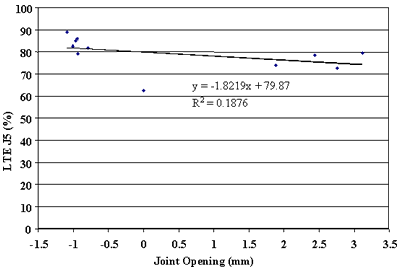
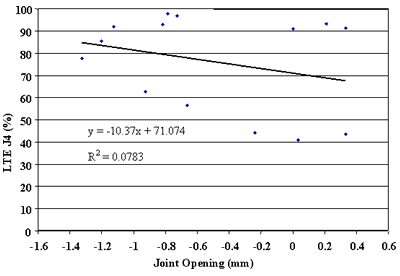
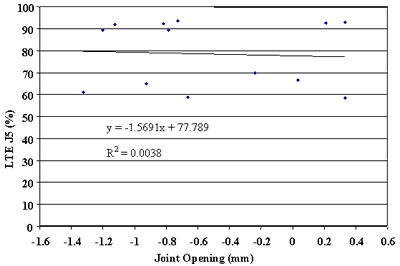
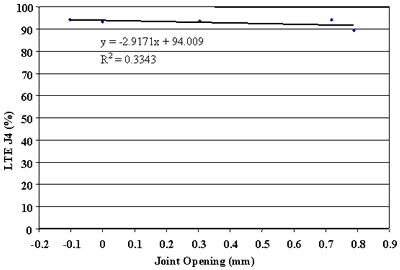
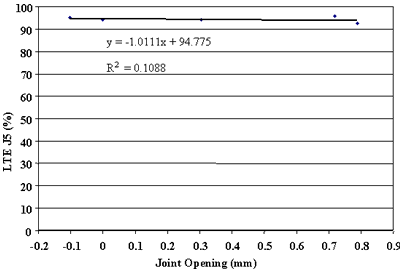
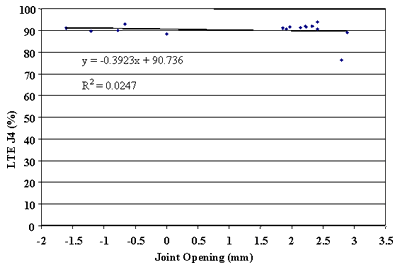
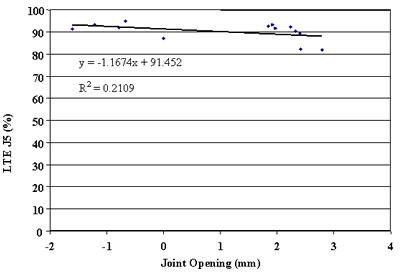
Finally, the effect of change in joint opening on LTE was conducted.  Figures 91 through 108 present joint opening versus LTEs for the LTPP SMP sections.  For each section, LTEs from leave and approach tests are plotted separately.  Surprisingly, only two sections, 484142 and 484143, showed very strong relationships between LTEs and joint opening (see figures 91 through 94).  Two other sections, 133019 and 493011, show moderately strong relationships between joint opening and LTE (see figures 95 through 98).  For all other sections, very weak relationships were found (see figures 99 through 108).  At this point, it is premature to say what caused these poor correlations. They may be explained by measurement errors in joint opening, or a contribution of factors, including PCC slab curling.  More research is needed to clarify this issue.

1 mm = .039 inch

Figure 91. Approach LTE versus joint opening, section 484142. Joint opening, from negative 0.5 to 0.3 millimeters, is graphed in the horizontal axis. Load transfer efficiency J4, percent, is graphed on the vertical axis. The figure has a linear slope of Y equals negative 10.701 times X plus 87.705 and a coefficient of determination (R squared) equals 0.7554. The line begins at the highest load transfer efficiency (94 percent) at negative 0.48 millimeters and slightly decreases in a straight line to the lowest load transfer efficiency (85 percent) at 0.2 millimeters. As the joint opening increases, the load transfer efficiency slightly decreases. There is a very strong relationship between load transfer efficiency and joint opening.

Figure 91. Approach LTE versus joint opening, section 484142.

1 mm = .039 inch

Figure 92. Leave LTE versus joint opening, section 484142. Joint opening, from negative 0.5 to 0.3 millimeters, is graphed on the horizontal axis. Load transfer efficiency J5, percent, is graphed on the vertical axis. The figure has a linear slope of Y equals negative 14.005 times X plus 87.708 and a coefficient of determination (R squared) equals 0.7726. The line begins at the highest load transfer efficiency (94 percent) at negative 0.48 millimeters and decreases in a straight line to the lowest load transfer efficiency (85 percent) at 0.23 millimeters. As the joint opening increases, the load transfer efficiency slightly decreases. There is a very strong relationship between load transfer efficiency and joint opening.

Figure 92. Leave LTE versus joint opening, section 484142.

1 mm = .039 inch

Figure 93. Approach LTE versus joint opening, section 484143. Joint opening, negative 1.2 to 0.6 millimeters, is graphed on the horizontal axis. Load transfer efficiency J4, percent, is graphed on the vertical axis. The figure has a linear slope of Y equals negative 10.667 times X plus 81.811 and a coefficient of determination (R squared) equals 0.6453. The line begins at the highest load transfer efficiency (92 percent) at negative 1 millimeter and decreases in a straight line to the lowest load transfer efficiency (78 percent) at 0.35 millimeters. As the joint opening increases, the load transfer efficiency decreases. There is a very strong relationship between load transfer efficiency and joint opening.

Figure 93. Approach LTE versus joint opening, section 484143.

1 mm = .039 inch

Figure 94. Leave LTE versus joint opening, section 484143. Joint opening, from negative 1.2 to 0.6 millimeters, is graphed on the horizontal axis. Load transfer efficiency J5, percent, is graphed on the vertical axis. The figure has a linear slope of Y equals negative 17.257 times X plus 77.349 and a coefficient of determination (R squared) equals 0.8166. The line begins at the highest load transfer efficiency (95 percent) at negative 1 millimeter and decreases in a straight line to the lowest load transfer efficiency (70 percent) at 0.4 millimeters. As the joint opening increases, the load transfer efficiency decreases. There is a very strong relationship between load transfer efficiency and joint opening.

Figure 94. Leave LTE versus joint opening, section 484143.

1 mm = .039 inch

Figure 95. Approach LTE versus joint opening, section 133019. Joint opening, from negative 0.7 to 0 millimeters, is graphed on the horizontal axis. Load transfer efficiency J4, percent, is graphed on the vertical axis. The figure has a linear slope of Y equals negative 55.61 times X plus 50.492 and a coefficient of determination (R squared) equals 0.4357. The line begins at the highest load transfer efficiency (85 percent) at negative 0.65 millimeters and decreases in a straight line to the lowest load transfer efficiency (50 percent) at 0 millimeters. As the joint opening increases, the load transfer efficiency decreases. There is a moderately strong relationship between load transfer efficiency and joint opening.

Figure 95. Approach LTE versus joint opening, section 133019.

1 mm = .039 inch

Figure 96. Leave LTE versus joint opening, section 133019. Joint opening, from negative .7 to 0 millimeters, is graphed on the horizontal axis. Load transfer efficiency J5, percent, is graphed on the vertical axis. The figure has a linear slope of Y equals negative 31.843 times X plus 70.59 and a coefficient of determination (R squared) equals 0.4928. The line begins at the highest load transfer efficiency (90 percent) at negative 0.64 millimeters and decreases in a straight line to the lowest load transfer efficiency (70 percent) at 0 millimeters. As the joint opening increases, the load transfer efficiency decreases. There is a moderate relationship between load transfer efficiency and joint opening.

Figure 96. Leave LTE versus joint opening, section 133019.

1 mm = .039 inch

Figure 97. Approach LTE versus joint opening, section 493011. Joint opening, from negative 1 to 1 millimeter, is graphed on the horizontal axis. Load transfer efficiency J4, percent, is graphed on the vertical axis. The figure has a linear slope of Y equals negative 33.47 times X plus 52.062 and a coefficient of determination (R squared) equals 0.4158. The line begins at the highest load transfer efficiency (80 percent) at negative 0.81 millimeters and decreases in a straight line to the lowest load transfer efficiency (25 percent) at 0.7 millimeters. As the joint opening increases, the load transfer efficiency decreases. There is a moderately strong relationship between load transfer efficiency and joint opening.

Figure 97. Approach LTE versus joint opening, section 493011.

1 mm = .039 inch

Figure 98. Leave LTE versus joint opening, section 493011. Joint opening, from negative 1 to 1 millimeter, is graphed on the horizontal axis. Load transfer efficiency J5, percent, is graphed on the vertical axis. The figure has a linear slope of Y equals negative 26.544 times X plus 67.587 and a coefficient of determination (R squared) equals 0.4976. The line begins at the highest load transfer efficiency (90 percent) at negative 0.9 millimeters and decreases in a straight line to the lowest load transfer efficiency (48 percent) at 0.7 millimeters. As the joint opening increases, the load transfer efficiency decreases. There is a moderately strong relationship between load transfer efficiency and joint opening.

Figure 98. Leave LTE versus joint opening, section 493011.

1 mm = .039 inch

Figure 99. Approach LTE versus joint opening, section 274040. Joint opening, from negative 1.5 to 1.5 millimeters, is graphed on the horizontal axis. Load transfer efficiency J4, percent, is graphed on the vertical axis. The figure has a linear slope of Y equals negative 3.819 times X plus 74.532 and a coefficient of determination (R squared) equals 0.0472. The line begins at the highest load transfer efficiency (80 percent) at negative 1.5 millimeters and decreases in a straight line to the lowest load transfer efficiency (71 percent) at 0.8 millimeters. As the joint opening increases, the load transfer efficiency decreases. There is a very weak relationship between load transfer efficiency and joint opening.

Figure 99. Approach LTE versus joint opening, section 274040.

1 mm = .039 inch 1

Figure 100. Leave LTE versus joint opening, section 274040. Joint opening, from negative 1.5 to 1.5 millimeters, is graphed on the horizontal axis. Load transfer efficiency J5, percent, is graphed on the vertical axis. The figure has a linear slope of Y equals negative 3.9366 times X plus 70.904 and a coefficient of determination (R squared) equals 0.0311. The line begins at the highest load transfer efficiency (78 percent) at negative 1.5 millimeters and decreases in a straight line to the lowest load transfer efficiency (68 percent) at 0.8 millimeters. As the joint opening increases, the load transfer efficiency decreases. There is a very weak relationship between load transfer efficiency and joint opening.

Figure 100. Leave LTE versus joint opening, section 274040.

1 mm = .039 inch

Figure 101. Approach LTE versus joint opening, section 364018. Joint opening, from negative 1.5 to 3.5 millimeters, is graphed on the horizontal axis. Load transfer efficiency J4, percent, is graphed on the vertical axis. The figure has a linear slope of Y equals negative 0.7931 times X plus 82.616 and a coefficient of determination (R squared) equals 0.0706 The line begins at the highest load transfer efficiency (84 percent) at negative 1.2 millimeters and slightly decreases in a straight line to the lowest load transfer efficiency (80 percent) at 3 millimeters. As the joint opening increases, the load transfer efficiency decreases. There is a very weak relationship between load transfer efficiency and joint opening.

Figure 101. Approach LTE versus joint opening, section 364018.

1 mm = .039 inch

Figure 102. Leave LTE versus joint opening, section 364018. Joint opening, from negative 1.5 to 3.5 millimeters, is graphed on the horizontal axis. Load transfer efficiency J5, percent, is graphed on the vertical axis. The figure has a linear slope of Y equals negative 1.8219 times X plus 79.87 and a coefficient of determination (R squared) equals 0.1876. The line begins at the highest load transfer efficiency (82 percent) at negative 1.3 millimeters and slightly decreases in a straight line to the lowest load transfer efficiency (75 percent) at 3.3 millimeters. As the joint opening increases, the load transfer efficiency decreases. There is a very weak relationship between load transfer efficiency and joint opening.

Figure 102. Leave LTE versus joint opening, section 364018.

1 mm = .039 inch

Figure 103. Approach LTE versus joint opening, section 370201. Joint opening, from negative 1.6 to 0.6 millimeters, is graphed on the horizontal axis. Load transfer efficiency J4, percent, is graphed on the vertical axis. The figure has a linear slope of Y equals negative 10.37 times X plus 71.074 and a coefficient of determination (R squared) equals 0.0783. The line begins at the highest load transfer efficiency (85 percent) at negative 1.3 millimeters and decreases in a straight line to the lowest load transfer efficiency (68 percent) at 0.3 millimeters. As the joint opening increases, the load transfer efficiency decreases. There is a very weak relationship between load transfer efficiency and joint opening.

Figure 103. Approach LTE versus joint opening, section 370201.

1 mm = .039 inch

Figure 104. Leave LTE versus joint opening, section 370201. Joint opening, from negative 1.6 to 0.6 millimeters, is graphed on the horizontal axis. Load transfer efficiency J5, percent, is graphed on the vertical axis. The figure has a linear slope of Y equals negative 1.5691 times X plus 77.789 and a coefficient of determination (R squared) equals 0.0038. The line begins at the highest load transfer efficiency (80 percent) at negative 1.3 millimeters and slightly decreases in a straight line to the lowest load transfer efficiency (77 percent) at 0.3 millimeters. As the joint opening increases, the load transfer efficiency slightly decreases. There is a very weak relationship between load transfer efficiency and joint opening.

Figure 104. Leave LTE versus joint opening, section 370201.

1 mm = .039 inch

Figure 105. Approach LTE versus joint opening, section 390204. Joint opening, from negative 0.2 to 0.9 millimeters, is graphed on the horizontal axis. Load transfer efficiency J4, percent, is graphed on the vertical axis. The figure has a linear slope of Y equals negative 2.9171 times X plus 94.009 and a coefficient of determination (R squared) equals 0.3343. The line begins at the highest load transfer efficiency (94 percent) at negative 0.1 millimeters and just barely decreases in a straight line to the lowest load transfer efficiency (92 percent) at 0.8 millimeters. As the joint opening increases, the load transfer efficiency slightly decreases. There is a very weak relationship between load transfer efficiency and joint opening.

Figure 105. Approach LTE versus joint opening, section 390204.

1 mm = .039 inch

Figure 106. Leave LTE versus joint opening, section 390204. Joint opening, from negative 0.2 to 0.9 millimeters, is graphed on the horizontal axis. Load transfer efficiency J5, percent, is graphed on the vertical axis. The figure has a linear slope of Y equals negative 1.0111 times X plus 94.7755 and a coefficient of determination (R squared) equals 0.1088. The line begins at the highest load transfer efficiency (95 percent) at negative 0.1 millimeters and just barely decreases in a straight line to the lowest load transfer efficiency (93 percent) at 0.75 millimeters. As the joint opening increases, the load transfer efficiency slightly decreases. There is a very weak relationship between load transfer efficiency and joint opening.

Figure 106. Leave LTE versus joint opening, section 390204.

1 mm = .039 inch

Figure 107. Approach LTE versus joint opening, section 893015. Joint opening, from negative 2 to 3.5 millimeters, is graphed on the horizontal axis. Load transfer efficiency J4, percent, is graphed on the vertical axis. The figure has a linear slope of Y equals negative .03923 times X plus 90.736 and a coefficient of determination (R squared) equals 0.0247. The line begins at the highest load transfer efficiency (91 percent) at negative 1.75 millimeters and just barely decreases in a straight line to the lowest load transfer efficiency (89 percent) at 2.75 millimeters. As the joint opening increases, the load transfer efficiency slightly decreases. There is a very weak relationship between load transfer efficiency and joint opening.

Figure 107. Approach LTE versus joint opening, section 893015.

1 mm = .039 inch

Figure 108. Leave LTE versus joint opening, section 893015. Joint opening, from negative 2 to 4 millimeters, is graphed on the horizontal axis. Load transfer efficiency J5, percent, is graphed on the vertical axis. The figure has a linear slope of Y equals negative 1.1674 times X plus 91.452 and a coefficient of determination (R squared) equals 0.2109. The line begins at the highest load transfer efficiency (94 percent) at negative 1.6 millimeters and slightly decreases in a straight line to the lowest load transfer efficiency (88 percent) at 2.6 millimeters. As the joint opening increases, the load transfer efficiency slightly decreases. There is a very weak relationship between load transfer efficiency and joint opening.

Figure 108. Leave LTE versus joint opening, section 893015.

Previous | Table of Contents | Next

Federal Highway Administration | 1200 New Jersey Avenue, SE | Washington, DC 20590 | 202-366-4000
Turner-Fairbank Highway Research Center | 6300 Georgetown Pike | McLean, VA | 22101