U.S. Department of Transportation
Federal Highway Administration
1200 New Jersey Avenue, SE
Washington, DC 20590
202-366-4000
Federal Highway Administration Research and Technology
Coordinating, Developing, and Delivering Highway Transportation Innovations
 |
| This report is an archived publication and may contain dated technical, contact, and link information |
|
Publication Number: FHWA-RD-02-112 Date: NOVEMBER 2002 |
PDF files can be viewed with the Acrobat® Reader®
Pavement smoothness is a key factor in determining highway user satisfaction. To adequately represent drivers' opinions of roadway conditions, many highway agencies are transitioning to the International Roughness Index (IRI) or to the Profile Index (PI) using a 0.0-millimeter (mm) blanking band (PI0.0) from the PI using a 5-mm or 2.5-mm blanking band (PI5-mm or PI2.5-mm). This has led to the need for correlation equations to relate the current PI5-mm or PI2.5-mm smoothness specification levels with those to be used in the new specifications.
To address this issue, research was initiated to develop a practical tool to assist in the transition from PI5-mm or PI2.5-mm to IRI or PI0.0. Information developed in this research can be used by highway agencies to estimate the level of IRI and PI0.0 smoothness associated with their current pavement smoothness specifications.
Key findings of this research include:
The FHWA Long-Term Pavement Performance (LTPP) Program provided profile data used in this research. Since 1996, LTPP has collected pavement surface profile data from more than 1,700 test sections (typically 152.5 meters (m) long) across the United States and Canada. LTPP uses a high-speed inertial profiler, rated as class I according to ASTM E-950-98, to record profile data at 25-mm intervals. IRI values for each profile are computed using LTPP software according to the ASTM E-1926-98 protocols. Researchers obtained climatic and pavement type information from the LTPP database.
To determine the PI values from the profiles, researchers employed a commonly used simulation method. Lightweight profilers simulating PI values have been in use for more than 5 years, and several manufacturers have proven that they can correlate well with PIs obtained from profilographs. For this study, researchers used the algorithm employed by the lightweight profiler that the LTPP profiler manufacturer developed. Because the same sensors, filtering, and sampling interval are used for the manufacturer's high-speed profiler and lightweight profiler, this simulation held the best promise of matching profilograph PI output.
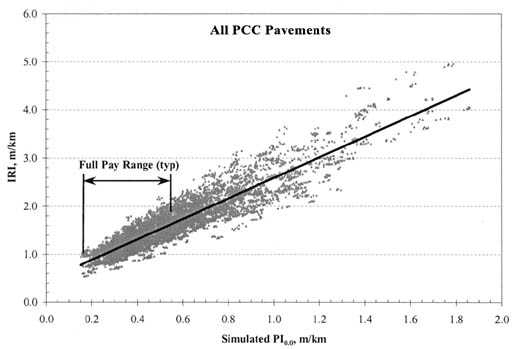
Based on the data shown in figures 1 and 2, a linear relationship is evident between IRI and PI0.0 for both asphalt concrete (AC) and portland cement concrete (PCC) pavements. Rather good correlation coefficients result from these direct comparisons, with an R2 of 0.87 and 0.83 for AC and PCC pavements, respectively.
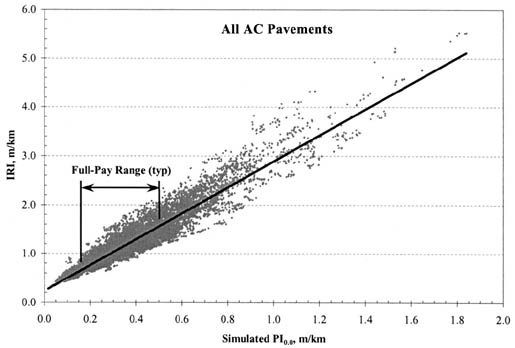
Figure 2. IRI vs. PI0.0 for PCC pavements.
Statistical analysis reveals that, in certain instances, a small portion of the variability in the relationships between IRI and PI can be related to climate and pavement type. To provide agencies with the most accurate equations, these variables were included in the PI to IRI models shown in table 1.
Table 1. PI-to-IRI index conversion equations and variability indices.
| Pavement Type | Climatea | Blanking Band (mm) | Correlation Equation (IRI = mm/km, PI = mm/km) | N | SEE | R2 |
|---|---|---|---|---|---|---|
| AC | 1,2,3,4 | 0.0 | IRI = 2.66543*PI0.0 + 213.01 | 14,170 | 200.17 | 0.89 |
| AC | 1,2,3,4 | 5.0 | IRI = 3.78601*PI5-mm + 887.51 | 13,775 | 292.26 | 0.77 |
| AC/AC | 1 | 0.0 | IRI = 2.74599*PI0.0 + 265.42 | 1,854 | 191.97 | 0.91 |
| AC/AC | 2 | 0.0 | IRI = 2.68169*PI0.0 + 274.67 | 1,494 | 184.64 | 0.81 |
| AC/AC | 3,4 | 0.0 | IRI = 2.42295*PI0.0 + 301.90 | 5,126 | 178.81 | 0.84 |
| AC/AC | 1 | 5.0 | IRI = 4.25316*PI5-mm + 957.80 | 1,824 | 288.17 | 0.79 |
| AC/AC | 2 | 5.0 | IRI = 4.39478*PI5-mm + 883.20 | 1,345 | 308.23 | 0.45 |
| AC/AC | 3,4 | 5.0 | IRI = 3.42671*PI5-mm + 876.80 | 4,906 | 265.85 | 0.63 |
| AC/PCC | 1,2,3,4 | 0.0 | IRI = 2.40300*PI0.0 + 292.93 | 4,156 | 205.58 | 0.79 |
| PCC | 1,3 | 0.0 | IRI = 2.12173*PI0.0 + 439.76 | 12,039 | 259.63 | 0.84 |
| PCC | 2 | 0.0 | IRI = 2.58454*PI0.0 + 423.09 | 1,448 | 176.54 | 0.88 |
| PCC | 4 | 0.0 | IRI = 2.3582*PI0.0 + 317.19 | 2,888 | 236.51 | 0.84 |
| PCC | 1,3 | 5.0 | IRI = 2.62558*PI5-mm + 1,205.73 | 11,946 | 305.96 | 0.77 |
| PCC | 2 | 5.0 | IRI = 3.51673*PI5-mm + 1,226.35 | 1,364 | 268.70 | 0.72 |
| PCC | 4 | 5.0 | IRI = 2.87407*PI5-mm + 1,229.63 | 2,885 | 297.37 | 0.74 |
aClimatic zones: 1=DF, 2=DNF, 3=WF, 4=WNF.
Climatic regions used in these tables are defined as dry freeze (DF), dry non-freeze (DNF), wet freeze (WF), and wet non-freeze (WNF). Climates with average annual rainfall of more than 508 mm per year were considered as wet. Freezing climates were designated as having a freezing index of more than 66°C-days per year.
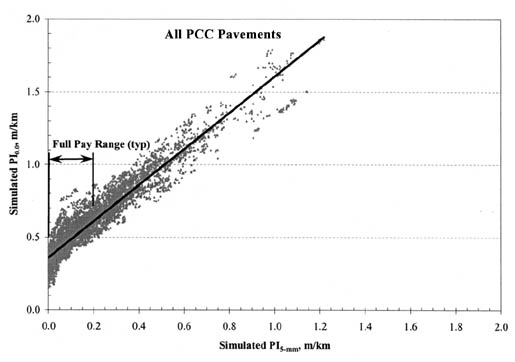
As expected, the relationship between PI5-mm and PI0.0 is also linear, as figures 3 and 4 illustrate. The variability in these relationships is an indication of the pavement roughness data that is lost when a wider blanking band is used. The R2 value for all AC pavements is 0.85, while it is increased to 0.90 for all PCC pavements.
Figure 3. PI0.0 vs. PI5.0 for AC pavements.
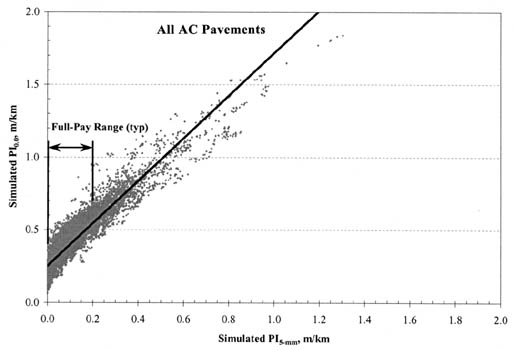
Figure 4. PI0.0 vs. PI5.0 for PCC pavements.
No statistical differences in the correlations were noted for jointed-plain, jointed-reinforced, and continuously reinforced concrete (JPC, JRC, and CRC) pavements. However, statistical differences were noted between original AC pavements, AC overlays of AC, and AC overlays of PCC. Also, climatic effects accounted for some of the variability in the equations. Therefore, the correlations in table 2 include several pavement types and climatic regions.
Table 2. PI-to-PI 0.0 index conversion equations and variability. PI-to-IRI index conversion equations and varibility indices.
| Pavement Type | Climatea | Correlation Equation(PI = mm/km) | N | SEE | R2 |
|---|---|---|---|---|---|
| AC | 1,3 | PI0.0 = 1.35776*PI5-mm + 275.48 | 5,684 | 83.58 | 0.88 |
| AC | 2,4 | PI0.0 = 1.46417*PI5-mm + 240.09 | 8,093 | 71.73 | 0.86 |
| AC/AC | 1 | PI0.0 = 1.56038*PI5-mm + 250.89 | 1,826 | 73.74 | 0.88 |
| AC/AC | 2 | PI0.0 = 1.75837*PI5-mm + 222.84 | 1,347 | 79.32 | 0.66 |
| AC/AC | 3,4 | PI0.0 = 1.45876*PI5-mm + 233.59 | 4,908 | 71.53 | 0.81 |
| PCC | 1 | PI0.0 = 1.39512*PI5-mm + 343.08 | 2,182 | 71.19 | 0.87 |
| PCC | 2 | PI0.0 = 1.36715*PI5-mm + 313.25 | 1,366 | 66.42 | 0.86 |
| PCC | 3 | PI0.0 = 1.20723*PI5-mm + 367.91 | 9,764 | 86.73 | 0.91 |
| PCC | 4 | PI0.0 = 1.19909*PI5-mm + 390.49 | 2,885 | 85.19 | 0.85 |
aClimatic zones: 1=DF, 2=DNF, 3=WF, 4=WNF.
These correlation equations can be used to assist agencies transition from the PI5-mm smoothness index to IRI or to PI0.0. For example, a wet-freeze State has specified a full-pay range for new PCC pavements of PI5-mm between 79 and 110 mm/kilometer (km). State officials can use equations 14 and 25 to determine that a comparable IRI range would be 1,413 to 1,495 mm/km and a comparable PI0.0 range would be 463 to 501 mm/km.
Similarly, for AC pavement smoothness specifications (full-pay is 64 to 110 mm/km), the State could use equations 2 and 17 to estimate a comparable IRI range of 1,130 to 1,304 mm/km and a comparable PI0.0 range of 362 to 425 mm/km.
To make this research useful, it is recommended that agencies:
|
Researcher -- This study was performed by ERES Consultants, 505 West University Avenue, Champaign, Illinois 61820-3915, (217) 356-4500. Contract No. GS-10F-0298K. Distribution -- This TechBrief is being distributed according to a standard distribution. Direct distribution is being made to the Resource Centers and Divisions. Availability -- The publication linked to this TechBrief is Pavement Smoothness Index Relationships, Final Report (Report No. FHWA-RD-02-057). It is available from the National Technical Information Service, 5285 Port Royal Road, Springfield, VA 22161. A limited number of copies will be available from the R&T Report Center, FHWA, 9701 Philadelphia Court, Unit Q, Lanham, MD 20706, telephone: (301) 577-0818, fax: (301) 577-1421. Key Words -- International Roughness Index, Profile Index, correlation, specification, smoothness. |
Notice -- This TechBrief is disseminated under the sponsorship of the Department of Transportation in the interest of information exchange. This TechBrief provides a synopsis of the study's final publication. The TechBrief does not establish policies or regulations, nor does it imply FHWA endorsement of the conclusions or recommendations. The U.S. Government assumes no liability for the contents or their use.

